
Alterations in Blood Cell Indices and Serological Parameters due to Toxicity of Industrial Leachate in Wistar Rats


Alterations in Blood Cell Indices and Serological Parameters due to Toxicity of Industrial Leachate in Wistar Rats
Muhammad Babar Khawar1, Muddasir Hassan Abbasi2*, Zillay Mariam1, Nadeem Sheikh1,2*

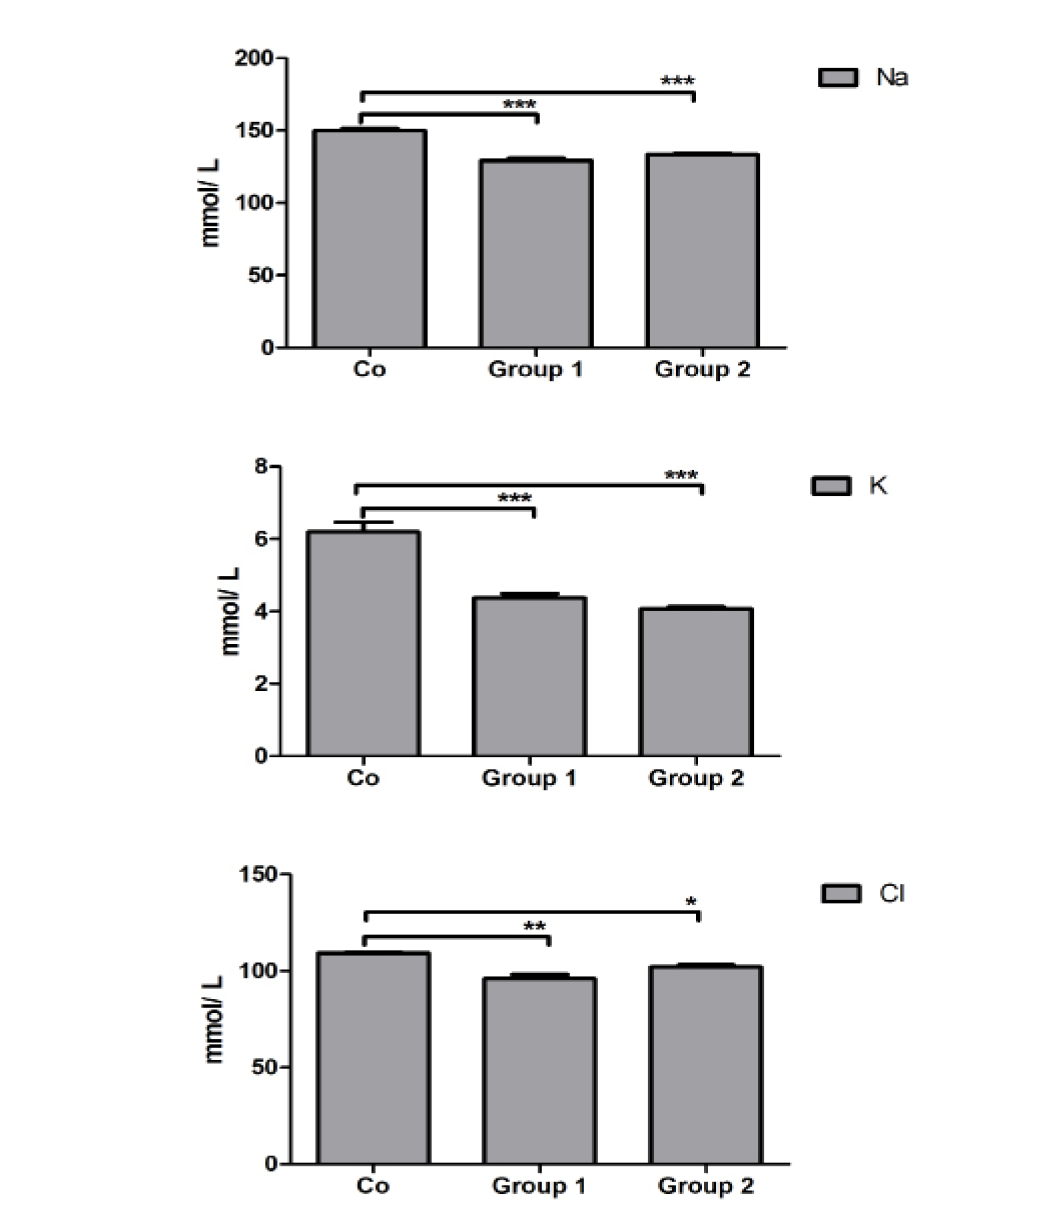
Level of various electrolytes in sera. Sodium level was found to be decreased significantly (P=0.0001) in both studied experimental groups as compared to the control group. Level of potassium and chloride were also decreased significantly against control. The results are representative of three animal series (mean ± S.E.M.).

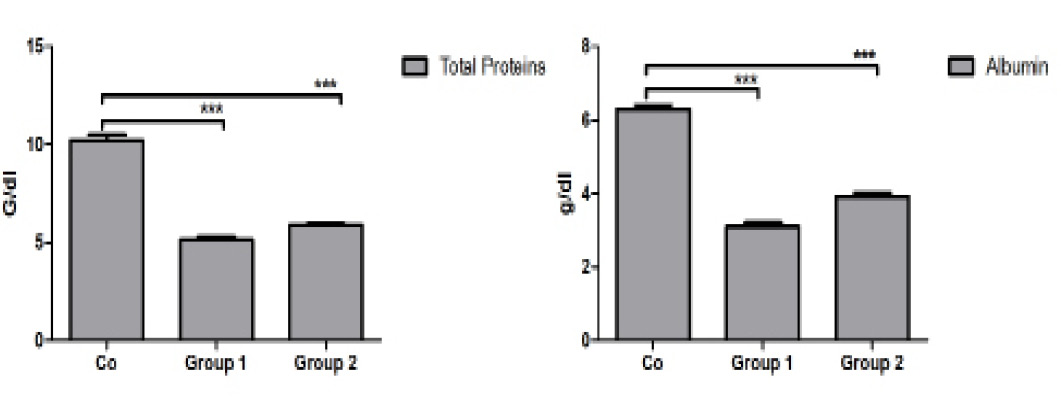
Level of total proteins and albumin in sera. The level of total proteins (P<0.0001) and albumin (P<0.0001) showed a similar trend and was found to be decreased significantly in both studied experimental groups as compared to the control group. The results are representative of three animal series (mean ± S.E.M.).

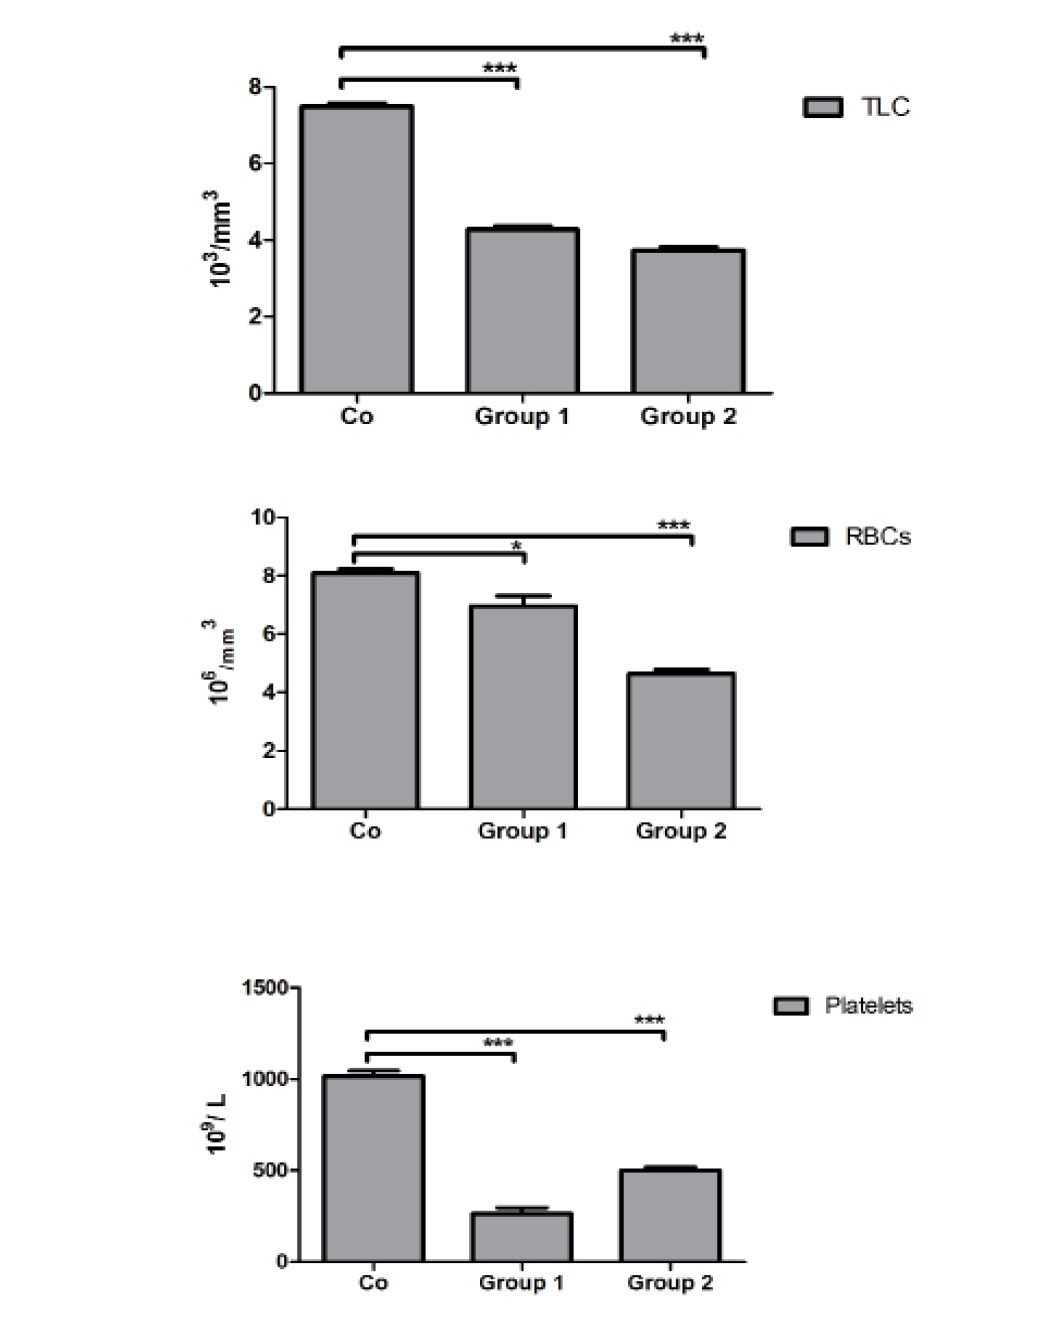
Level of WBCs, RBCs and Platelets in blood. WBCs, RBCs and Platelets all showed a significant negative change in the blood of both studied experimental groups as compared to the control group. The results are representative of three animal series (mean ± S.E.M.).
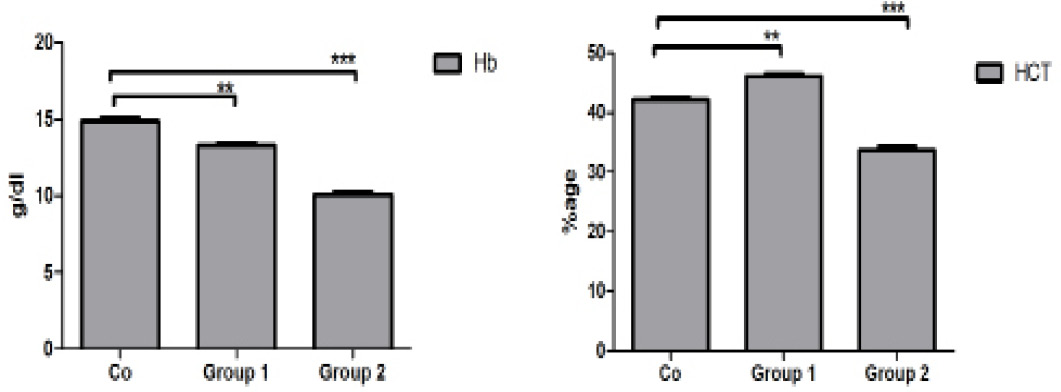
Level of Hb and HCT in blood. Hb level was found to be decreased significantly (P<0.0001) in both experimental groups as compared to the control group. Level of HCT (P<0.0001) was increased significantly in Group 1 against control while Group 2 showed opposite trend to Group 1. The results are representative of three animal series (mean ± S.E.M.).
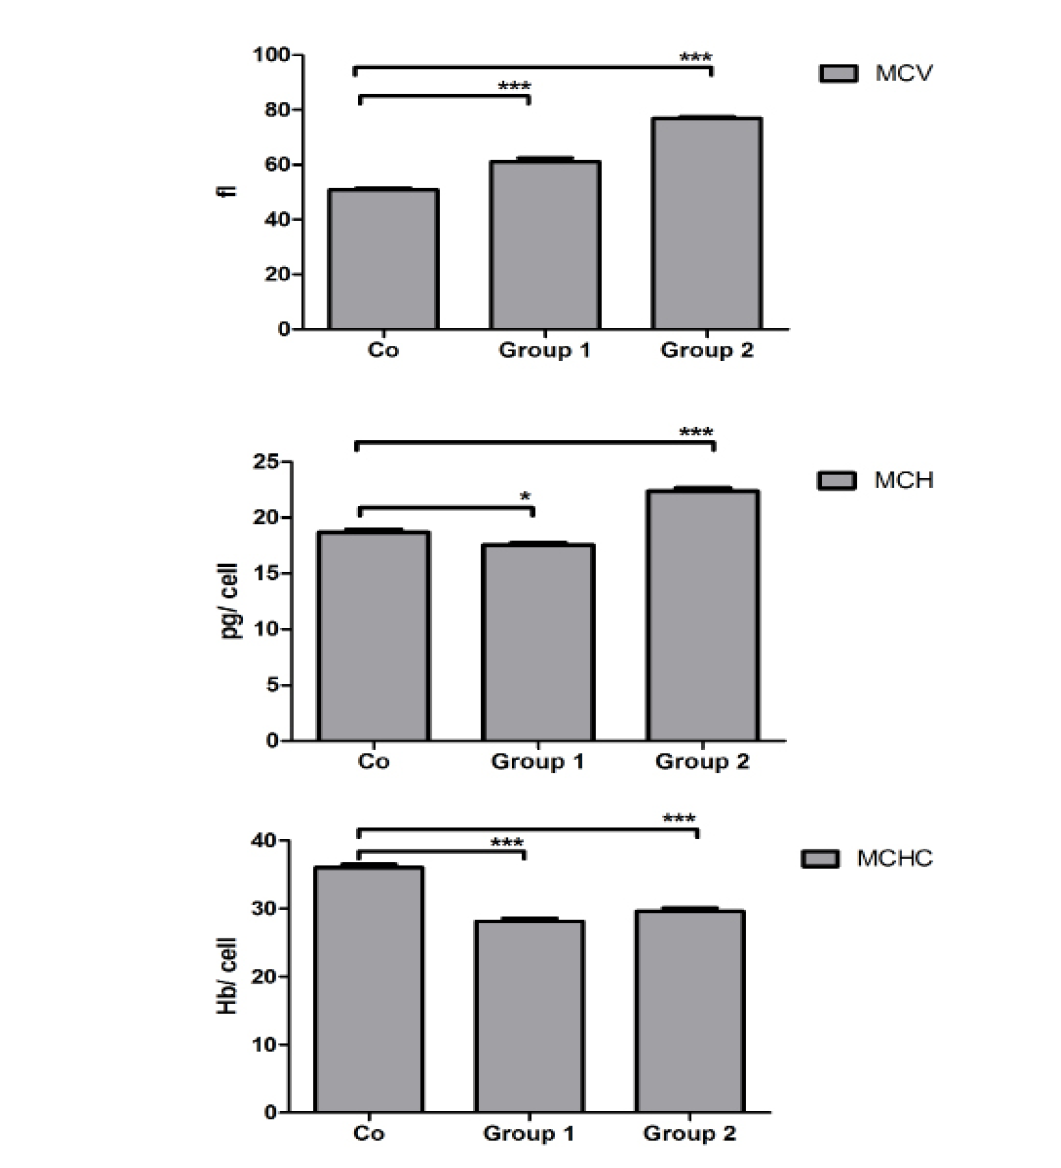
Level of MCV, MCH and MCHC in blood. MCV level was found to be increased significantly (P<0.0001) in both studied groups as compared to the control. Level of MCH (P<0.0001) was decreased significantly in Group 1 against control while Group 2 showed opposite trend to Group 1. Regarding MCHC (P<0.0001) both experimental groups showed a significant negative trend against control. The results are representative of three animal series (mean ± S.E.M.).
