

An Assessment of Overexploitation Risk Faced by Penaeus Shrimps in Pakistan by using SPMs: Management Perspectives and Economic Consequences


An Assessment of Overexploitation Risk Faced by Penaeus Shrimps in Pakistan by using SPMs: Management Perspectives and Economic Consequences
Muhammad Mohsin1, Yin Hengbin2*, Qian Chong3 and Bohyun Kim4
1Fisheries Management, College of International Finance and Trade, Zhejiang YueXiu University of Foreign Languages, Shaoxing, 312000, China.
2Marine Resource Management, School of Finance and Trade, Wenzhou Business College, Wenzhou, 325035, China.
3School of Economics, Fujian Normal University, Fuzhou, 350117, China
4Global Insurance and Pension Research Center, Sungkyunkwan University, Seoul, 03063, Korea
ABSTRACT
Most of the published scientific literature declares Pakistani marine fisheries a victim of open access phenomenon. Under the influence of this ongoing regime, it becomes necessary to estimate overexploitation risk and understand ongoing economic implications of particularly important fishery resources. Thus, this study is the first-time attempt to evaluate very important fishery resource, i.e., Penaeus shrimps of Pakistan by considering these aspects. A long catch and effort (CE) data series, 1971-2009, were used in this study. CE data was statistically analyzed by using non-equilibrium surplus production models (NE-SPMs), viz., Fox Model (FM), Schaefer Model (SM), and Pella-Tomlinson Model (PTM) through two specialized fishery software, viz., catch and effort data analysis (CEDA) and a stock production model incorporating covariates (ASPIC). In CEDA, FM showed highest value of R2 (0.897) and computed maximum sustainable yield (MSY) as 2471 t. On the other hand, in ASPIC, FM also produced highest R2 value (0.931) and estimated MSY as 2867 t. Obtained results indicate that fishing mortality (F) and biomass (B) showed increasing and declining trend from 2000 to 2009, in that order. Thus, results indicate overexploitation of Penaeus shrimps in Pakistan. By considering results, recommended MSY target reference point (TRP) for Penaeus shrimps is between 2600 t – 3000 t. Moreover, harvest below 2300 t and over 3200 t may be considered as limit reference point (LRP). To conserve Penaeus shrimps biologically and to keep their economic contribution continuously, it is suggested to conduct further in-depth studies in this regard.
Article Information
Received 17 July 2020
Revised 26 August 2020
Accepted 09 November 2020
Available online 16 July 2021
Authors’ Contribution
MM and YH initiated this project, performed statistical analysis and wrote the manuscript. QC gave suggestions and provided necessary materials for this study. BK constructed tables and figures and revised several parts of the manuscript.
Key words
Penaeus shrimps, Overexploitation risk, Management, CEDA, ASPIC, Pakistan
DOI: https://dx.doi.org/10.17582/journal.pjz/20200717050757
* Corresponding author: 20190251@wzbc.edu.cn
0030-9923/2021/0005-1803 $ 9.00/0
Copyright 2021 Zoological Society of Pakistan
INTRODUCTION
In Pakistan, significant quantity of caught fish biomass is comprised of shrimps. That’s why, they are landed on every coastal dock station (Mohsin et al., 2017). Pakistani marine waters are rich in shrimp biodiversity especially the delta of Indus River. Studies indicate that more than 30 shrimp species live in this region (Hayat, 2003). Commercially caught shrimps in Pakistan are usually sorted into three local types, viz., Kalri (pink-brown shrimp; metapenaeus shrimps), Kiddi (parapenaeopsis shrimps), and Jaira (white shrimp; Penaeus shrimps). These categories are based on the size of caught shrimps. With respect of their size, Metapenaeus, Parapenaeopsis, and Penaeus shrimps are medium, small-sized, and large shrimps in that order (Kazmi and Sultana, 2008). Penaeus shrimps belong to the family Penaeidae in which 48 genera are included worldwide (De Grave et al., 2009). Overall, 27 penaeid shrimps are reported from Pakistani marine waters (Tirmizi and Bashir, 1973). This family has great commercial and economic importance. Most of the commercially hunted shrimps belong to this family. In total, seven penaeid shrimps are collectively known as Jaira in Pakistan. These penaeus shrimps species include Penaeus indicus, P. merguiensis, P. penicillatus, P. pulchricaudatus, P. canaliculatus, P. monodon, and P. semisulcaltus. These Jaira shrimps are known as Saana, Bili Tiger, and Green Tiger in Sindhi language, whereas, in Balochi language they are called Patas, Madak, Kala Tiger, and Patapati depending upon the species. They are mostly fished through bottom trawls, cast nets, bag nets, beach seins, and gillnets (Kazmi, 2003; FAO, 2015).
Shrimps are expensive fishery products and preferred seafood as well. They usually fetch higher profits as compared to other seafood products in the market. Their popularity and demand is increasing in many countries such as Japan, USA, West Europe, etc. To meet with this demand and earn more profit, it is tried to commercially hunt more and more shrimps. This lust has resulted in uncontrolled fishing effort in the past which is evidenced by published literature (Memon et al., 2015). According to FAO, number of trawlers operating in Pakistan has significantly increased during the course of time from 1958 (3) to 1985 (1631) (FAO, 2011). Currently, the number of operational trawlers in Pakistan is around 2400. Although, fishing effort has increased but the catch statistics indicate that catch is declining. Some studies blame overexploitation for this happening (FAO, 2009). Many fishery resources of Pakistan are a victim of overexploitation due to continuing open access phenomena in Pakistan (Memon et al., 2015). Hardin (1968) described this regime for fisheries as “tragedy of the commons”. Such an uncontrolled and unmanaged exploitation of fishery resources is not only ruining aquatic environment but also resulting in economic losses. In order to get continued economic benefit form fishery resources their proper management is direly needed (Mohsin et al., 2017).
There are several statistical routines such as age-structured models, surplus production models (SPMs) etc. which are used to manage fishery resources. Fishery resources are frequently managed by employing SPMs. The reason for this preference is that these models are easy to execute and use simple data. These models rely on depletion concept of fish stock. This concept means that removal of fish stock is reflected through fall in its abundance (Hoggarth et al., 2006). These models estimate important fishery parameters upon which management advice can be given. On the other hand, data collection for age-structured models is problematic (Jensen, 2002). Moreover, recent SPMs estimate parameters by considering fish stock in a non-equilibrium state. That is why these models are known as non-equilibrium SPMs, i.e., NE-SPMs. This assumption makes these statistical routines more reliable as compared to older versions of SPMs, which assumed equilibrium state of fish stock (Hoggarth et al., 2006; Medley and Ninnes, 1997). By considering these advantages of NE-SPMs, we have employed these statistical routine for this study.
Several researchers have published numerous studies related to penaeid shrimps of Pakistan. For instance, Qureshi and Amanat (2014) described reproductive biology of P. merguiensis. Likewise, Korai et al. (2008) examined biodiversity of Keenjhar Lake with respect of their physicochemical qualities. In the same way, Sultana and Mustaquim (2006) studied features of juvenile population of penaeid shrimps. Therefore, most of the published literature undertakes research related to reproductive or ecological aspects of shrimps. No published study evaluates stock status of commercially important penaeid shrimps of Pakistan and strives to access its economic implications. Thus, this study is the first attempt to fill this gap.
MATERIALS AND METHODS
Data collection
This study employs a long data series, 1971-2009, representing catch statistics of Penaeus shrimps from Pakistani marine waters. This data was obtained from the published statistics by Marine Fisheries Department, Pakistan. NE-SPMs were used to statistically evaluate the data. It is necessary to mention that catch of Penaeus shrimps is reported in tons (t) and effort in number of trawlers in actual operation.
Data analysis
For statistical analysis of the data, three NE-SPMs were used, viz., Fox Model (FM), Schaefer Model (SM), and Pella-Tomlinson Model (PTM). Among these models, the most frequently employed model in fishery sciences is SM. SM model is based on the logistic fish population increase and can be expressed mathematically as follows:
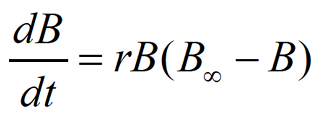 (
(Where, B, r, t, and B∞ represent biomass of fish stock, growth rate of fish stock, time, and carrying capacity of fish stock, respectively. On the other hand, FM is based on the growth formula suggested by Gompertz while PTM is based on generalized production. The mathematical expression of these two models is as follows:
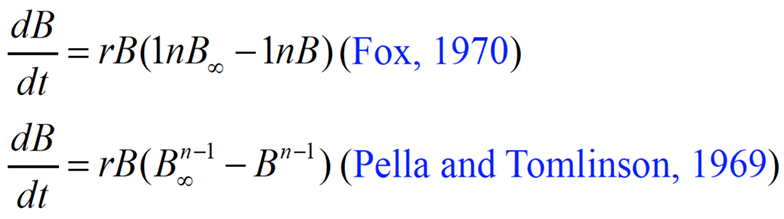
Where, n denotes shape parameter. NE-SPMs were employed through specialized fishery software, viz., CEDA (catch and data analysis) and ASPIC (a stock production model incorporating covariates) (Prager, 2005; Hoggarth et al., 2006). In CEDA, three error assumptions (EA), viz., normal error assumption (NEA), log-normal error assumption (LNEA) and, gamma error assumption (GEA) were used. Besides, in ASPIC, two models were employed, viz., FM and SM or sometimes also called as logistic model (LM). The main purpose of using many models was to ensure the dependability of results. Models used in this study were compared by using certain criteria. Such as, results with R2 values higher than 0.5 were considered only. Moreover, results having only suitable coefficient of variation (CV) value were accepted. In addition to this, obtained CEDA graphs for different models were compared to find the best fit model.
CEDA (version 3.0.1)
This software is a computer based statistical routine frequently employed in fishery sciences to compute important parameters. The special method used in this program is known as bootstrapping method. During these method fishery parameters are estimated by using 95% confidence interval. The first step in parameter estimation is the computation of initial proportion (IP). IP was obtained by dividing the initial catch with the highest catch. For this study, calculated IP value was 1 because the initial catch is also the highest catch. Afterwards, other supposed IP values, 0.6-0.9, are also used to comprehensively understand the fishery dynamics of Penaeus shrimps in Pakistani marine waters. The use of different IP values for estimating fishery stock is generally referred to as sensitivity analysis. The reason why different IP values are used in this study is that IP values indicate the state of the fishery. For virgin fishery population IP is considered to be 0, whereas, for fully exploited fishery populations IP value is 1. Since, calculated IP is 1, therefore, we employed other IP values from 0.6-0.9. Because, in this condition there is no chance of fishery to start for virgin state. Key fishery parameters computed by CEDA are maximum sustainable yield (MSY), catchability coefficient (q), carrying capacity (K), growth rate (r), current biomass (B), and goodness of fit (R2).
ASPIC (Version 5.0)
ASPIC software computes important fishery parameters. That’s why this routine is frequently used in fishery management studies. ASPIC also requires IP values for the estimation of parameters. Technically speaking, this software runs two different types of files, viz., FIT and BOT. FIT and BOT actually represent different program modes of ASPIC. During FIT mode, ASPIC estimates management parameters, whereas, during BOT mode bootstrapping method by using confidence interval is used. BOT file takes more time to compute fishery parameters as compared to FIT file. It is important to mention that 250 trials were set for the computation of parameters. Alike CEDA, in order to compute MSY with ASPIC separate files for each IP value, i.e., 0.6-1 was prepared. Fishery parameters estimated by using ASPIC routine are MSY, q, K, R2, fishing mortality at MSY (FMSY), fishing mortality (F), biomass at MSY (BMSY), ratio of fishing mortality to fishing mortality at MSY (F/FMSY) and ratio of biomass to biomass at MSY (B/BMSY).
RESULTS
Study results are presented in this section. Analysis of catch statistics reveal that overall catch of Penaeus shrimps from Pakistani marine waters has considerably decreased from 1971 (10000 t) to 2009 (3425 t). However, this decrease showed many fluctuations. Sudden decrease in catch can be observed between the years 1987 (9718 t) and 1989 (3472 t). In contrast to catch, effort has increased almost consistently during the study period, i.e., from 1971 (668) to 2009 (3044) (Fig. 1). CPUE has shown decreasing trend. In 1971, estimated CPUE is 14.97 which decreased significantly and reached at 1.25 during 2009 (Fig. 2). Figure 3 graphically demonstrates residual plots obtained for all the three NE-SPMs by using IP 1 during CEDA analysis. These graphs compare reported and expected catch statistics. These graphs visually look similar but in fact they are different from each other in details.
CEDA estimates
CEDA estimates for various parameters by using IP 1 for all the three NE-SPMs are presented in Table I. FM estimated MSY by using NEA and LNEA as 2471 t and 2776 t, correspondingly. The computed values of R2, CV, and B by using NEA remained 0.897, 0.163, and 15632 t. Whereas, the values of these parameters estimated by using LNEA remained 0.860, 0.113, and 13880 t, in that order. For GEA, FM did not produced results rather it showed minimization failure (MF). MF represents that condition in which software does not compute parameter values.
Table I. Various parameters computed by using CEDA for Penaeus shrimps in Pakistani marine waters (IP = 1).
|
Model |
K |
q |
r |
MSY |
CV |
R2 |
B |
|
FM (NEA) |
43106 |
6.80E-05 |
0.155 |
2471 |
0.163 |
0.897 |
15632 |
|
FM ( LNEA) |
38469 |
7.87E-05 |
0.196 |
2776 |
0.113 |
0.860 |
13880 |
|
FM (GEA) |
MF |
||||||
|
SM (NEA) |
40694 |
7.23E-05 |
0.238 |
2424 |
0.180 |
0.889 |
14378 |
|
SM ( LNEA) |
35443 |
8.59E-05 |
0.314 |
2782 |
0.181 |
0.849 |
12404 |
|
SM (GEA) |
MF |
||||||
|
PTM (NEA) |
40694 |
7.23E-05 |
0.238 |
2424 |
0.201 |
0.889 |
14378 |
|
PTM (LNEA) |
35443 |
8.59E-05 |
0.314 |
2782 |
0.178 |
0.849 |
12404 |
|
PTM (GEA) |
MF |
MF, Minimization failure; K, carrying capacity; q, Catchability coefficient; r, intrinsic population growth rate; MSY, Maximum sustainable yield; CV, coefficient of variation; R2, coefficient of determination; B, current biomass.
Table II. Estimated MSY values for Penaeus Shrimps in Pakistani marine waters by using CEDA (IP = 0.6-1).
|
IP |
|
|
|
|
Model |
|
|
|
|
|
|
FM |
SM |
PTM |
||||||||
|
NEA |
LNEA |
GEA |
NEA |
LNEA |
GEA |
NEA |
LNEA |
GEA |
||
|
0.6 |
3008 |
3316 |
3183 |
4057 |
4579 |
4345 |
4057 |
4579 |
4345 |
|
|
0.112 |
0.090 |
0.112 |
0.100 |
0.030 |
0.077 |
0.106 |
0.026 |
0.083 |
||
|
0.7 |
2804 |
3102 |
MF |
3446 |
3609 |
3700 |
3446 |
3609 |
3700 |
|
|
0.132 |
0.102 |
0.137 |
0.109 |
0.118 |
0.124 |
0.105 |
0.131 |
|||
|
0.8 |
2657 |
2977 |
2833 |
3010 |
3317 |
3247 |
3010 |
3317 |
3247 |
|
|
0.142 |
0.104 |
0.116 |
0.159 |
0.134 |
0.141 |
0.150 |
0.133 |
0.142 |
||
|
0.9 |
2550 |
2854 |
2730 |
2682 |
3057 |
MF |
2682 |
3057 |
MF |
|
|
|
0.164 |
0.118 |
0.125 |
0.165 |
0.166 |
0.156 |
0.159 |
|||
|
1 |
2471 |
2776 |
MF |
2424 |
2782 |
MF |
2424 |
2782 |
MF |
|
|
0.163 |
0.113 |
0.180 |
0.181 |
0.201 |
0.178 |
|||||
CV, coefficient of variation (written below MSY values); MF, it represents minimization failure.
This happens because data pattern does not fit to some assumptions. SM and PTM showed same MSY estimates for NEA and LNEA, i.e., 2424 t and 2782 t, respectively. For NEA, estimates of R2 and B also remained same by using these error assumptions through these two models, i.e., 0.889 and 14378 t, correspondingly. However, estimated CV values varied for each of error assumptions used in SM and PTM. For SM, calculated CV values remained 0.180 (NEA) and 0.181 (LNEA), respectively. On the other hand, for PTM, computed CV values remained 0.201 (NEA) and 0.178 (LNEA), correspondingly. GEA showed MF in both the models, i.e., SM and PTM. Table II presents CEDA estimates of IP values 0.6-1. Obtained results indicate that for lower IP values higher MSY was estimated and vice versa. For example, for IP 0.6, estimated MSY remained 3008 t by using NEA, whereas, for IP 1, computed MSY value was 2471 t by using NEA in FM.
Dots represent observed catch (t) whereas straight line indicates expected catch (t).
ASPIC estimates
Table III presents calculated ASPIC parameters for IP 1. The two models, viz., FM and LM used in ASPIC estimated MSY as 2867 t and 3030 t, correspondingly. Other parameters such as R2, CV, and K for FM were calculated as 0.931, 0.107, and 34850 t in that order. On the other hand, LM estimated same parameters as 0.926, 0.115, and 29720 t, correspondingly. Estimated values of FMSY and BMSY by FM and LM as 0.223, 12820 t and 0.203, 14860 t, respectively. Fishery parameters computed for IP from 0.6 to 1 are listed in Table IV. There is a general trend of computed parameters. For instance, lower IP produced higher MSY estimates and vice versa in FM. Other parameters such as K, q, FMSY, and FMSY followed the same parameter estimates. For LM parameter estimates of MSY, K, q, FMSY, and FMSY showed the same pattern of estimates like FM. ASPIC estimates of F and B by using IP 1 are listed in Table V. For FM, results indicate that F has noticeably increased from 2000 (0.216) to 2009 (0.268). Besides, B has declined from 2000 (34850 t) to 2009 (13090 t). Same parameter estimate trends, i.e., increase in F and decrease in B are observed for LM. Obtained results obviously indicate that fishery stock of Penaeus shrimps is decreasing quickly as a result of overexploitation.
Table III. Various parameters estimated by using ASPIC for Penaeus shrimps in Pakistani marine waters (IP = 1).
|
Model |
IP |
MSY |
K |
q |
FMSY |
BMSY |
R2 |
CV |
|
FM |
1 |
2867 |
34850 |
8.754E-05 |
0.223 |
12820 |
0.931 |
0.107 |
|
LM |
1 |
3030 |
29720 |
1.039E-04 |
0.203 |
14860 |
0.926 |
0.115 |
Table IV. ASPIC results for Penaeus shrimps by using ASPIC in Pakistani marine waters (IP = 0.5-1).
|
Model |
IP |
MSY |
K |
q |
FMSY |
BMSY |
R2 |
CV |
|
FM |
0.6 |
3370 |
36490 |
1.394E-04 |
0.251 |
13430 |
0.929 |
0.078 |
|
0.7 |
3172 |
35560 |
1.227E-04 |
0.242 |
13080 |
0.930 |
0.087 |
|
|
0.8 |
3029 |
35080 |
1.087E-04 |
0.234 |
12910 |
0.930 |
0.065 |
|
|
0.9 |
2932 |
34850 |
9.726E-05 |
0.228 |
12820 |
0.930 |
0.093 |
|
|
1 |
2867 |
34850 |
8.754E-05 |
0.223 |
12820 |
0.931 |
0.107 |
|
|
LM |
0.6 |
4868 |
16650 |
3.233E-04 |
0.584 |
8323 |
0.918 |
0.045 |
|
0.7 |
4156 |
21290 |
2.123E-04 |
0.390 |
10640 |
0.920 |
0.089 |
|
|
0.8 |
3650 |
24900 |
1.564E-04 |
0.293 |
12450 |
0.923 |
0.083 |
|
|
|
0.9 |
3297 |
27520 |
1.250E-04 |
0.239 |
13760 |
0.925 |
0.118 |
|
1 |
3030 |
29720 |
1.039E-04 |
0.203 |
14860 |
0.926 |
0.115 |
Table V. ASPIC estimates of fishing mortality (F) and biomass (B) (IP = 1).
|
Year |
Model |
|||||||
|
FM |
LM |
|||||||
|
F |
B |
F/FMSY |
B/BMSY |
F |
B |
F/FMSY |
B/BMSY |
|
|
2000 |
0.216 |
34850 |
0.966 |
2.718 |
0.257 |
29710 |
1.258 |
2.000 |
|
2001 |
0.227 |
28690 |
1.014 |
2.238 |
0.271 |
24000 |
1.331 |
1.615 |
|
2002 |
0.247 |
24340 |
1.106 |
1.898 |
0.296 |
20330 |
1.449 |
1.369 |
|
2003 |
0.270 |
20950 |
1.209 |
1.634 |
0.322 |
17560 |
1.580 |
1.182 |
|
2004 |
0.258 |
18200 |
1.154 |
1.420 |
0.307 |
15290 |
1.505 |
1.029 |
|
2005 |
0.210 |
16450 |
0.938 |
1.283 |
0.248 |
13850 |
1.216 |
0.932 |
|
2006 |
0.241 |
15840 |
1.077 |
1.235 |
0.282 |
13480 |
1.385 |
0.907 |
|
2007 |
0.247 |
14950 |
1.105 |
1.166 |
0.289 |
12760 |
1.419 |
0.859 |
|
2008 |
0.291 |
14200 |
1.302 |
1.107 |
0.343 |
12110 |
1.683 |
0.815 |
|
2009 |
0.268 |
13090 |
1.196 |
1.021 |
0.320 |
11030 |
1.569 |
0.742 |
DISCUSSION
Several indicators such as CPUE, MSY etc. can be used to predict status of fishery. Among these indicators, CPUE is the simplest and the straightway to forecast fishery status. Different CPUE trends represent different states of fishery. For instance, when CPUE remains stable, it indicates that fishing operations are not affecting fish population. Conversely, if CPUE is increasing or decreasing, it may reflect some quantitative variations in the fish stock. Moreover, when CPUE is decreasing and effort is increasing, it may indicate overexploitation (Hoggarth et al., 2006). This study finds that CPUE of Penaeus shrimps has considerably decreased from 1971 (14.97) to 2009 (1.25) which indicates overexploitation. In addition to CPUE, MSY estimates also speaks about the fate of the fishery. The concept of MSY was introduced in 1992. MSY is the commonly used indictor to manage fisheries all over the world (Hoggarth et al., 2006). However, MSY does not permit fixed catch quantity rather it only serves as an alarm to overfishing. Therefore, MSY should be estimated with great care. If MSY is underestimated, in this condition economic loss will happen due to the less catch of fish. On the other hand, if MSY is overestimated, in this condition fisheries stock will be overexploited (Rosenberg et al., 1993). MSY estimates represent the status of fisheries stock. If MSY estimates are almost equal to current catch in this condition fishing can be continued with current effort. However, if MSY estimates are lower than recent catch statistics it means that fishery resource is experiencing overexploitation. On the contrary, if MSY estimates are higher than reported current catch this indicates that there is a potential to increase fish catch (Hoggarth et al., 2006). Obtained results reveal that current catch of Jaira Shrimp from Pakistani marine water is higher than calculated MSY which means that this fishery resource is experiencing overexploitation.
The process of fisheries management involves many stages from data collection to rational decision making (FAO, 1997). Practically fisheries management is done through some scientifically estimated points known as reference points. These reference points guide and form the basis of fisheries management (Hoggarth et al., 2006). They started to appear in fisheries management literature in 1992 (FAO, 1995). Two types of reference points are usually recognized, i.e., target reference point (TRP) and limit reference point (LRP). TRP and LRP differ from each other in this sense that TRP are targeted whereas LRP are avoided for fisheries management. Reference points are actually represent scientifically estimated values on which fishery managers make management policies (Caddy and Mahon, 1995; Cochrane, 2002).
A plethora of published literature uses the same statistical routines used in this study (Memon et al., 2015). The models, i.e., NE-SPMs employed through these routines are based on some assumptions. For instance, they assume that there is neither intra or inter fish species competition. Likewise, r is independent of fish age composition. The sample catch statistics belong to single fish stock. Natural and artificial fish mortality occur simultaneously. Catch statistics are true and vessels efficiency remain same (Ewald and Wang, 2010). Thus, these models are very popular in fisheries management studies because they have numerous advantages over the other methods. For instance, simple catch statistics can be employed by these models. These models have tendency to use unified biomass and compute diverse parameters such as recruitment, growth and mortality. Moreover, these models estimate catchability coefficient which shows fish stock. Important fishery parameters estimated through these models include BMSY, Bcurrent, FMSY, and Fcurrent (Ewald and Wang, 2010). Nevertheless, it does not mean that these models are error free rather these models also confer some disadvantages. Such as, these model don’t use ag-structure data. Furthermore, these models don’t employ time delay mechanism in between reproduction and recruitment. Therefore, these models are accompanied by uncertainty (Ewald and Wang, 2010). However, regardless of these ambiguities these models are available famous fishery tools to access initial stock for scientific management (Musick and Bonfil, 2005).
Usually more than one production model is applied to catch and effort data. This is done to increase the reliability of the results. In some cases, the output values of some parameters even with different models may be same as our conducted study indicates. This may happen due to the un-testable assumptions of the models. When the best fitting model is found, various parameter reference points can be extracted for giving advice on management (Hoggarth et al., 2006).
This study finds that Panaeus shrimps are overexploited in Pakistan. This overexploitation has diverse types of bad consequences in terms of biological, social and economic aspects. Economic effects of overexploitation were first studies by Clark (1973). He stated that overexploitation results in social chaos through fishery resource exploitation competition and profit maximization phenomenon. The urge to catch maximum quantity of fish may result in the extinction of this resource (Clark, 1973). Published literature advocates that greater economic gains can be achieved through the rebuilding of overexploited fishery stock. When fishery starts somewhere, with low effort more catch is obtained. However, if effort continue to increase a stage is reached at which catch starts to decline and profits become negative (Grafton et al., 2007). In other words, fishery resource decline is an outcome of an attempt to increase economic gain (Clark, 1973). If some fishery resource is found to be overexploited, rebuilding this resource is the best idea. However, most of the time this idea is opposed by the fishermen. Their conflict with this plan is usually primarily based on the transition costs and recovery time. In contrast to fast growing fishes, slow growing fishes would take long time to rebuild stock. In such cases, fishermen can be given some suitable invectives such as impermanent employment or harvesting rights etc. to attract them towards rebuilding (Grafton et al., 2007). In this was fishermen can feel satisfied with the idea of fishery stock rebuilding (Grafton, 1995).
This study finds overexploitation of Penaeus shrimps in Pakistan. However, national fisheries policy of Pakistan emphasizes to control overexploitation of fisheries resources through its strategy axis 2A.2. Despite having this policy to control overexploitation, scientific studies declare rise in fishing effort and witness overharvesting of fishery resources (Schmidt, 2014; Memon et al., 2015). Pakistan is a follower of FAO’s Code of Conduct for Responsible Fisheries. According to article 2. A section of this code, Pakistan must effectively control the issues of overexploitation (FAO, 1995). Since, many public and private organizations are striving to control overexploitation, however, to effectively control overexploitation increased inter departmental coordination is very important. Fishery managers should also play their role in this regard by observing illegal fishing particularly through small size mesh gears used during close seasons. Moreover, policy revision with its proper implementation is direly needed. It is also suggested to investigate stock status of other important fishery resources as well.
CONCLUSIONS
CPUE has considerably decreased from 1971 (14.97) to 2009 (1.25). Estimated MSY values are significantly lower than reported catch statistics. Although, MSY estimation range, 2400 t–2800 t, of CEDA overlaps ASPIC range, 2800 t–3100 t, but former software remained conservation in MSY estimation. Obtained results indicate that F and B showed increasing and declining trend from 2000 to 2009, in that order. Thus, results indicate overexploitation of Penaeus shrimps in Pakistan. By considering results, recommended MSY target reference point (TRP) for Penaeus shrimps is between 2600 t–3000 t. Moreover, harvest below 2300 t and over 3200 t may be considered as limit reference point (LRP). To conserve Penaeus shrimps biologically and to keep their economic contribution continuously, it is suggested to conduct further in-depth studies in this regard.
Conflict of interest statement
The authors have declared no conflict of interest.
REFERENCE S
Caddy, J.F. and Mahon, R., 1995. Reference points for fisheries management. FAO fisheries technical paper No. 347, FAO’s fisheries department, Rome, Italy. pp. 1-83.
Clark, C.W., 1973. The economics of overexploitation. Science, 181: 630-634. https://doi.org/10.1126/science.181.4100.630
Cochrane, K.L., 2002. The use of scientific information in the design of management strategies, Chapter 5. In: A fishery manager’s guidebook: Management measures and their application (ed. K.L. Cochrane). FAO Fisheries Technical Paper No. 424, FAO’s fisheries department, Rome, Italy, pp. 1-231.
De Grave, S., Pentcheff, N.D., Ahyong, S.T., Chan, T.Y., Crandall, K.A., Dworschak, P.C., Felder, D.L., Feldmann, R.M., Fransen, C.H.J.M., Goulding, L.Y.D., Lemaitre, R., Low, M.E.Y., Martin, J.W., Ng, P.K.L., Schweitzer, C.E., Tan, S.H., Tshudy, D. and Wetzer, R., 2009. A classification of living and fossil genera of decapod crustaceans. Raffles Bull. Zool., 21: 1-109. http://hdl.handle.net/10088/8358
Ewald, C.O. and Wang, W.K., 2010. Sustainable yields in fisheries: Uncertainty, risk-aversion, and mean variance analysis. Nat. Resour. Model, 23: 303-323. https://doi.org/10.1111/j.1939-7445.2010.00065.x
FAO, 1995. Code of conduct for responsible fisheries. FAO’s fisheries department, Rome, Italy. pp. 1-41.
FAO, 1997. Fisheries management. FAO technical guidelines for responsible fisheries No. 4, FAO’s Fisheries Department, Rome, Italy. pp. 1-82.
FAO, 2009. Fishery and aquaculture country profile. FAO’s fisheries department, Rome, Italy. pp. 1-18.
FAO, 2011. Fisheries and shared resources of Pakistan. FAO’s fisheries department, Rome, Italy. pp. 1-58.
FAO, 2015. Field identification guide to the living marine resources of Pakistan. FAO’s fisheries department, Rome, Italy. pp. 1-386.
Fox, Jr. W.W., 1970. An exponential surplus-yield model for optimizing exploited fish populations. Trans. Am. Fish. Soc., 99: 80-88. https://doi.org/10.1577/1548-8659(1970)99<80:AESMFO>2.0.CO;2
Grafton, R.Q., 1995. Rent capture in a rights-based fishery. J. Environ. Econ. Manage., 28: 48-67. https://doi.org/10.1006/jeem.1995.1004
Grafton, R.Q., Kompas, T. and Hilborn, R.W., 2007. Economics of overexploitation revisited. Science, 318: 1601. https://doi.org/10.1126/science.1146017
Hardin, G., 1968. The tragedy of the commons. Science, 162: 1243-1248. https://doi.org/10.1126/science.162.3859.1243
Hayat, M., 2003. Fishing capacity and fisheries in Pakistan. FAO’s fisheries department, Rome, Italy. Available at: http://www.fao.org/docrep/006/Y4849E/y4849e0a.htm#fn81 (accessed 3 September 2018).
Hoggarth, D.D., Abeyasekera, S., Arthur, R.I., Beddington, J.R., Burn, R.W., Halls, A.S., Kirkwood, G.P., McAllister, M., Medley, P., Mees, C.C., Parkes, G.B., Pilling, G.M., Wakeford, R.C. and Welcomme R.L., 2006. Stock assessment for fishery management. A framework guide to the stock assessment tools of the fisheries management science programme. FAO Fisheries Technical Paper No. 487, FAO’s fisheries department, Rome, Italy, pp. 1-261.
Jensen, A.L., 2002. Maximum harvest of a fish population that has the smallest impact on population biomass. Fish. Res., 57: 89-91. https://doi.org/10.1016/S0165-7836(01)00337-X
Kazmi, Q.B. and Sultana, R., 2008. Economics of shrimps and prawns of Pakistan. In: Proceedings of fifth world fisheries congress, Japan. Available at: https://www.academia.edu/3184023/Economics_of_Shrimps_and_Prawns_of_Pakistan (accessed 5 November 2018).
Kazmi, Q.B., 2003. Marine fauna Pakistan. Ser. 1. Shrimps. pp. 66.
Korai, A.L., Sahato, G.A., Lashari, K.H. and Arbani, S.N., 2008. Biodiversity in relation to physicochemical properties of Keenjhar lake, Thatta district, Sindh, Pakistan. Turk. J. Fish. aquat. Sci., 8: 259-268.
Medley, P.A. and Ninnes, C.H., 1997. A recruitment index and population model for spiny lobster (Panulirus argus) using catch and effort data. Can. J. Fish. aquat. Sci., 54: 1414-1421. https://doi.org/10.1139/f97-027
Memon, A.M., Memon, K.H., Baloch, W.A., Memon, A. and Baset, A., 2015. Evaluation of the fishery status for King Soldier Bream Argyrops spinifer in Pakistan using the software CEDA and ASPIC. Chin. J. Oceanol. Limnol., 33: 966-973. https://doi.org/10.1007/s00343-015-4330-4
Mohsin, M., Mu, Y., Memon, A.M., Kalhoro, M.T. and Shah, S.B.H., 2017. Fishery stock assessment of Kiddi shrimp (Parapenaeopsis stylifera) in the Northern Arabian sea coast of Pakistan by using surplus production models. Chin. J. Oceanol. Limnol., 35: 936-946. https://doi.org/10.1007/s00343-017-6096-3
Musick, J.A. and Bonfil, R., 2005. Management techniques for elasmobranch fisheries. FAO Fisheries Technical Paper No. 474, FAO’s Fisheries Department, Rome, Italy, pp. 1-251.
Pella, J.J. and Tomlinson, P.K., 1969. A generalized stock production model. Inter-Am. Trop. Tuna Comm. Bull., 13: 416-497.
Prager, M.H., 2005. A stock-production model incorporating covariates (Version 5) and auxiliary programs. CCFHR (NOAA) Miami Laboratory Document MIA-92/93-55, Beaufort Laboratory Document BL-2004-01.
Qureshi, N.A. and Amanat, Z., 2014. Reproductive biology and size at sexual maturity of Penaeus merguiensis (De Man, 1887) form the Sonmiani bay lagoon, Balochistan, Pakistan. J. Anim. Pl. Sci., 24: 503-511.
Rosenberg, A.A., Fogarty, M.J., Sissenwine, M.P., Beddington, J.R. and Shepherd, J.G., 1993. Achieving sustainable use of renewable resources. Science, 262: 828-828. https://doi.org/10.1126/science.262.5135.828
Schaefer, M.B., 1954. Some aspects of the dynamics of populations important to the management of the commercial marine fisheries. Inter-Am. Trop. Tuna Comm. Bull., 1: 23-56.
Schmidt, U.W., 2014. Fisheries policy report and recommendations for Sindh. USFIRMS Project, USAID. Available at: http://pdf.usaid.gov/pdf_docs/PA00K7T7.pdf [last accessed 01 October, 2016].
Sultana, R. and Mustaquim, J., 2006. Population structure of the juvenile penaeid shrimps occurring in the sandpit backwaters of Karachi coast, Pakistan. Pak. J. Sci. Ind. Res., 49: 106-115.
Tirmizi, N.M. and Bashir, Q., 1973. Shore and offshore penaeid prawns of Northern Arabian Sea. Department of Publications, University of Karachi, Karachi.
To share on other social networks, click on any share button. What are these?


