
Analysis of Genetic Variations in Soybean using Simple Sequence Repeat (SSR) Markers


Analysis of Genetic Variations in Soybean using Simple Sequence Repeat (SSR) Markers
Mashal Malik and Mudassar Nawaz Khan*
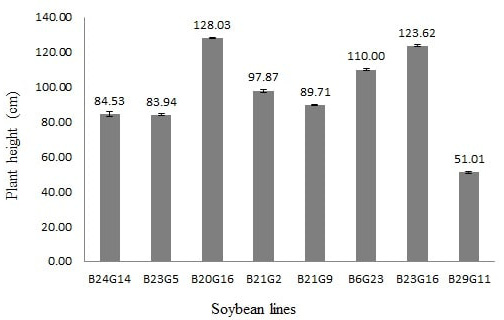
Figure 1:
Plant height variations in soybean lines grown for one-month.

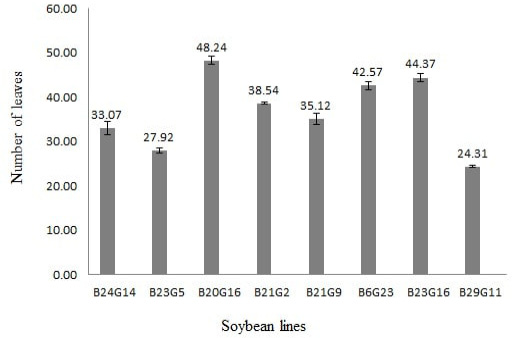
Figure 2:
Total number of leaves in soybean lines grown for one-month.
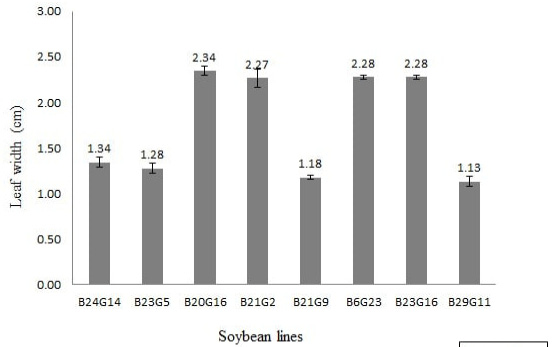
Figure 3:
Plant leaf width variations in soybean lines grown for one month.
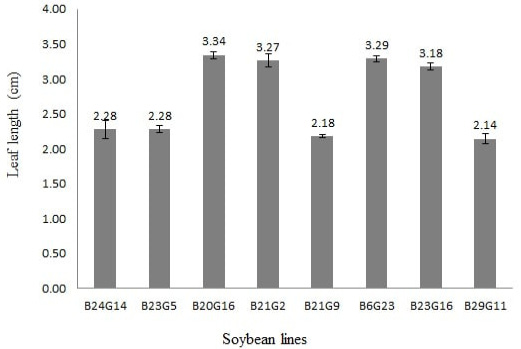
Figure 4:
Leaf length variations in soybean lines grown for one-month.

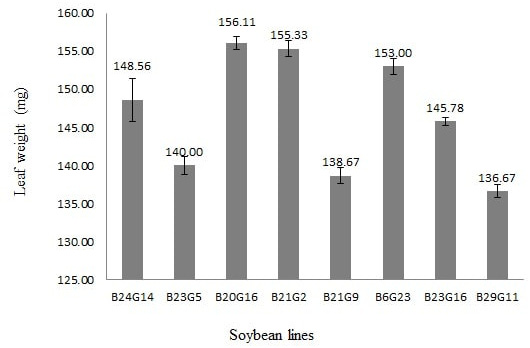
Figure 5:
Leaf weight variations in soybean lines grown for one month.
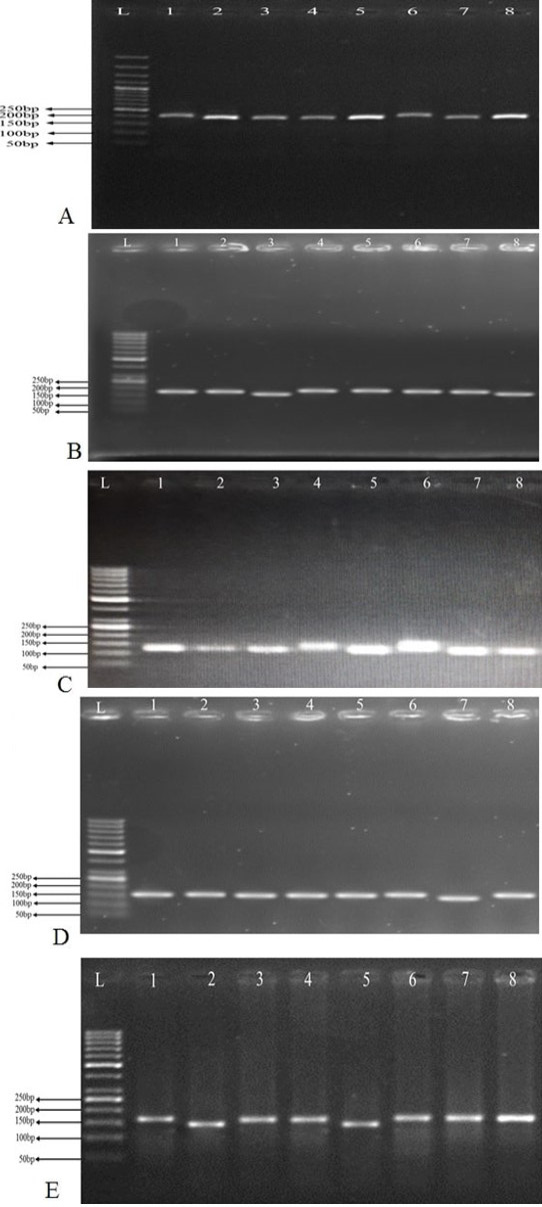
Figure 6:
PCR amplification of SSR markers in 8 soybean lines using primer Soy satt 001 (A), Soy satt 005 (B), Soy satt 148 (C), Soy satt 160 (D), Soy satt 171 (E). L represent ladder. Numbers above bands presents soybean lines.
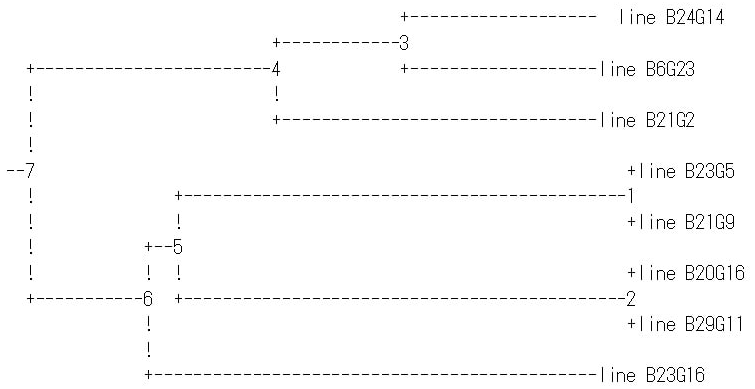
Figure 7:
Dendrogram of soybean lines showing genetic divergence.
June 2021
Vol. 37, Iss. 2, Pages 331-713

