

Analysis of the Correlation between Stress Granule Assembly and Nucleus/Cytoplasm Localization of hnRNP A1, HuR and TIA1 During Arsenite-Induced Oxidative Stress


Analysis of the Correlation between Stress Granule Assembly and Nucleus/Cytoplasm Localization of hnRNP A1, HuR and TIA1 During Arsenite-Induced Oxidative Stress
Xiaona Cao1,3-5, Yuanyuan Ren2-5, Xiaoteng Cui2-5, Baoxin Qian2-5, Chunyan Zhao 2-5, Jie Yang2-5, Chao Su2-5,* and Xingjie Gao2-5,*
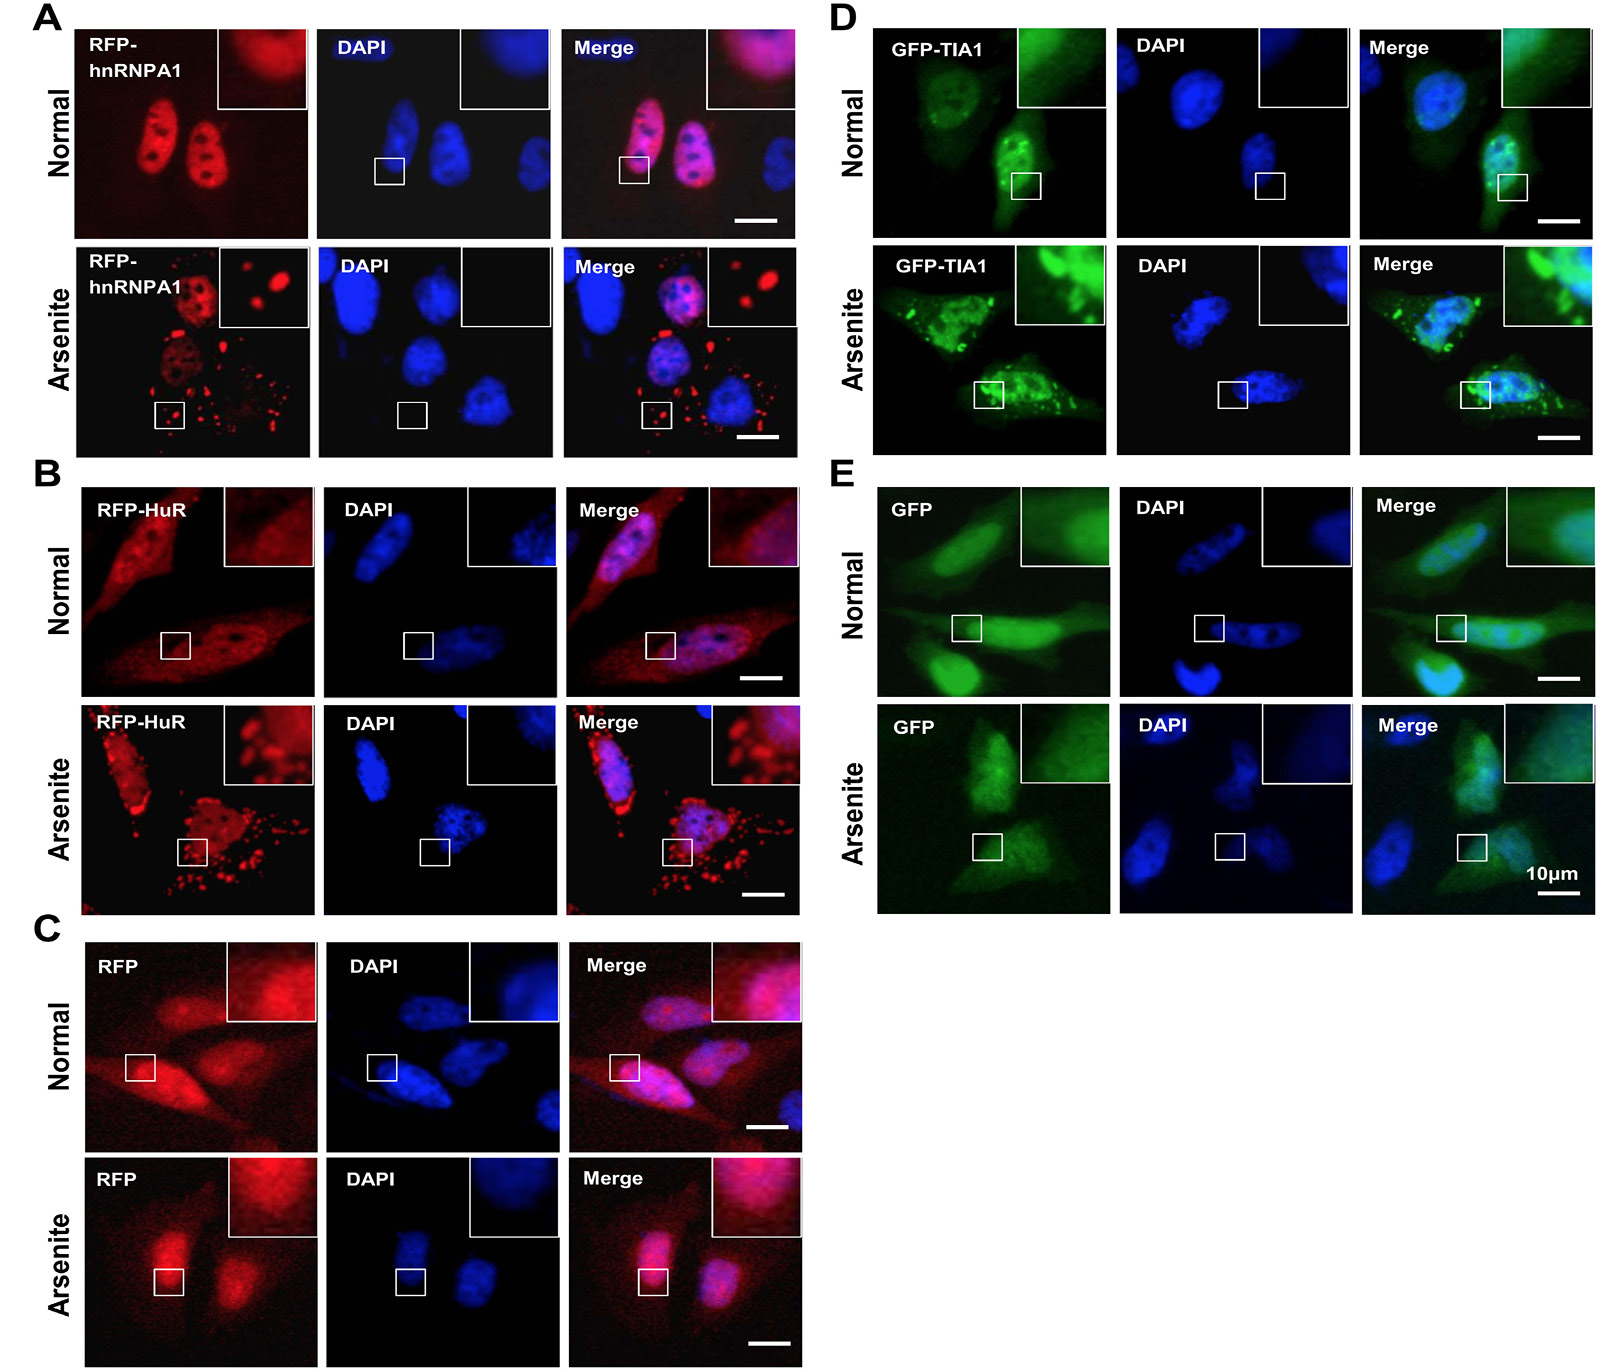
Image data for SG formation and nucleus/cytoplasm localization of hnRNP A1, HuR and TIA1 upon oxidative stress. HeLa cells were cultured and transiently transfected with plasmids of RFP-hnRNP A1 (A), RFP-HuR (B), RFP vector(C), GFP-TIA1 (D), and GFP vector (E), respectively, as indicated. After 24 hours, cells were untreated (Normal) or treated with 0.5 mM sodium arsenite for 1 hour (Arsenite). The nuclenus section was stained by DAPI. An inverted research microscope Leica was then used to collect the image data. Bar=10 μm.

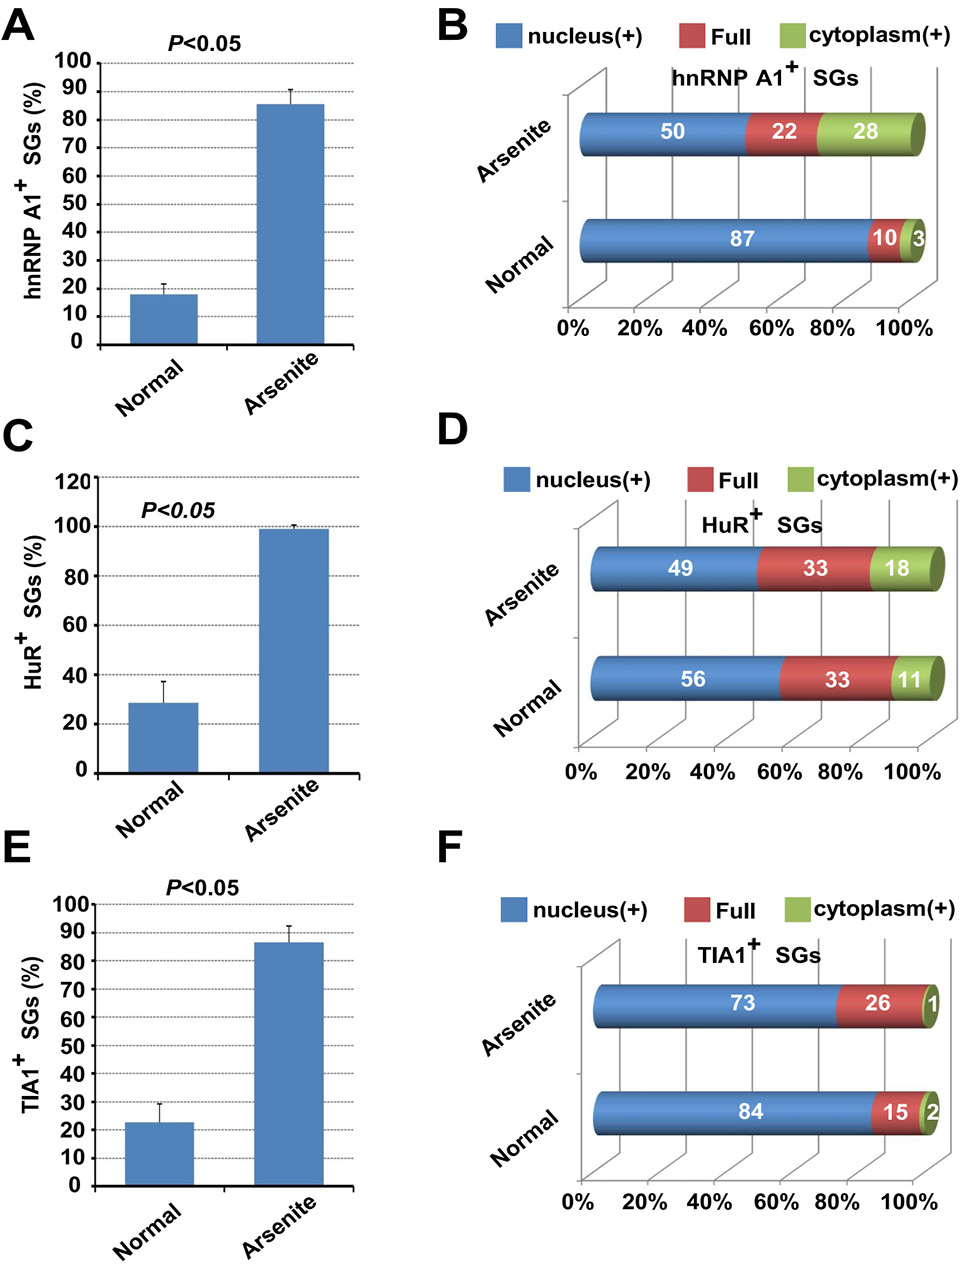
Quantification analysis for nucleus/cytoplasm localization of hnRNP A1, HuR and TIA1 upon oxidative stress. The percentage of hnRNP A1 (A), HuR (C), TIA1 (E) marked SG positive cells were measured, respectively. An independent-sample Student’s T Test was performed using SPSS 16.0. P<0.05 means significant difference. The ratio of cells with the nucleus-localized signal, cytoplasm-localized signal, or full cell-localized signal of hnRNP A1 (B), HuR (D), and TIA1 (F) in all selected cells was also calculated, respectivly.
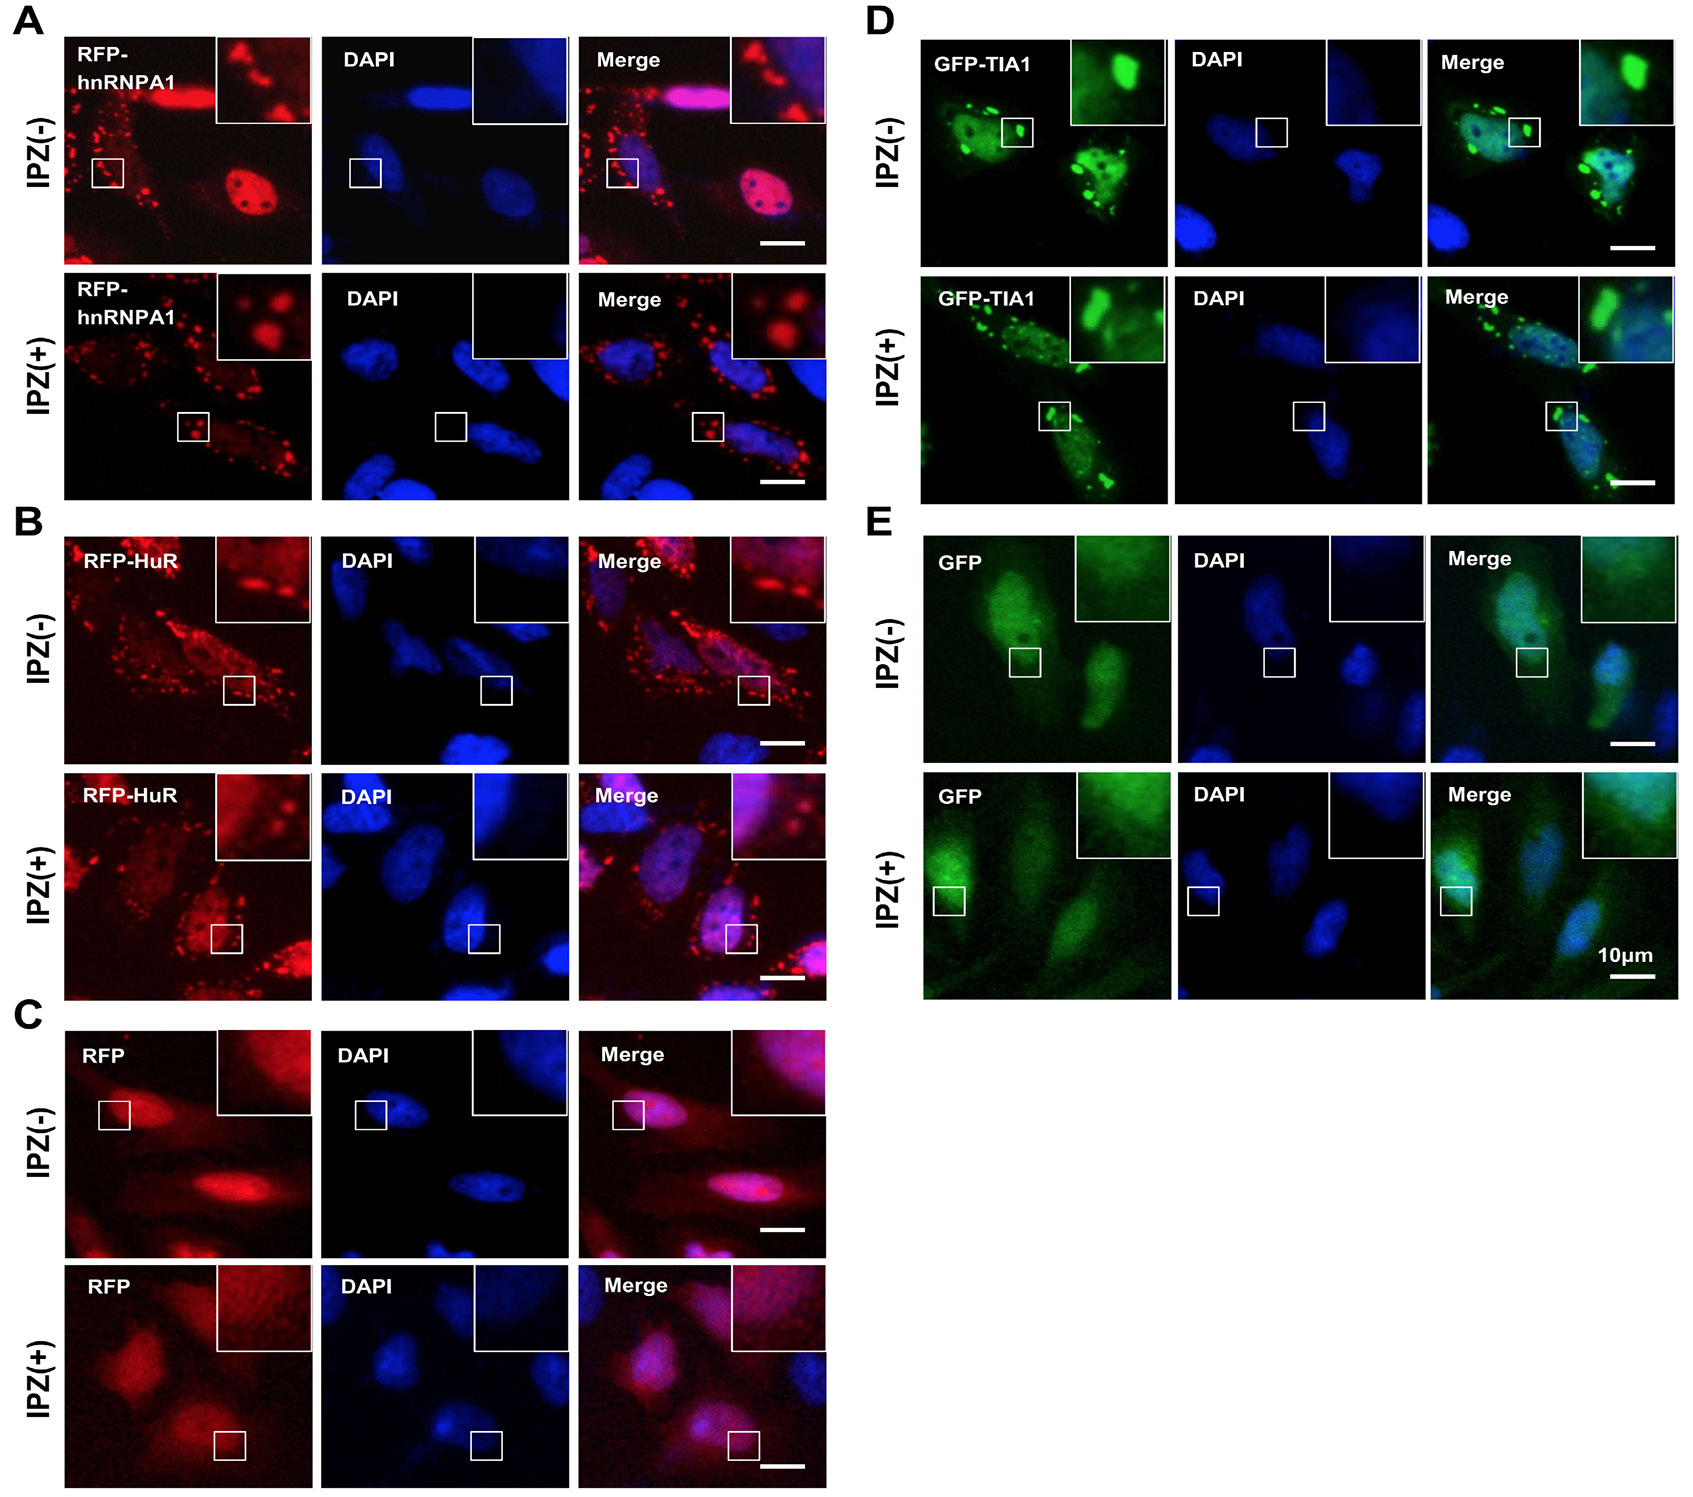
Image data for effect of IPZ on the nucleus/cytoplasm localization, SG formation of hnRNP A1, HuR and TIA1 during arsenite-induced oxidative stress. HeLa cells were cultured and transiently transfected with plasmids of RFP-hnRNP A1 (A), RFP-HuR (B), RFP (C), GFP-TIA1 (D), and GFP (E), respectively, as indicated. After the pretreated with 10 μM IPZ for 6 hours [IPZ (+)] or not [IPZ(-)], cells were treated with 0.5 mM sodium arsenite for 1 hour. The nuclenus section was stained by DAPI. An Inverted research microscope Leica was then used to collect the image data. Bar=10 μm.
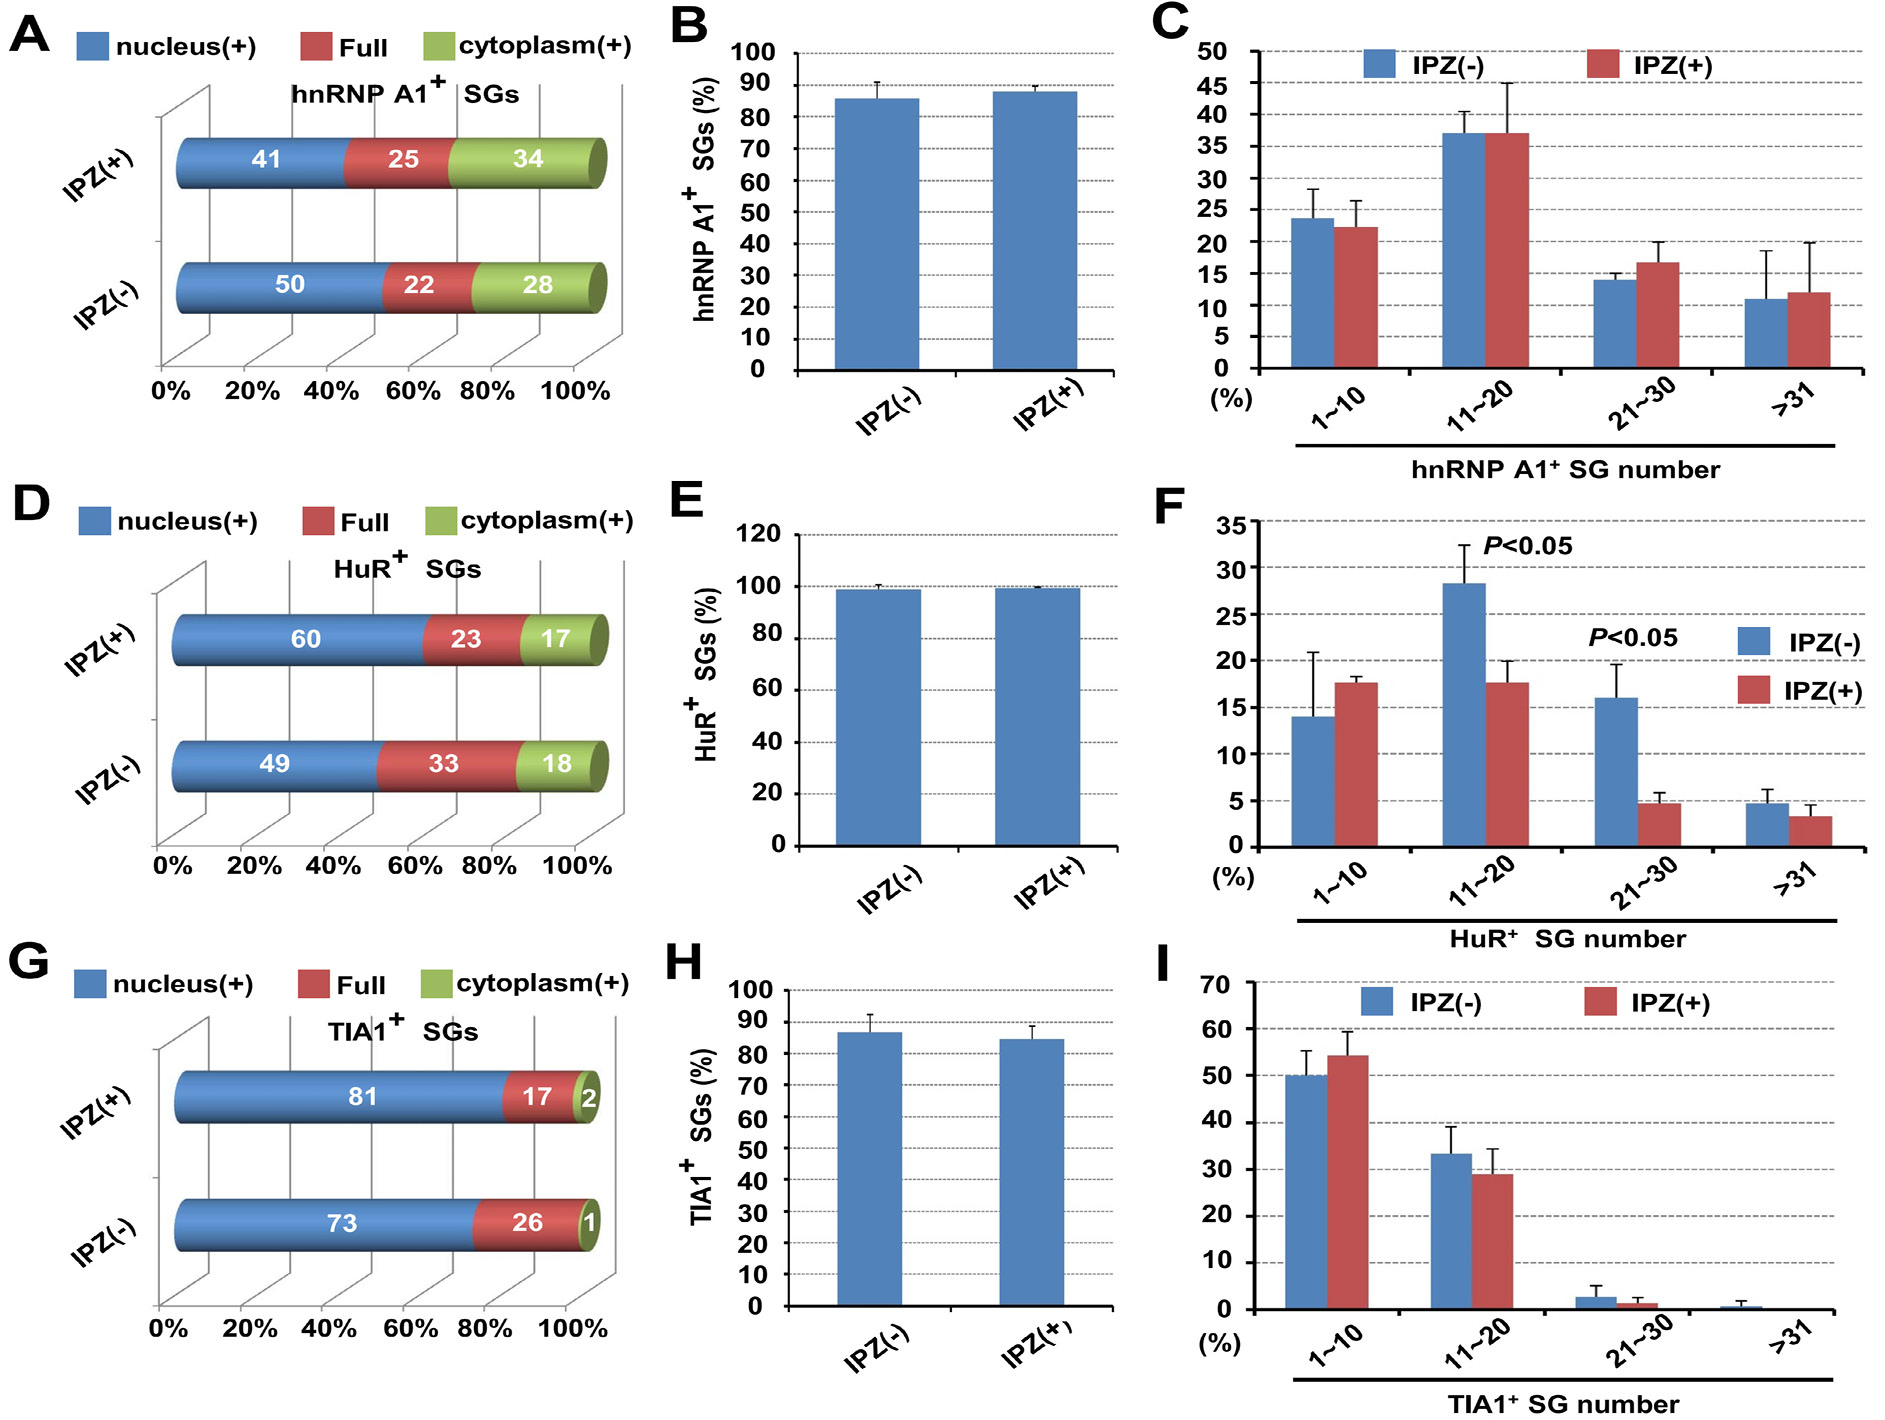
Quantification analysis for the effect of IPZ on the nucleus/cytoplasm localization, SG formation of hnRNP A1, HuR and TIA1 during arsenite-induced oxidative stress. The ratio of cells with the nucleus-localized signal, cytoplasm-localized signal, or full cell-localized signal of hnRNP A1 (A), HuR (D), and TIA1 (G) in all selected cells was calculated, respectivly. The percentage of hnRNP A1 (B), HuR (E), TIA1 (H) marked SG positive cells, and numbers of hnRNP A1 (C), HuR (F), TIA1 (I) marked granules per cell were also measured. Based on SG number per cell, there are four categories, namely 1~10, 11~20, 21~30 and >30. An independent-sample Student’s T Test was performed using SPSS 16.0. P<0.05 means significant difference.


