Application of Predictive Microbiology in Monitoring S. aureus Growth in Raw Chicken Meat


Research Article
Application of Predictive Microbiology in Monitoring S. aureus Growth in Raw Chicken Meat
Shaimaa M. Ahmed1, Gehan M.A. Kassem1*, Fernando Pérez-Rodríguez2, Heba H.S. Abdel-Naeem1
1Department of Food Hygiene and Control, Faculty of Veterinary Medicine, Cairo University, Giza, 12211, Egypt; 2Department of Food Science and Technology, Faculty of Veterinary, Agrifood Campus of International Excellence (CeiA3), University of Córdoba, 14014, Córdoba, Spain.
Abstract | The frequent outbreaks of foodborne illness owing to Staphylococcus aureus require to deepen into the pathogen’s response to different food environments and conditions. This study was conducted to quantify the growth behavior of S. aureus in Tryptone Soya Broth (TSB) using turbidity and plate count methods as well as monitoring and modelling its potential growth in chicken breast and thigh meats at room temperature (25 °C) and refrigeration temperature (4 °C). The calibration curve showed a linear relationship between the turbidity measurement and bacterial cell count in TSB. Moreover, the coefficient of determination index (R2) was 0.8789 which indicates that the linear function was acceptable for reflecting the relationship between them. The growth kinetics of S. aureus obtained from Baranyi model indicated that the maximum growth rate was non-significantly different between turbidity and plate count methods and the primary models fit well (R2; 0.83 vs 0.93) in the two methods, respectively that indicating a good model fitting to our experimental data. The potential growth of S. aureus in raw chicken breast and thigh meats at room and refrigeration temperatures showed that regardless of meats type, S. aureus counts were significantly higher at room temperature than their counts at the refrigeration temperature. In conclusion, predictive food microbiology could be a valuable tool for understanding the growth behavior of S. aureus in artificially inoculated TSB broth and chicken meat.
Keywords | Predictive models, S. aureus, Turbidity, Plate count, Chicken meat
Received | November 06, 2022; Accepted | December 20, 2022; Published | March 25, 2023
*Correspondence | Gehan M.A. Kassem Department of Food Hygiene and Control, Faculty of Veterinary Medicine, Cairo University, Giza, 12211, Egypt; Email: Kassem24@cu.edu.eg
Citation | Ahmed SM, Kassem GMA, Perez-Rodriguez F, Abdel-Naeem HHS (2023). Application of predictive microbiology in monitoring S. aureus growth in raw chicken meat. Adv. Anim. Vet. Sci. 11(5): 738-746.
DOI | http://dx.doi.org/10.17582/journal.aavs/2023/11.5.738.746
ISSN (Online) | 2307-8316

Copyright: 2023 by the authors. Licensee ResearchersLinks Ltd, England, UK.
This article is an open access article distributed under the terms and conditions of the Creative Commons Attribution (CC BY) license (https://creativecommons.org/licenses/by/4.0/).
INTRODUCTION
Poultry meat especially chicken meat is a famous healthy and inexpensive source of animal protein among Egyptian consumers. Such meat is rich in protein of high biological values, contains low cholesterol and fat contents with high essential fatty acids a matter which increases its healthy and nutritional image. Furthermore, the increase of consumers’ attractiveness to chicken meat is due to the absence of cultural and religious restrictions on its consumption (Elshebrawy et al., 2022). Nevertheless, chicken meat is categorized as a highly perishable food as it harbors huge numbers of spoilage and pathogenic microorganisms especially if they are handled by uncontrolled ways during the processing operation (Abdel-Naeem et al., 2022). In addition, they are rich in essential nutrients besides containing some intrinsic factors such as a favorable pH and high water activity supporting microbial growth even if stored under chilling temperatures (Dave and Ghaly, 2011). Chicken cut-up parts such as breast and thigh cuts are more vulnerable to bacterial contamination than whole chicken carcasses during preparation and handling due to increasing surface areas (Sofos, 1994). In this context, chicken meat inflicts a health hazard as well as an economic problem, for both producers and consumers.
Among the microbiota of raw poultry meat, S. aureus is a common microorganism that has been implicated in many foodborne intoxication outbreaks. Moreover, S. aureus can be used as an indicator of poor hygiene in food processing that produces gastroenteritis worldwide through ingestion of foods containing heat-stable staphylococcal enterotoxins (Mir et al., 2018). These enterotoxins can be produced if the food is prepared and stored under inappropriate environmental conditions (i.e. temperature and time abuse). Since S. aureus can grow in a wide range of temperatures (7 °C ˗ 48.5 °C) with an optimum temperature of 30 °C to 37 °C (Schmitt et al., 1990).
Perishable food such as fresh chicken meat may be exposed to temperature fluctuations and/or abuse exceeding the limit of safe storage temperature (5C) (Casanova et al., 2022). The unexpected changes in cold chain temperatures may affect food safety and quality due to the rapid growth of pathogenic bacteria such as S. aureus (Yehia et al., 2020). Therefore, the temperature of retail stores and household refrigerators is a very critical point in the food supply chain. In addition, the growth of S. aureus can occur at a constant high ambient temperature (25 °C) during consumers handling and transportation of chicken meat to their homes (Casanova et al., 2022). In this sense, it is necessary to apply efficient management in the food supply chain to maintain the optimal food storage conditions from the point of production till its consumption to prevent the growth of S. aureus.
The increasing awareness of the need to establish microbiological food safety is a major challenge facing all food sectors. Food safety can be achieved by identifying the risk factors by using predictive food microbiology (Yoon, 2010). It is a scientific field within food microbiology intended to develop predictive models to anticipate microbial behavior in food and its responses (growth, survival, or death) to environmental conditions (temperature, pH, water activity (aw)). This information can be used to prevent foodborne pathogens and food spoilage (Ding et al., 2011). Moreover, it incorporates traditional microbiological knowledge with the disciplines of statistics, mathematics, and computing systems. Much of the expended effort on generating predictive microbiology has been focused on kinetic modelling such as primary and secondary models (Polese et al., 2011). A primary model describes changes in bacterial counts during the storage time to estimate kinetic parameters such as growth rate (μmax) and lag time (λ) while the secondary model describes the effects of different environmental factors on the kinetic parameters (Ha et al., 2016).
The objective of the current study was to compare the growth behavior of S. aureus strain in broth using turbidity and plate count methods besides the preparation of a calibration curve to be used as a tool for further experiments in the future. Moreover, estimation of S. aureus growth parameters that obtained from modeling the turbidity and plate count data. Also, monitoring the potential growth of S. aureus in raw chicken breast and thigh meats at two different temperatures; room temperature at 25 °C and refrigeration temperature at 4 °C.
MATERIALS AND METHODS
Study design
This study was carried out in five independent experiments at different times where 3 samples were taken for each analytical point. Such a study was divided into two parts. The first part was to compare the growth behavior of S. aureus strain in broth using turbidity measurements and plate count methods while the second part was to monitor the potential growth of S. aureus experimentally inoculated in raw chicken breast and thigh meats at two different temperatures; room temperature at 25 °C and refrigeration temperature at 4 °C.
The growth behavior of S. aureus in broth using turbidity and plate count methods (First experiment)
Inoculum preparation: ATCC 5923 reference S. aureus strain was obtained from the central health laboratories of the ministry of health, Egypt. This strain was tested in Baird Parker Agar (B.P, CM0275, Oxoid Ltd, Basingstoke, UK) and showed a typical growth. Afterward, the culture was maintained at ‒18 °C in the brain‒heart infusion (BHI, CM1135, Oxoid Ltd., Basingstoke, UK) containing 15% glycerol (G5516, Sigma‒Aldrich, St. Louis, MO, USA) until use. Three days before the experiment, a stock culture of the strain was transferred to a tube containing 10 mL of Tryptone Soya Broth (TSB, Oxoid Ltd., Basingstoke, UK) and incubated at 37 °C for 24 h. One mL from the previously inoculated TSB was subcultured into another tube containing 10 mL of TSB and incubated at 37 °C for 24 h. One more time, S. aureus was subcultured into a flask containing 100 mL of TSB and incubated for 18 h (Perez-Rodriguez et al., 2013). To determine the initial concentration of S. aureus inoculum, 1 mL of aliquot was serially diluted in 0.1% peptone water (LP0037, Oxoid Ltd., Basingstoke, UK), surface plated onto Baird–Parker agar plates, and incubated at 37 °C for 48 h, then colonies were counted.
Turbidity method: The overnight grown S. aureus culture (5 mL) was transferred to a flask containing 250 mL of TSB and incubated at 37 °C for 24 h. One mL of the culture suspension was taken before the incubation (zero time) as well as every 1 h of the incubation period to measure the optical density (OD) at a wavelength of 600 nm using a spectrophotometer (Unico 1200, USA) against the blank (uninoculated TSB broth) till the reading becomes static (Maier et al., 2000). At the end of the experiment, plot a graph of time (h) on the X axis versus optical density at 600nm on the Y axis to obtain a growth curve.
Plate count method: From the inoculated TSB flask that was prepared in the turbidity method, 1 mL of this culture suspension was added to 9 mL of peptone water to obtain a dilution of 10-1. Decimal dilutions were prepared and 0.1 mL of the appropriate dilution was spread over Baird-parker Agar and incubated at 37 °C for 48 h for enumeration of S. aureus count (Bennett et al., 2015). This count was taken at the same time interval of the O.D readings at zero time before the incubation as well as every 1 h of the incubation period for up to 8 h.
Development of the primary model: Growth curves of S. aureus were produced by plotting the O.D and bacterial count (Log10 CFU/g) against the incubation time. To estimate the growth kinetics of S. aureus in TSB, primary modelling was conducted using the Baranyi growth model via the Microsoft Excel add-in, DMFit (available at http://www.combase.cc/index.php/en/; Baranyi & Roberts, 1994). The Baranyi equation is as follows:
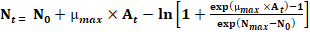
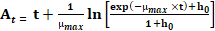
Where At: adjustment function; μmax: maximum specific growth rate; N0: initial bacterial cell counts; Nmax: final bacterial counts; h0: a parameter referring to the initial physiological state of the cells; t: time. The coefficient of determination (R2) was used to evaluate the goodness of fitting our data, which was also given by DMFit.
The estimated μmax, λ, and R2 in this study were compared between turbidity measurement and bacterial count.
The potential growth of S. aureus in raw chicken breast and thigh meats at 25 °C and 4 °C (2nd experiment)
Inoculum and sample preparation: The previous S. aureus strain (ATCC 5923) was reactivated in the same way as in the first experiment using Tryptone Soya Broth (Oxoid, CM 129). A total of 10 kg of fresh boneless chicken breast and thigh meats (5 kg each) were obtained within 24 h post-mortem, from a local poultry meat processing plant. Samples were transferred aseptically inside the cooling icebox directly to the Food Hygiene Laboratory, Department of Food Hygiene, Faculty of Veterinary Medicine, Cairo University, Egypt. Samples were washed with sterile distilled water, then cut into small equal pieces (10 g) using a sterile knife, under complete aseptic conditions and kept in a sterile polyethylene bags.
Inoculation of chicken meat samples: Each 10 g of chicken breast and thigh meat samples was inoculated with 0.1 mL of S. aureus strain to obtain an initial density of 6 Log10 CFU/g after that the inoculated samples were stored at room temperature (25 °C) and refrigeration temperature (4 °C) for 5 days. In this regard, 4 groups of inoculated chicken meat samples were obtained as follows: the first and second groups were S. aureus inoculated breast meat samples that were stored at 25 °C and 4 °C, respectively. While the 3rd and 4th groups were S. aureus inoculated thigh meat samples that were stored at 25 °C and 4 °C, respectively besides the control non-inoculated samples.
Microbial analysis for the inoculated chicken meat samples: Ten grams from the inoculated chicken meat samples were aseptically taken every 24 h up to 5 days from each breast and thigh meat sample which was exposed to two different temperature conditions (25 °C and 4 °C). Each sample was added to 90 mL of sterile peptone water to reach a final dilution of 1:10 and then homogenized in a stomacher (Seward 80 Lab Blender, compact, 110VAC) for 60 s. Following homogenization, serial dilutions in peptone water were prepared and aliquots of 0.1 mL of the appropriate dilution were spread over Baird-parker Agar and incubated at 37 °C for 48 h for enumeration of S. aureus count (Bennett et al., 2015). In addition, the non-inoculated control samples were analyzed for the presence of S. aureus at zero time of examination which revealed no typical growth of S. aureus was observed in this sample.
Statistical analysis
The calibration curve among bacterial counts and OD of S. aureus in TSB broth as well as the related linear equation obtained using Microsoft Excel 2016 (Microsoft Corporation). Moreover, statistical data analysis for S. aureus counts in chicken meat samples stored at different temperatures was carried out using SPSS statistics 27.0 for windows and expressed as mean ± SE. The differences between the means were determined using a one-way analysis of variance (ANOVA) and were considered significant at the P < 0.05 level.
RESULTS AND DISCUSSION
The growth behavior of S. aureus in broth using turbidity and plate count methods
Generation of the growth curve of S. aureus in TSB broth using turbidity and plate count methods: The significance of the quality and quantity of data that is applied in predictive microbiology for model generation was highlighted by McMeekin et al. (1993). Different new methods can be used to predict or measure cell counts, such as turbidity detection, microscopic methods, and flow cytometry. Among such methods, turbidity measurement is the simplest and most practical method since this technique is used to detect the OD of the broth culture using a spectrophotometer. Furthermore, the turbidimetric method allows for rapid and inexpensive data generation, where such a method could be extensively employed by predictive microbiology modellers (Schagerl et al., 2022).
The growth curves of S. aureus in TSB broth at an incubation temperature of 37 °C are shown in Fig.1. To highlight the relationship between OD and bacterial count (CFU) in the exponential growth phase of S. aureus, bacterial culture was taken each hour of the culture for OD detection using the spectrophotometer and simultaneously the bacterial plate counting was carried out. The bacterial growth curve illustrated the growth pattern of S. aureus that was obtained from the logarithm of CFU and the change in O.D as a function of time. The initial concentration of S. aureus was 4.5 Log10 CFU/ml, and their counts tend to be increased with the increase of incubation time till reached 9 Log10 CFU/ml at the end of incubation time (8 h). From the obtained growth curve of S. aureus, it was clear that its exponential growth phase was extended from the period of 4 h to 8 h. Such finding was in agreement with Zhang et al. (2015), who studied the relations of OD and bacterial counts in the bacterial exponential growth phase of different bacterial strains including S. aureus, and noticed that despite each bacterial strain having different exponential growth phases, however, the common exponential growth phase is laying in the period from 4 h to 9 h. In this context, the selection of the bacteria in such period can be carried out for further studies for obtaining an appropriate calibration curve
Calibration curve of S. aureus growth estimating the linear relationship between O.D and bacterial counts: It is well-known that CFU can be related to OD through a linear equation (Baty et al., 2002). In this concern, our study showed the linear relationship between the values of OD in log scale and bacterial count (CFU/g) during the exponential growth phase (Fig. 2). The linear function calculated with Excel 2016 showed a good agreement with a coefficient of determination value (R2) which reached 0.8789. Such finding indicated that the liner function is acceptable for modelling the relationship between OD600 and CFU during the exponential growth phase of S. aureus and the linear function could clarify the relationship between the OD and bacterial cell count.
It is noteworthy that the R2 value represents the goodness of fit for the modelled function. Since, when the value becomes near 1 the better the function matches. This finding confirmed our acceptable R2 value (0.8789) and such value was also nearly similar to the R2 value (0.983) that obtained by Zhang et al. (2015). Furthermore, the authors also recorded that the R2 value of the power function (0.995) was significantly higher than that of the linear relationship (0.983). Accordingly, they concluded that the power function is more appropriate for modelling the relationship between OD and bacterial cell count during the bacterial exponential growth phase. In addition, Francois et al. (2005) found that OD could be affected by environmental factors, such as analytical instruments or temperature among others. Thus, if the operation is handled by different people, in different labs, or at different times. Accordingly, if the detecting conditions are changed, the value of OD differs and this may affect the relationships between OD and CFU.
Primary modelling of S. aureus growth data from turbidity and plate count methods: Turbidimetric and bacterial cell count data used for estimation of all variables could influence growth rate. The modified Gompertz and Logistics linear models are the most commonly used theoretical functional models for describing growth in different fields (McMeekin et al., 1993; Peleg, 1997). Nevertheless, they were not originally developed for modeling bacterial growth and did not involve the data that are linked to the microbial growth parameters (Baranyi et al., 1993). In this sense, a mechanistic model of bacterial growth which could address different environmental conditions and times was developed by Baranyi and Roberts (1994). Furthermore, Pal et al. (2008) reported that among different models, the Baranyi model exhibited the best fit for different microbial curves, such as the sigmoidal and tailing phase curves. Likewise, Baranyi model can present different phases (lag, tailing, and linear) for multiple parameters, however, the modified Gompertz equation describes such phases in a more complex manner (Xiong et al., 1999).
The Baranyi predictive model of combase software used in our study to predict the growth kinetics of S .aureus in TSB broth using the data obtained from turbidity (Fig. 3 and Table 1) and plate count (Fig. 4 and Table 1) methods by applying the Baranyi model equation. The obtained data of OD for the growth curve of S. aureus up to 8 h of incubation times are near to the fitting data. Our result of the growth kinetics (µmax; maximum growth rate) of S. aureus obtained from the primary modelling indicated there was a non-significant difference in µmax value (0.48 vs 0.54) between turbidity and plate count methods (Table 1). Dalgaard et al. (1994) reported that determination of µmax can be obtained from the turbidimetric method, for different conditions of food products, provided that an appropriate experimental protocol is adjusted. In this regard, our data showed that turbidimetric measurements can be used for the determination of µmax for the growth of S. aureus bacteria in laboratory media.
R2 statistic can be used as an overall measure of the fitting process. Our R2 index was 0.83 and 0.93 in turbidity and plate count methods, respectively that indicating a good model fitting to our experimental data. The obtained results also revealed that incubation temperature at 37 °C had a strong effect on S. aureus growth in TSB broth. Such finding was in harmony with Lanciotti et al. (2001) and Rodriguez-Caturla et al. (2012), who found that incubation temperature had a robust influence on S. aureus growth in BHI broth.
Table 1: Estimated kinetic parameters of S. aureus derived from the fitting of Baranyi model on TSB broth incubated at 37 °C using optical density (OD) and plate count methods
| Kinetic parameters | O.D | Plate count method |
|
µmax (h-1) |
0.48a ± 0.08 |
0.54a ± 0.04 |
|
R2 |
0.83 | 0.93 |
Values represent the mean of 3 independent replicates ± SE.
µmax (maximum growth rate); and R2 coefficient of determination.
a Mean values with different superscripts between optical density (OD) and plate count methods are significantly (P < 0.05) different.
Table 2: S. aureus counts (Log10 CFU/g) in chicken breast and thigh meats stored at room temperature (25 °C) and refrigeration temperature (4 °C) for 5 days
| Storage temperatures | Storage period (days) | ||||
|
1st day |
2nd day |
3rd day |
4th day |
5th day |
|
|
Chicken breast meat |
|||||
| Room temperature |
7.40A,a,I ± 0.17 |
7.52A,a,I ± 0.15 |
7.33A,a,I ± 0.36 |
7.14A,a,I ± 0.20 |
7.05A,a,I ± 0.25 |
| Refrigeration temperature |
6.87B,a,I ± 0.14 |
6.98B,a,I ± 0.15 |
6.98A,a,I ± 0.15 |
6.90A,a,I ± 0.22 |
6.74B,a,I ± 0.20 |
|
Chicken thigh meat |
|||||
| Room temperature |
7.36A,a,I ± 0.10 |
7.37A,a,I ± 0.09 |
7.30A,a,I ± 0.16 |
7.27A,a,I ± 0.05 |
6.79A,a,II ± 0.18 |
|
Refrigeration temperature |
6.98A,a,I ± 0.08 |
7.00A,a,I ± 0.22 |
6.84B,a,I ± 0.12 |
6.82B,a,I ± 0.17 |
6.61A,a,I ± 0.23 |
Values represent the mean of 3 independent replicates ± SE.
A–B Mean values with different superscripts between the storage temperatures are significantly (P < 0.05) different.
a Mean values with different superscripts between the type of meats are significantly (P < 0.05) different.
I–II Mean values with different superscripts between the storage times are significantly (P < 0.05) different.
The potential growth of S. aureus in raw chicken breast and thigh meats at 25 °C and 4 °C
Temperature is one of the most significant factors that influence microbial growth and it is considered the primary extrinsic controlling factor. It is obvious in most food management systems including Hazard Analysis Critical Control Point (HACCP) since the temperature is a critical point that must be monitored during the processing, distribution, and storage of the food (USDA, 2003).
S .aureus counts in raw chicken breast and thigh meats at room temperature (25 °C) and refrigeration temperature (4 °C) are presented in Fig. (5), Fig. (6), and Table 2. The average initial count of S. aureus in chicken breast and thigh meats was 6.32 ± 0.10 log 10 CFU/g. This count starts to increase on the first day of examination in chicken breast (7.40 and 6.87 log10 CFU/g)and thigh meats (7.36 and 6.98 log10 CFU/g) at room and refrigerator temperatures, respectively. In this respect, the degree of increment in the chicken breast was 1.08 and 0.55 log 10 CFU/g, and thigh meat was 1.04 and 0.66 log 10 CFU/g at two temperatures, respectively. Regardless of the type of meats, S .aureus counts were significantly (P < 0.05) higher at roomtemperature on the 1st, 2nd, and 5th day of the storage period in breast meat samples and on the 3rd and 4th day of the storage period in thigh meat samples when compared with the refrigeration temperature. Nonetheless, there was a non-significant (P ˃ 0.05) difference in S. aureus counts between breast and thigh meats irrespective of the storage temperatures effect. In addition, at room temperature, there was a non-significant difference in S .aureus counts between chicken breast (7.40 Log10 CFU/g) and thigh meat (7.36 Log10 CFU/g) on the first day of storage and these counts start to increase gradually on the 2nd day then decrease from the 3rd day till the end of storage period at 5th day (7.05 versus 6.79 Log10 CFU/g) in chicken breast and thigh meat. Furthermore, S .aureus counts at refrigeration temperature in the raw chicken breast and thigh meat were 6.87 and 6.98 (Log10 CFU/g) on the first day of storage and start to increase gradually on the 2nd day then decrease from the 4th day in chicken breast meat and from the 3rd day in chicken thigh meat till the end of storage period (5th day).
The effect of different temperatures (4, 12, 18, 25, and 35 °C) on the growth of S. aureus in ready-to-eat (RTE) cooked rice with pork floss was studied by Lu et al. (2020) and they found that this pathogen grows at all storage temperatures except at temperature of 4 °C. In this circumstance, keeping the food under refrigerated storage lower than 4°C is very effective to control S. aureus growth. Likewise, the effect of storage temperature on S. aureus growth in cooked ham, turkey, and the chicken breast was reported by Castillejo-Rodríguez et al. (2002), who observed that there was no growth at temperatures lower than 13.5 °C in chicken breast samples. In another study, Valero et al. (2009) noticed that S. aureus could grow slowly at temperatures below 10 °C only with an optimum pH level of more than 6.0 and water activity range from 0.990 to 0.997. Furthermore, Yang et al. (1988) indicated that a temperature of 7 °C is safe for the short-term storage of raw turkey meat contaminated with S. aureus. However, Rodriguez-Caturla (2012) highlighted that a better adaptation and a faster growth of S. aureus in RTE meat products with production of staphylococcal enterotoxin A was recorded at pre-incubation optimal temperature (37 °C), pH (6.5) and aw (0.997).
From the obtained data, in our study, it is noticed that S. aureus growth was very low at refrigeration temperature (4 °C) and such observation agreed with the minimum growth temperature (7°C) of S. aureus in foods stated by USFDA (2012). The obtained result regarding the decreasing of S. aureus counts during the storage temperatures (4 °C and 25 °C) from the 4th day in chicken breast and 3rd day in chicken thigh till the end of storage was attributed to the propagation of spoilage organisms that counteracts the growth of S. aureus since such pathogen is a bad competitor to the microbial flora. This finding was also confirmed by Yang et al. (1988), who found that S. aureus failed to grow in raw turkey meat contaminated with spoilage organisms at 7 °C or 10 °C since under such conditions the competition from the spoilage flora restricts the growth of S. aureus.
CONCLUSIONS
This study demonstrated the growth pattern of S. aureus obtained from the logarithm of bacterial cell count and change in O.D as a function of time through the bacterial growth curve. Furthermore, there was a linear relationship between turbidity measurement and bacterial count determined as a calibration curve with R2=0.8789. Likewise, our study developed predictive growth models for S. aureus in TSB broth using the growth data of turbidity and plate count methods. The Baranyi primary models fit well in these methods which indicate a good model fitting to our data. Concerning the potential growth of S. aureus in chicken meats (breast and thigh) at different storage temperatures (25 °C and 4 °C), their counts were significantly higher at 25 °C than their counts at 4 °C regardless of the type of meats. Nevertheless, there was a non-significant difference in S. aureus counts between breast and thigh meats. The results of this study can be relevant to improving the food safety of chicken meat.
CONFLICT OF INTEREST
The authors have declared no conflict of interest.
NOVELTY STATEMENT
At present, general research in data generation for monitoring foodborne pathogens growth such as S. aureus in bacterial culture medium and real food like chicken meat is still in its infancy and needs more studies to be applied in predictive food microbiology. Additionally, comparing the effect of different storage temperatures on the growth of S. aureus in different chicken meat cuts is very scarce. Accordingly, this study was designed to compare the growth behavior of S. aureus in broth using turbidity and plate count methods besides the preparation of a calibration curve to be used as a tool for further experiments in the future. Likewise, estimation of S. aureus growth kinetics parameters that obtained from modeling the turbidity and plate count data. Moreover, monitoring the potential growth of S. aureus in chicken cut-up parts (breast and thigh) at two different temperatures (room temperature at 25 °C and refrigeration temperature at 4 °C).
AUTHOR’S CONTRIBUTION
All authors shared the same effort during performing this study
rEFERENCES
Abdel-Naeem HH, Ebaid EM, Khalel KH, Imre K, Morar A, Herman V, EL-Nawawi FA (2022). Decontamination of chicken meat using dielectric barrier discharge cold plasma technology: The effect on microbial quality, physicochemical properties, topographical structure, and sensory attributes. LWT ‒ Food Sci. Technol.,113739. https://doi.org/10.1016/j.lwt.2022.113739
Baranyi J, Roberts TA (1994). A dynamic approach to predicting microbial growth in food. Int. J. Food Microbiol., 23: 277–294. https://doi.org/10.1016/0168-1605(94)90157-0
Baranyi J, Roberts TA, McClure P (1993). A non-autonomous differential equation to model bacterial growth. Food Microbiol., 10: 43–50. https://doi.org/10.1006/fmic.1993.1005
Baty F, Flandrois JP, Delignette-Muller ML (2002). Modeling the lag time of Listeria monocytogenes from viable count enumeration and optical density data. Appl. Environ. Microbiol., 68(12): 5816–5825. https://doi.org/10.1128/AEM.68.12.5816-5825.2002
Bennett RW, Hait JM, Tallent SM (2015). Staphylococcus aureus and Staphylococcal Enterotoxins. In: Y. Salfinger, & M. L. Tortorello (eds.), Compendium of methods for the microbiological examination of foods (5th ed., Chapter 39, pp. 509–526). Washington. D.C. USA: American Public Health Association.
Casanova CF, Souza MAD, Fisher B, Colet R, Marchesi CM, Zeni J, Cansian RL, Backes GT, Steffens C (2022). Bacterial growth in chicken breast fillet submitted to temperature abuse conditions. Food Sci. Technol., 42: 1‒5. https://doi.org/10.1590/fst.47920
Castillejo-Rodríguez AM, García-Gimeno RM, Zurera CG, Barco AE, Rodríguez PMR (2002). Assessment of mathematical models for predicting Staphylococcus aureus growth in cooked meat products. J. Food Prot., 65: 659–665. https://doi.org/10.4315/0362-028X-65.4.659
Dalgaard P, Ross T, Kamperman L, Neumeyer K, McMeekin TA (1994). Estimation of bacterial growth rates from turbidimetric and viable count data. Int. J. Food Microbiol., 23(3-4): 391‒404. https://doi.org/10.1016/0168-1605(94)90165-1
Dave D, Ghaly AE (2011). Meat spoilage mechanisms and preservation techniques: a critical review. Am J Agric Biol Sci., 6(4): 486‒510. https://doi.org/10.3844/ajabssp.2011.486.510
Ding T, Shim YH, Kim HN, Ha SD, Chung MS, Hwang IG, Oh DH (2011). Development of predictive model for the growth of Staphylococcus aureus in Kimbab. Food Sci. Biotechnol., 20: 471–476. https://doi.org/10.1007/s10068-011-0065-y
Elshebrawy HA, Abdel-Naeem HH, Mahros MA, Elsayed H, Imre K, Herman V, Morar A, Sallam KI (2022). Multidrug-resistant Salmonella enterica serovars isolated from frozen chicken carcasses. LWT ‒ Food Sci. Technol., 113647. https://doi.org/10.1016/j.lwt.2022.113647
Francois K, Devlieghere F, Standaert AR, Geeraerd AH, Cools I, Van Impe JF, Debevere J (2005). Environmental factors influencing the relationship between optical density and cell count for Listeria monocytogenes. J. Appl. Microbiol., 99(6): 1503-1515. https://doi.org/10.1111/j.1365-2672.2005.02727.x
Ha J, Gwak E, Oh MH, Park B, Lee J, Kim S, Lee H, Lee S, Yoon Y, Choi KH (2016). Kinetic behavior of Salmonella on low NaNO2 sausages during aerobic and vacuum storage. Korean J Food Sci Anim Resour, 36(2): 262–266. https://doi.org/10.5851/kosfa.2016.36.2.262
Lanciotti R, Sinigaglia M, Gardini F, Vannini L, Guerzoni ME (2001). Growth/no growth interfaces of Bacillus cereus, Staphylococcus aureus and Salmonella enteritidis in model systems based on water activity, pH, temperature and ethanol concentration. Food Microbiol., 18: 659–668. https://doi.org/10.1006/fmic.2001.0429
Lu KH, Sheen YJ, Huang TP, Kao SH, Cheng CL, Hwang CA, Sheen S, Huang L, Sheen LY (2020). Effect of temperature on the growth of Staphylococcus aureus in ready-to-eat cooked rice with pork floss. Food microbiol, 89: 103374. https://doi.org/10.1016/j.fm.2019.103374
Maier RM, Pepper IL, Gerba CP (2000). Environmental Microbiology. Academic Press, San Diego.
McMeekin TA, Olley J, Ross T, Ratkowsky DA (1993) Predictive Microbiology: Theory and Application. Research Studies Press, Taunton, UK
Mir SA, Shah MA, Mir MM, Dar BN, Greiner R, Roohinejad S (2018). Microbiological contamination of ready-to-eat vegetable salads in developing countries and potential solutions in the supply chain to control microbial pathogens. Food Control, 85: 235‒244. https://doi.org/10.1016/j.foodcont.2017.10.006
Pal A, Labuza TP, Diez-Gonzalez F (2008). Comparison of primary predictive models to study the growth of Listeria monocytogenes at low temperatures in liquid cultures and selection of fastest growing ribotypes in meat and Turkey product slurries. Food Microbiol., 25: 460–470. https://doi.org/10.1016/j.fm.2008.01.009
Peleg M (1997). Modelling microbial populations with the original and modified versions of the continuous and discrete logistic equations. Crit Rev Food Sci Nut, 37: 471–490. https://doi.org/10.1080/10408399709527785
Perez-Rodriguez F, Posada-Izquierdo GD, Valero A, García-Gimeno RM, Zurera G (2013). Modelling survival kinetics of Staphylococcus aureus and Escherichia coli O157: H7 on stainless steel surfaces soiled with different substrates under static conditions of temperature and relative humidity. Food Microbiol., 33(2): 197‒204. https://doi.org/10.1016/j.fm.2012.09.017
Polese P, Torre MD, Spaziani MAE, Stecchini ML (2011). A simplified approach for modelling the bacterial growth/no growth boundary. Food Microbiol., 28: 384–391. https://doi.org/10.1016/j.fm.2010.09.011
Rodriguez-Caturla MY, Díaz AV, Vallejo JLR, García-Gimeno RM, Cosano GZ (2012). Effect of pre-incubation conditions on growth and survival of Staphylococcus aureus in sliced cooked chicken breast. Meat Sci., 92(4): 409‒416. https://doi.org/10.1016/j.meatsci.2012.05.003
Schagerl M, Siedler R, Konopáčová E, Ali SS (2022). Estimating Biomass and Vitality of Microalgae for Monitoring Cultures: A Roadmap for Reliable Measurements. Cells., 11(15): 2455. https://doi.org/10.3390/cells11152455
Schmitt M, Schuler-Schmid U, Schmidt-Lorenz W (1990). Temperatures limit of growth, Tnase, and enterotoxin production of Staphylococcus aureus strains isolated from foods. Int J Food Microbiol. 11(1):1–19. https://doi.org/10.1016/0168-1605(90)90036-5
Sofos JN (1994). Microbial growth and its control in meat, poultry and fish. In: A. M. Pearson, & T. R. Dutson (eds.), Quality attributes and their measurement in meat, poultry, and fish products (pp. 359–403). Glasgow: Blackie Academia and Professional. https://doi.org/10.1007/978-1-4615-2167-9_14
USDA (U.S. Department of Agriculture, Food Safety and Inspection Service) (2003). Poultry products inspection regulations—temperatures and chilling and freezing procedures. 9 CFR 381.66. U.S. Government Printing Office, Washington, D.C
USFDA (U.S. Food and Drug Administration) (2012). Bad Bug Book: Handbook of Foodborne Pathogenic Microorganisms and Natural Toxins, second ed.
Valero A, Pérez-Rodríguez F, Carrasco E, Fuentes-Alventosa JM, García-Gimeno RM, Zurera G (2009). Modelling the growth boundaries of Staphylococcus aureus: effect of temperature, pH and water activity. Int. J. Food Microbiol., 133: 186–194. https://doi.org/10.1016/j.ijfoodmicro.2009.05.023
Xiong R, Xie G, Edmondson AS, Linton RH, Sheard MA (1999). Comparison of the Baranyi model with the modified Gompertz equation for modelling thermal inactivation of Listeria monocytogenes Scott A. Food Microbiol., 16: 269–279. https://doi.org/10.1006/fmic.1998.0243
Yang X, Board RG, Mead GC (1988). Influence of spoilage flora and temperature on growth of Staphylococcus aureus in turkey meat. J. Food Prot., 51(4): 303‒309. https://doi.org/10.4315/0362-028X-51.4.303
Yehia HM, Al-Masoud AH, Alsawmahi ON, Aljahani AH, El-Din MFS (2020). Effects of citrox treatment on the survival of Methicillin-Resistant Staphylococcus aureus (MRSA) in chicken fillets packed under vacuum. Food Sci. Technol., 40(3): 588‒595. https://doi.org/10.1590/fst.13819
Yoon YH (2010). Principal theory and application of predictive microbiology. Food Sci. Ind., 43(1): 70‒74.
Zhang X, Wang Y, Guo J, Yu Y, Li J, Guo Y, Liu C (2015). Comparing two functions for optical density and cell numbers in bacterial exponential growth phase. J. Pure Appl. Microbiol., 9(1): 299‒305.
To share on other social networks, click on any share button. What are these?