

Characterization of CLCN5 and Expression Profile under Low-Salinity Stress in Takifugu rubripes


Characterization of CLCN5 and Expression Profile under Low-Salinity Stress in Takifugu rubripes
Lin Ye, Jie-Lan Jiang*, Jia Xu, Rui-Ting Liu, Yin-Qiu Tian, Qing-Qing Zang, Jia-Yi Cao and Ming-Guang Mao*
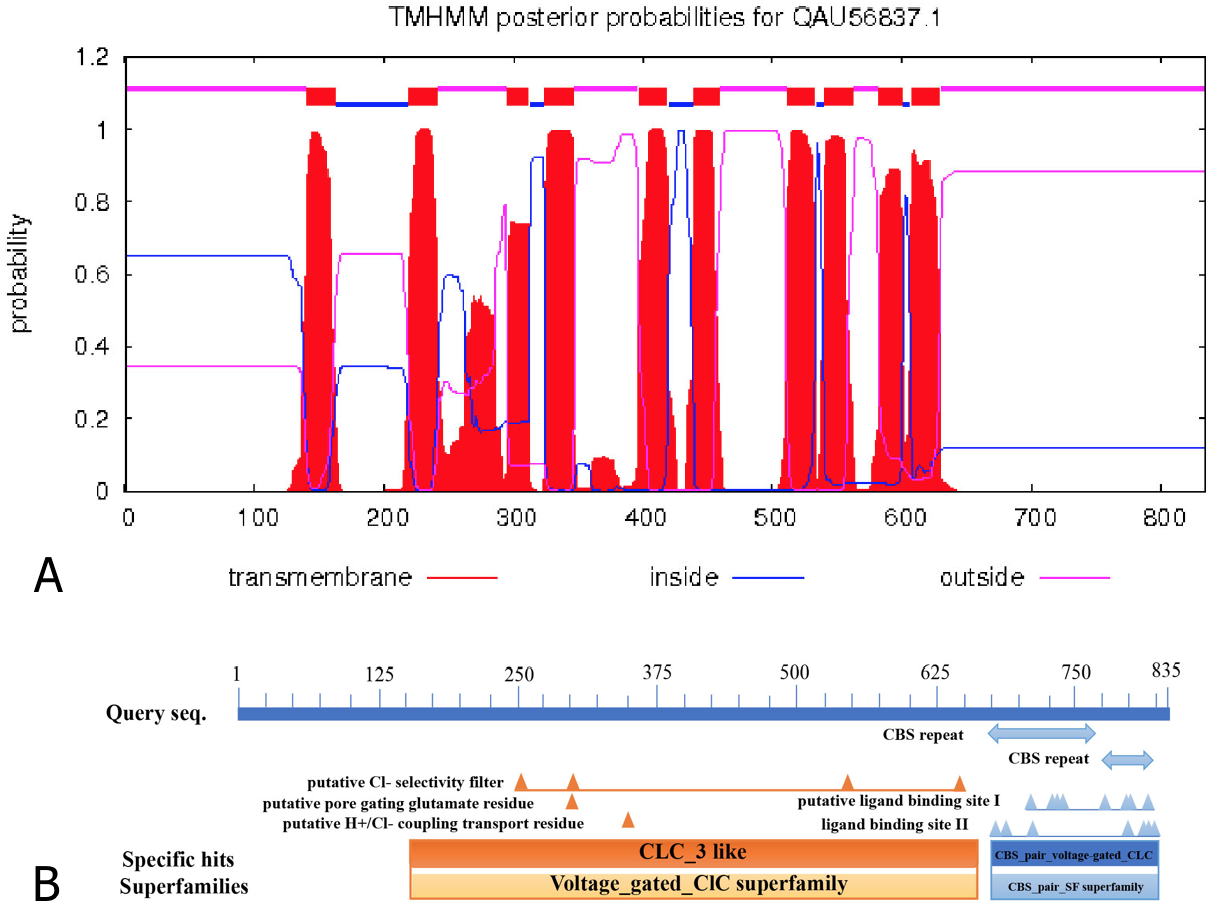
Transmembrane structures and functional domains in TrCLCN5. A: Transmembrane structures in TrCLCN5 detected using the TMHMM web server; B: Functional domains in TrCLCN5 detected using the conserved domain database web server.

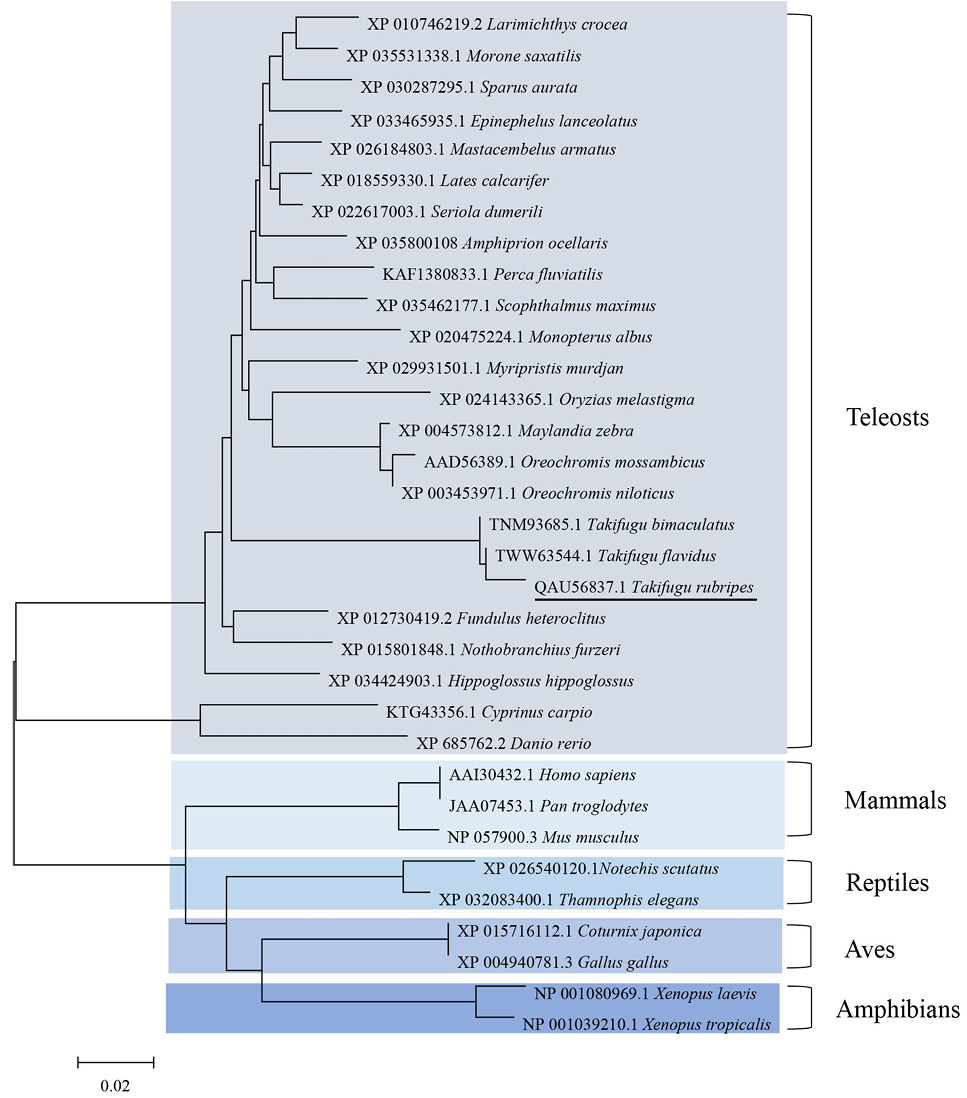
Neighbor-joining phylogenetic tree of TrCLCN5 amino acid sequences and other representative species.
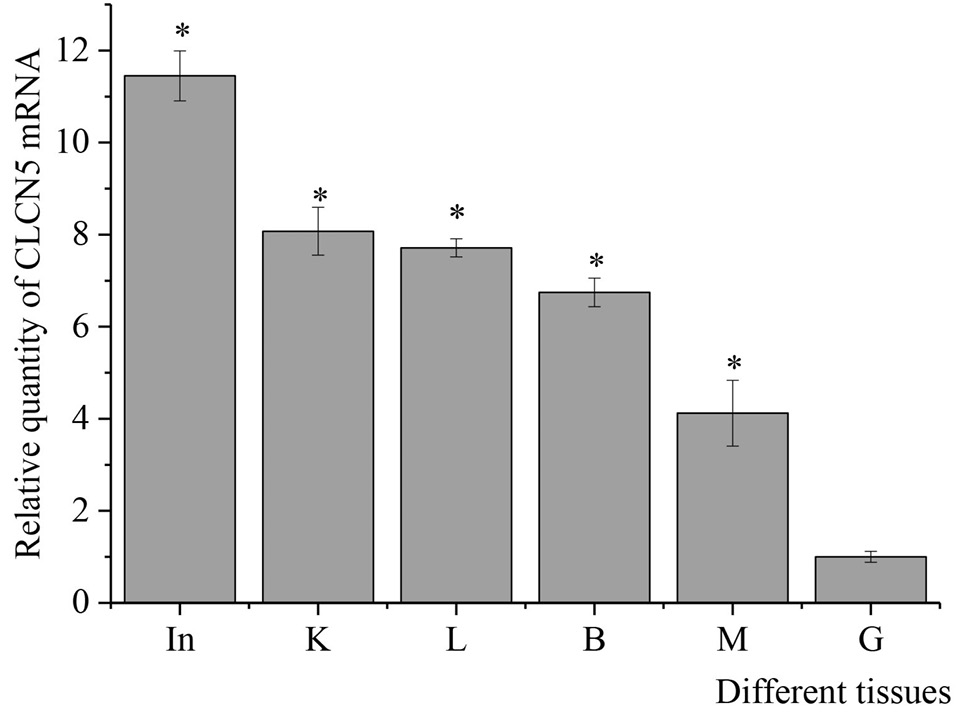
Relative expression level of CLCN5 mRNA in different tissues of Takifugu rubripes by quantitative real-time PCR analysis. The tissues include gill (G), liver (L), brain (B), muscle (M), intestine (In), and kidney (K). After normalization to β-actin, relative expressions of TrCLCN5 mRNA were calculated using the 2-ΔΔCt method. Bars represent the mean ± SD. The * indicates significant differences (p < 0.05).
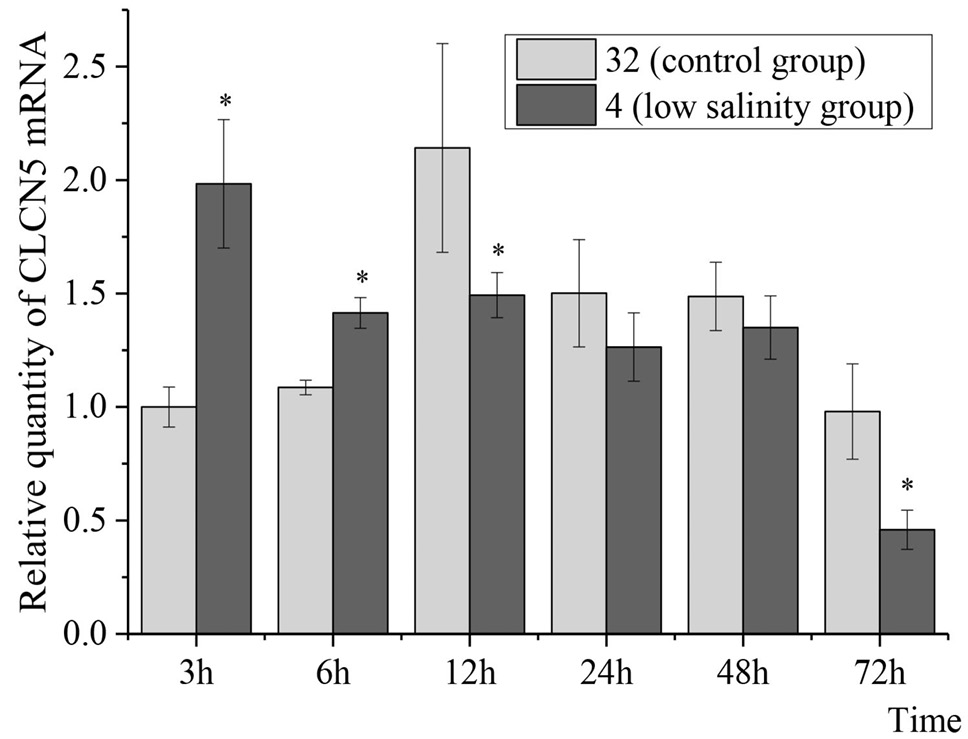
Relative expression of TrCLCN5 mRNA in Takifugu rubripes gills under low-salinity stress at different time points. After normalization to β-actin, relative expressions of TrCLCN5 mRNA were calculated using the 2-ΔΔCt method. Bars represent the mean ± SD. The * indicates significant differences from the control group (p < 0.05).

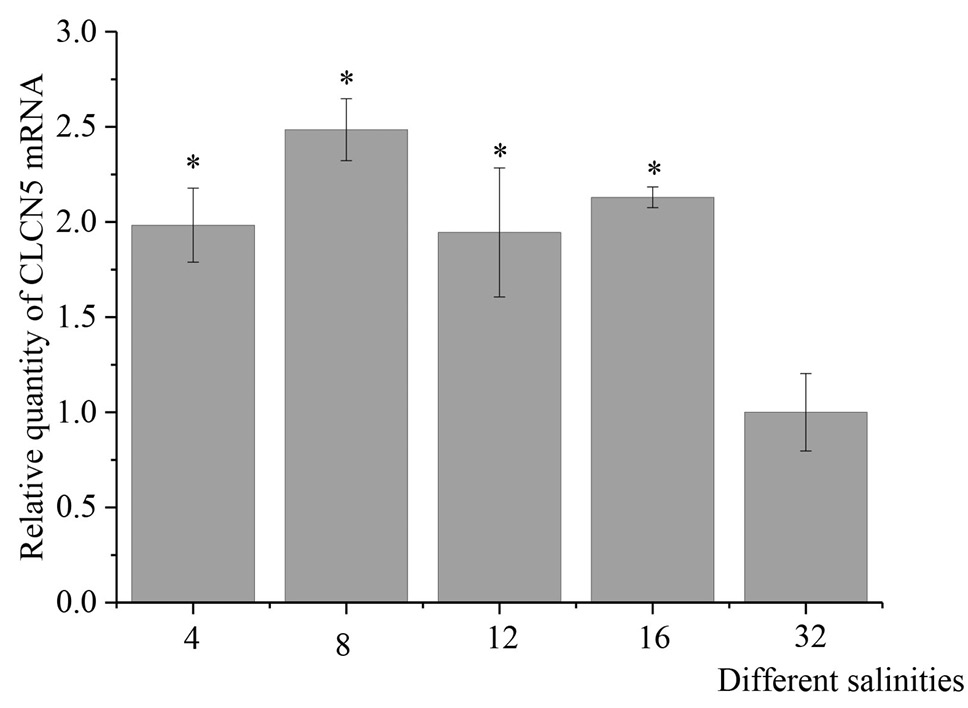
Relative expression of TrCLCN5 mRNA in Takifugu rubripes gills after 3 h of low-salinity stress. After normalization to β-actin, relative expressions of TrCLCN5 mRNA were calculated using the 2-ΔΔCt method. Bars represent the mean ± SD. The * indicates significant differences from the control group (p < 0.05).

