

Comparative Analysis of the Duodenum Microbial Communities of Zhedong White Goose (Anser cygnoides) at Different Reproductive Stages by High-Throughput Sequencing


Comparative Analysis of the Duodenum Microbial Communities of Zhedong White Goose (Anser cygnoides) at Different Reproductive Stages by High-Throughput Sequencing
Wanqiu Zhao1,2, Taoyan Yuan1, Li Chen2, Xue Du2, Weihu Chen4, Yan Fu1, Dong Niu3,* and Lizhi Lu2,*
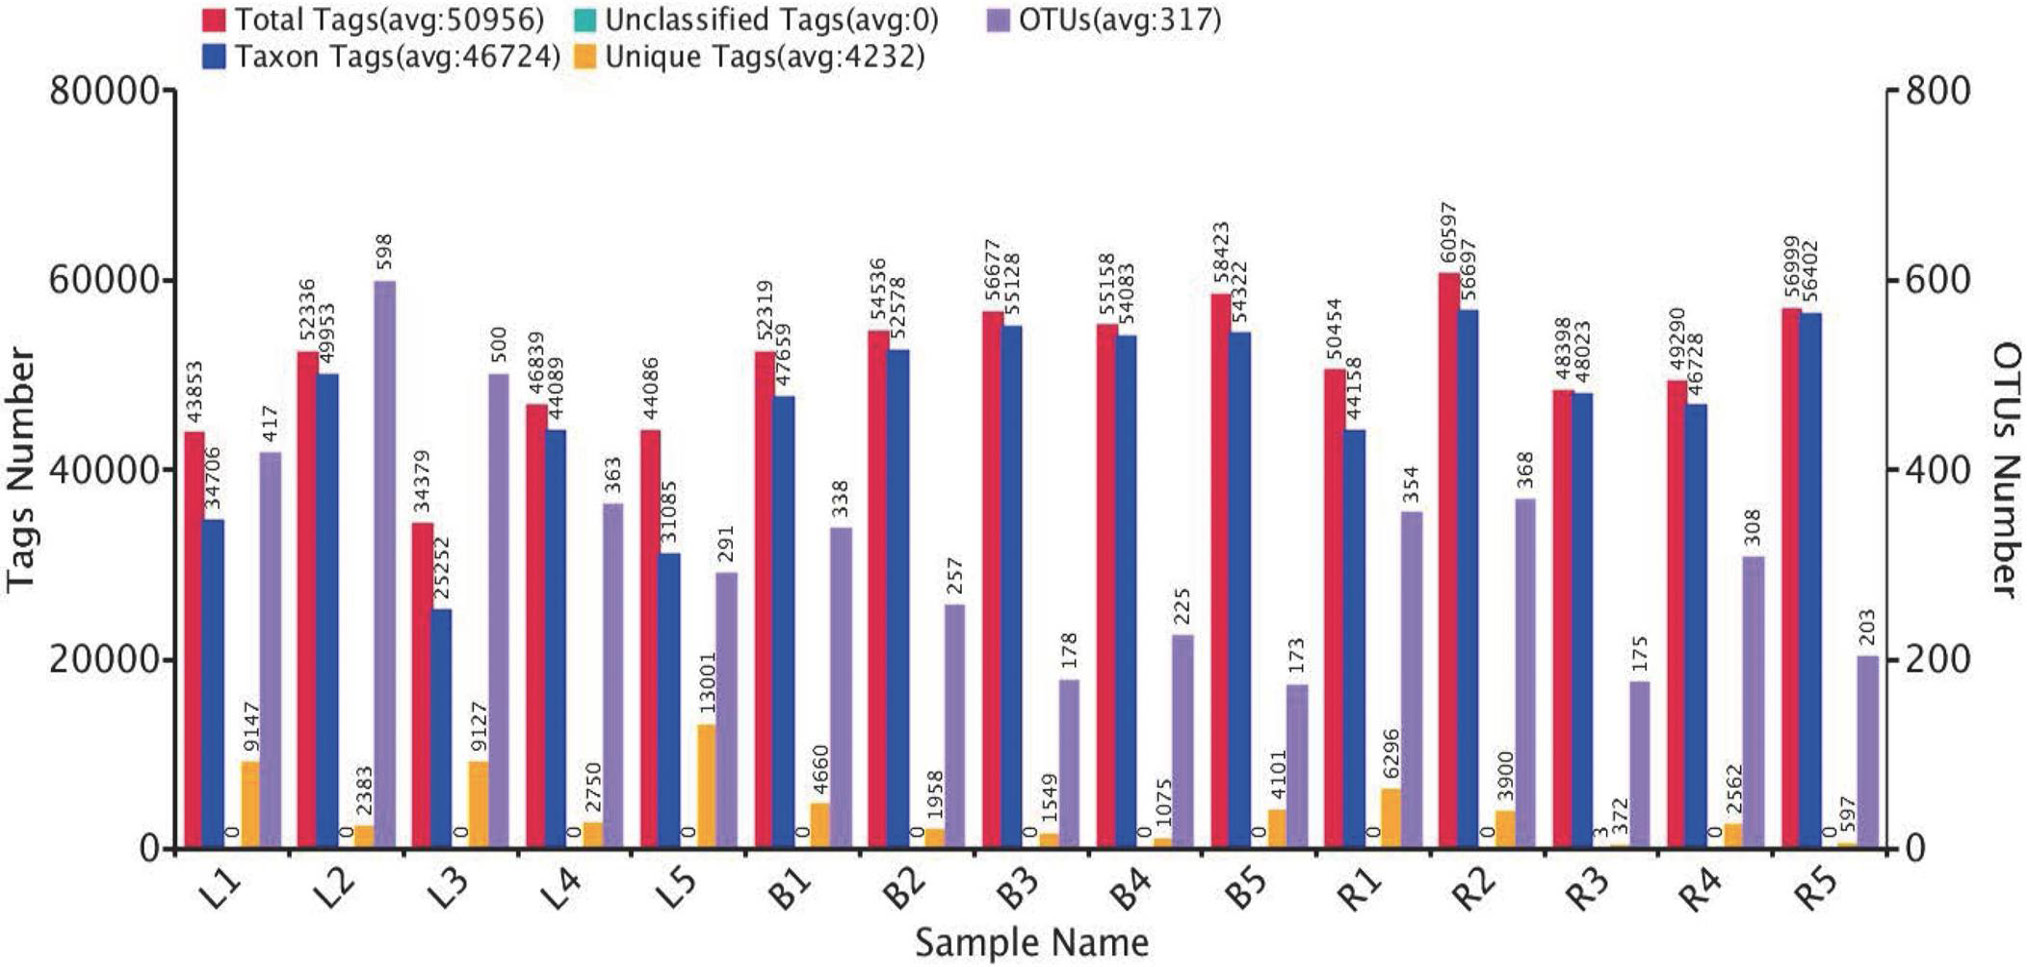
The OTU clustering of each sample. The red bars represent the numbers of effective tags of OTU clusters in each sample; the orange bars (Unique Tags) show the number of tags that could not be clustered to the OTUs; the blue bars (Taxon Tags) show the number of tags clustered to the OTUs that had the annotation information in each sample; the purple bars (OTUs) represent the number of OTUs obtained from each sample. L1~5, B1~5, and R1~5 represent 5 biological replicates at egg-laying, broody and recovery stages, respectively.

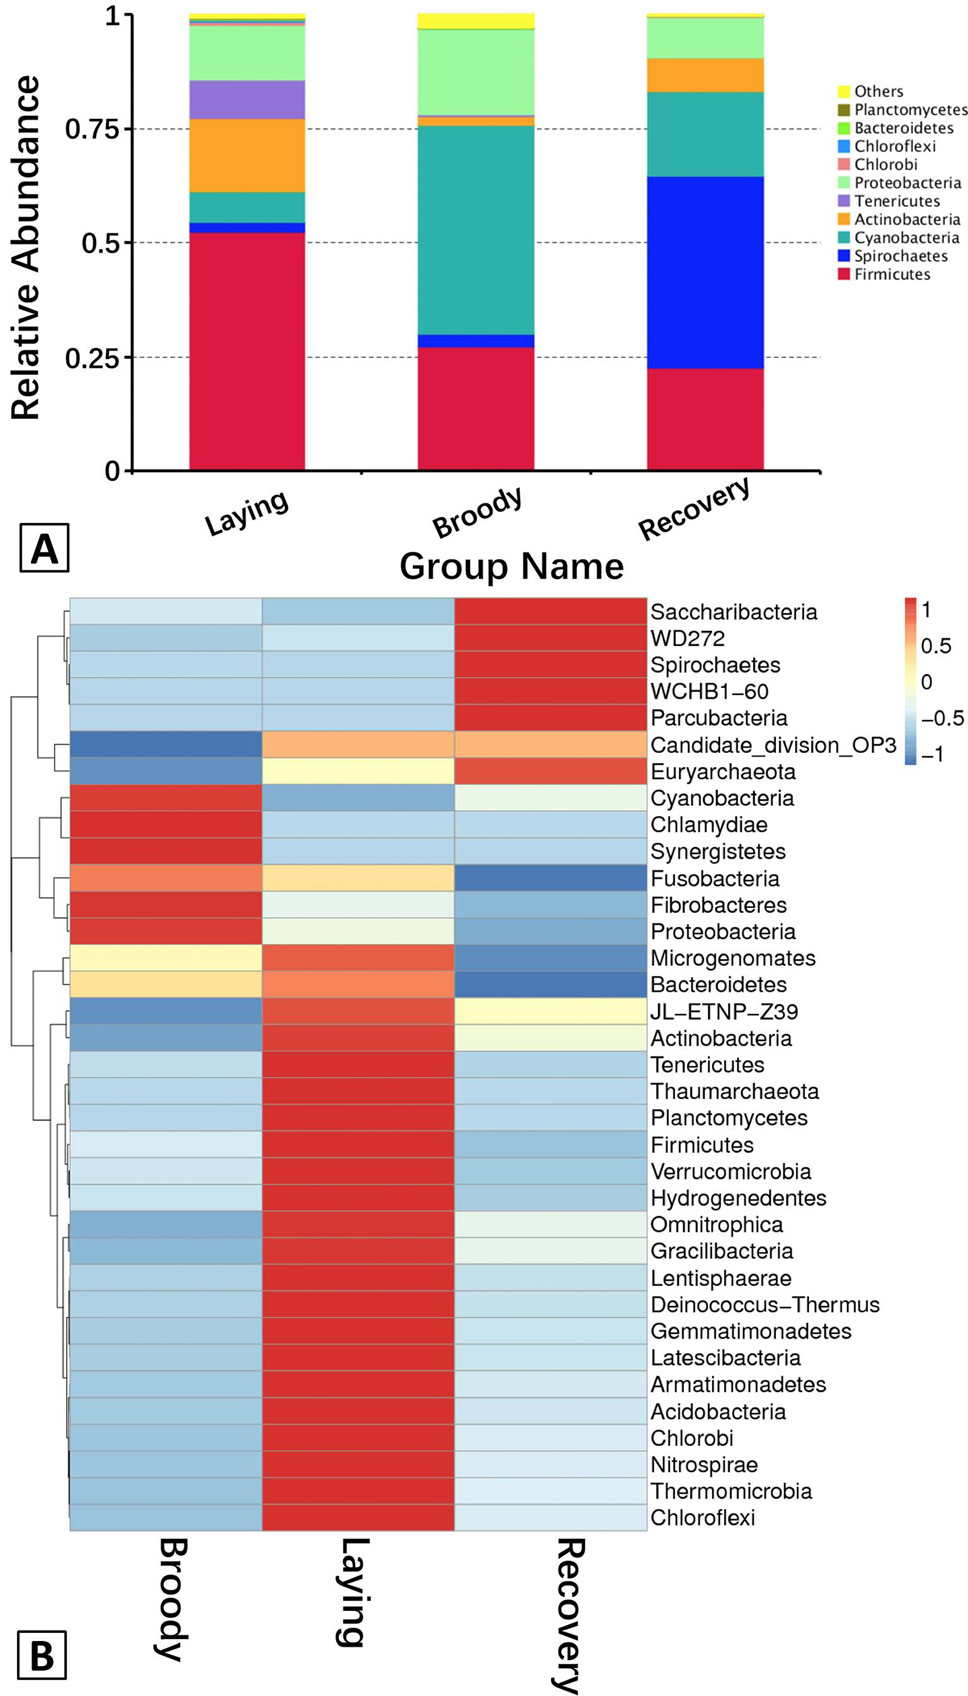
A, The abundance of the dominant bacteria in the duodenum communities at the phylum level. Each bar represents the abundance of the most abundant phyla in each group. Different colors represent different bacterial phyla. “Others” represents the sum of the abundance of all the phyla besides the top 10. B, Hierarchically clustered heatmap analysis showing the highly represented bacterial taxa (at the phylum level) in the three groups. The relative percentages (%) of the bacterial families are indicated by varying colors intensities according to the legend at the top of the figure.

A, The abundance of the dominant bacteria in the duodenum communities at the phylum level. Each bar represents the abundance of the most abundant phyla in each group. Different colors represent different bacterial phyla. “Others” represents the sum of the abundance of all the phyla besides the top 10. B, Hierarchically clustered heatmap analysis showing the highly represented bacterial taxa (at the phylum level) in the three groups. The relative percentages (%) of the bacterial families are indicated by varying colors intensities according to the legend at the top of the figure.

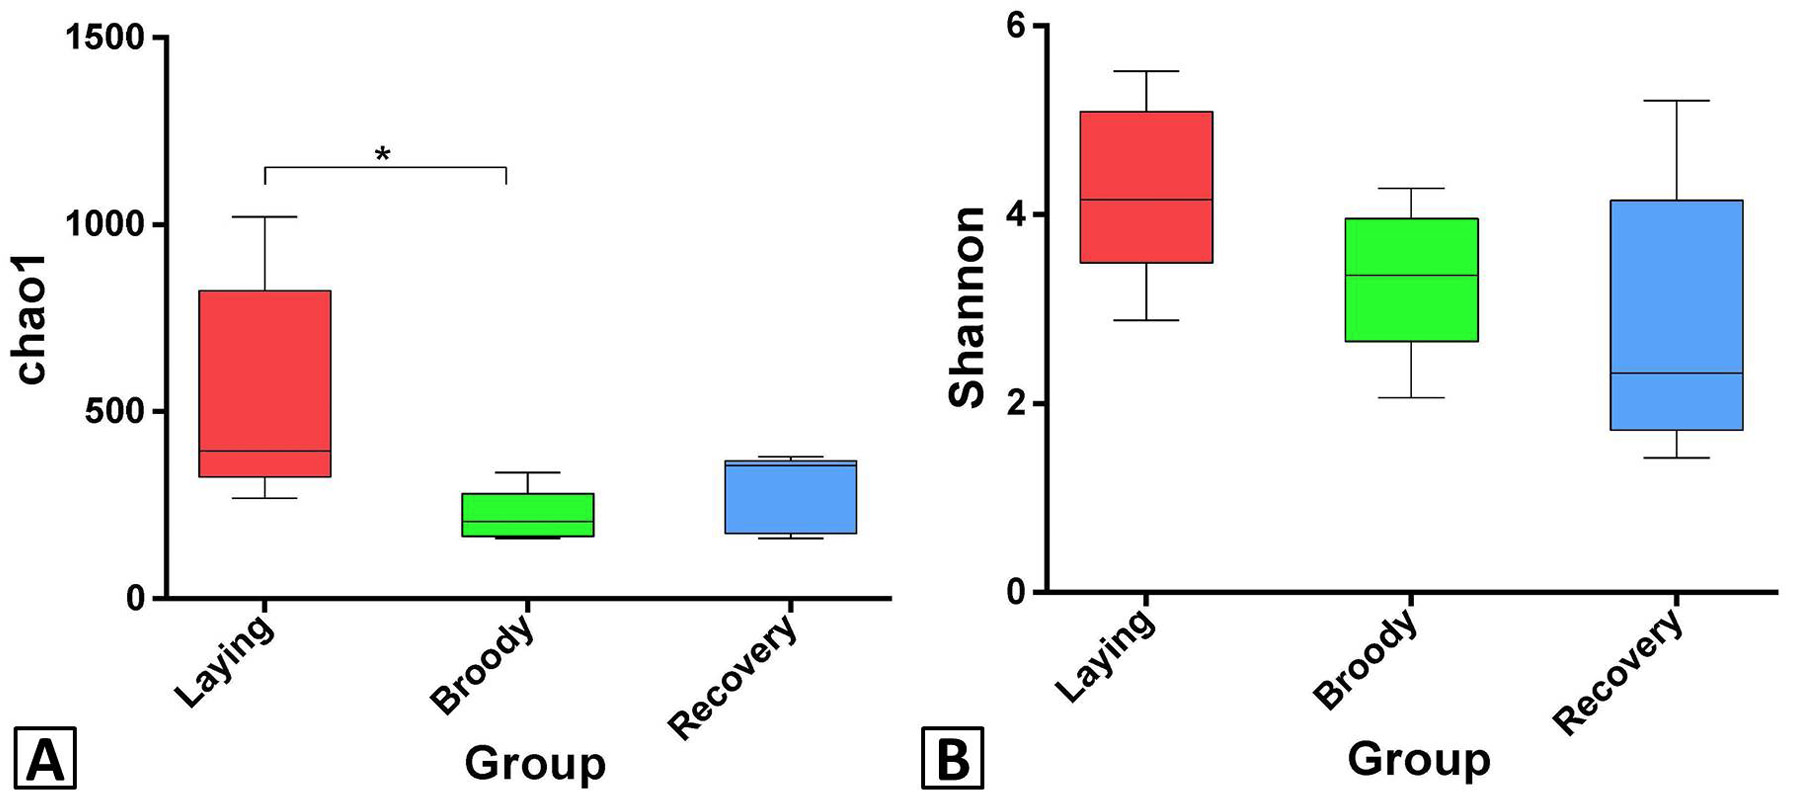
Differences in bacterial community richness and diversity among the three groups. Asterisk denote significant differences between groups. Significant differences are defined at the 95% confidence level. The Chao1 index of broody group was significantly lower than laying group; no significant difference was detected in Shannon index.
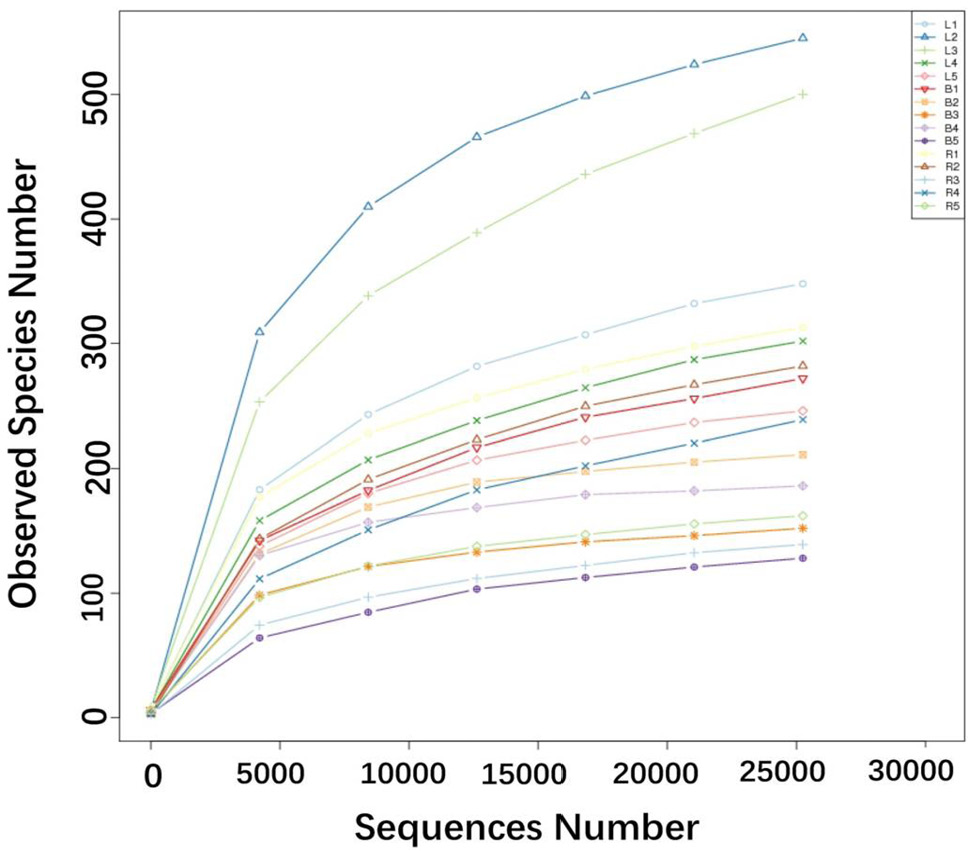
Rarefaction curves of the observed species indices for each sample. The x-coordinate represents the number of sequencing bars randomly extracted from one sample, and the y-coordinate represents the number of OTU constructed based on the sequences number, to reflect the sequencing depth. Different samples are represented by different color curves. Using a rarefaction depth of 25,252 sequences per sample, the number of OTUs have almost approached a plateau except two samples from the laying group, meaning the rationality of sequencing data.

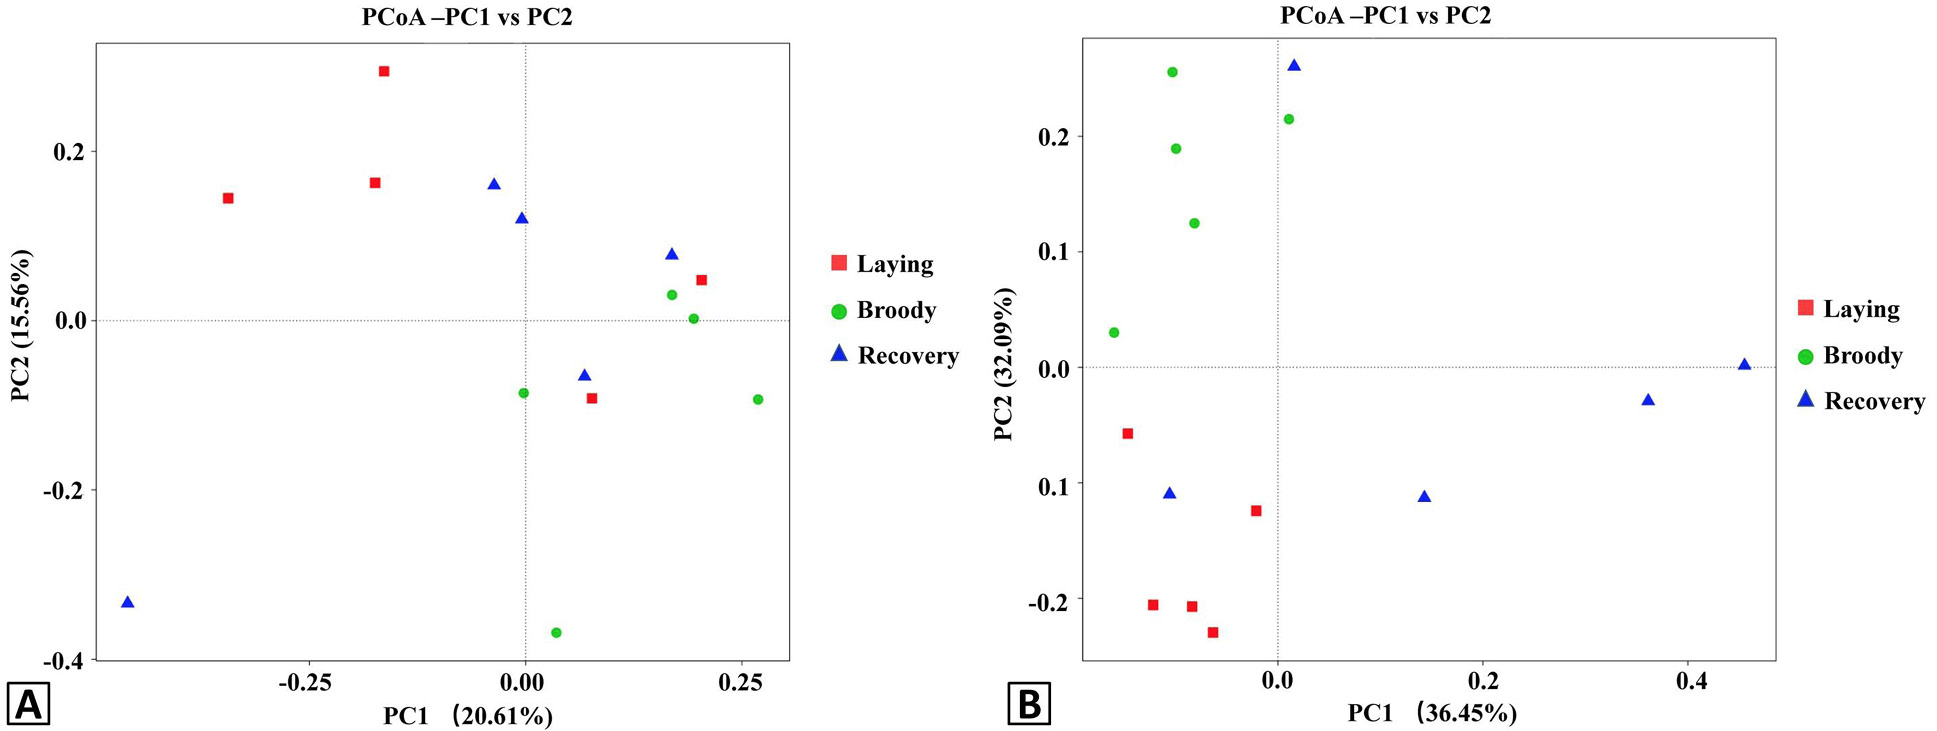
Principal Coordinate Analysis (PCoA) plots of the duodenal bacteria community structures of the three groups using unweight (A) and weight (B) UniFrac distance metrics. Red, green and blue colors represent the laying, broody and recovery samples, respectively. PC1 and PC2 represent two principal components, and the percentage represents the contribution of the principal component to the sample difference. Samples with high community structure similarity tend to cluster together, while samples with large community differences tend to be far apart.

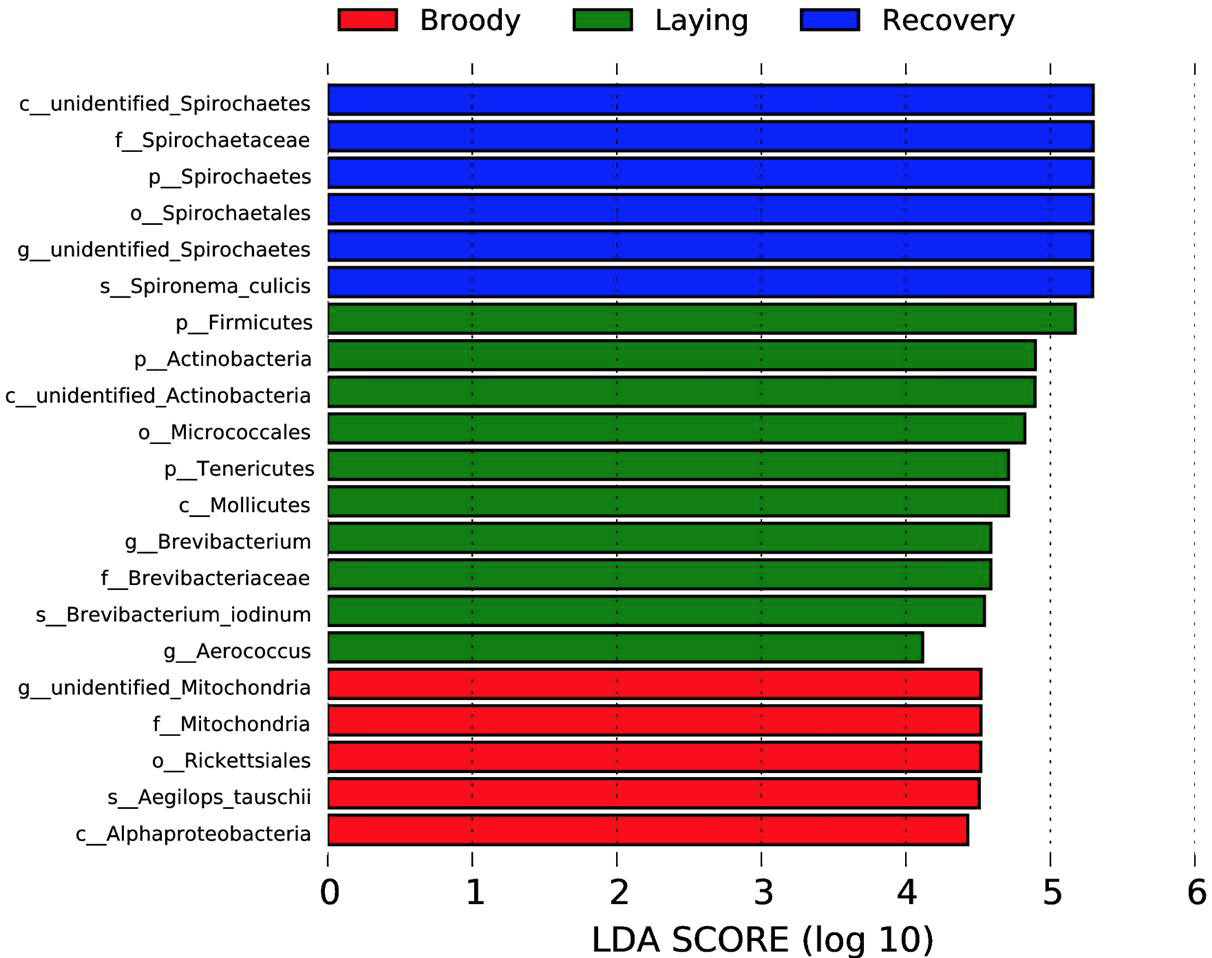
Bacterial taxa with significantly different abundance between groups were identified by linear discriminant analysis coupled with effect size (LEfSe) using the default parameters. Significantly different biomarkers (LDA score >4) are shown; the length of each bar represents the influence of each bacterial taxa.

Principal Coordinate Analysis (PCoA) plots of the duodenal bacteria community structures of the three groups using unweight (A) and weight (B) UniFrac distance metrics. Red, green and blue colors represent the laying, broody and recovery samples, respectively. PC1 and PC2 represent two principal components, and the percentage represents the contribution of the principal component to the sample difference. Samples with high community structure similarity tend to cluster together, while samples with large community differences tend to be far apart.

