

Comparative Analysis of Muscle Development in Zebrafish with Different Intermuscular-Bo nes Patterns


Comparative Analysis of Muscle Development in Zebrafish with Different Intermuscular-Bo nes Patterns
Jian Yang1, Guangxiang Tong2, Zhipeng Sun2, Xianhu Zheng2, Weihua Lv2, Dingchen Cao2, Xiaowen Sun2 and Youyi Kuang2*
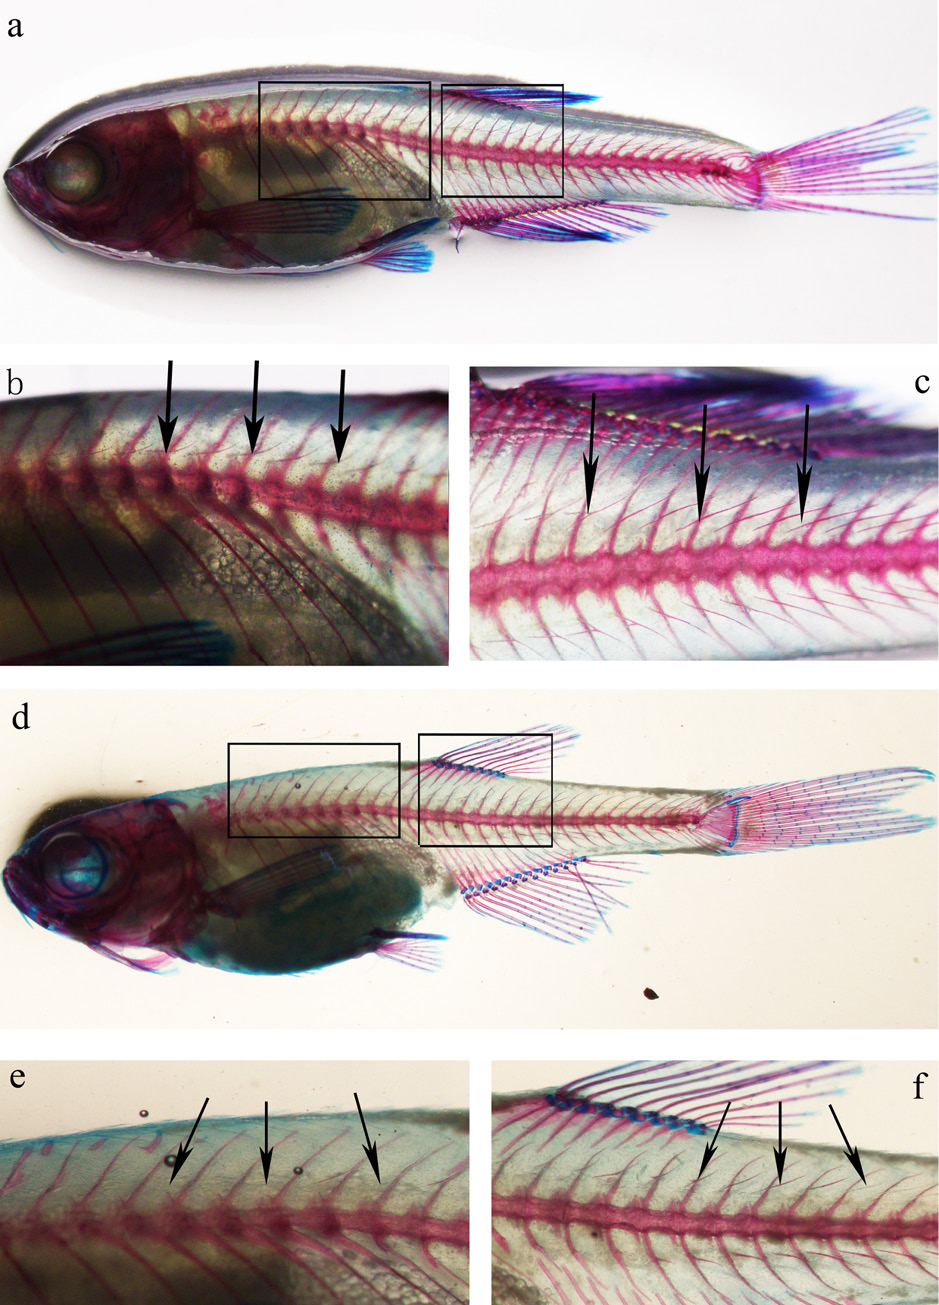
Whole-body bone-staining images of a WT fish (45dpf, body length= 17.77 mm) and of an imbs deletion mutant zebrafish (47dpf, body length= 19.28mm). a) Whole body bone staining of a WT zebrafish, b) an area anterior to the dorsal fin of the WT zebrafish, and c) an area posterior to the dorsal fin of the WT zebrafish (Arrowheads point at imbs). d) whole body bone staining of a mutant zebrafish with partial loss of imbs, e) an area anterior to the dorsal fin of the mutant zebrafish, and f) an area posterior to the dorsal fin of the same mutant zebrafish. In image e, imbs are completely missing in the area anterior to the dorsal fin of the mutant fish. In image f, imbs are still present but appear shorter compared to ones in the WT zebrafish as shown in b and c, respectively. Arrowhead indicated imbs.
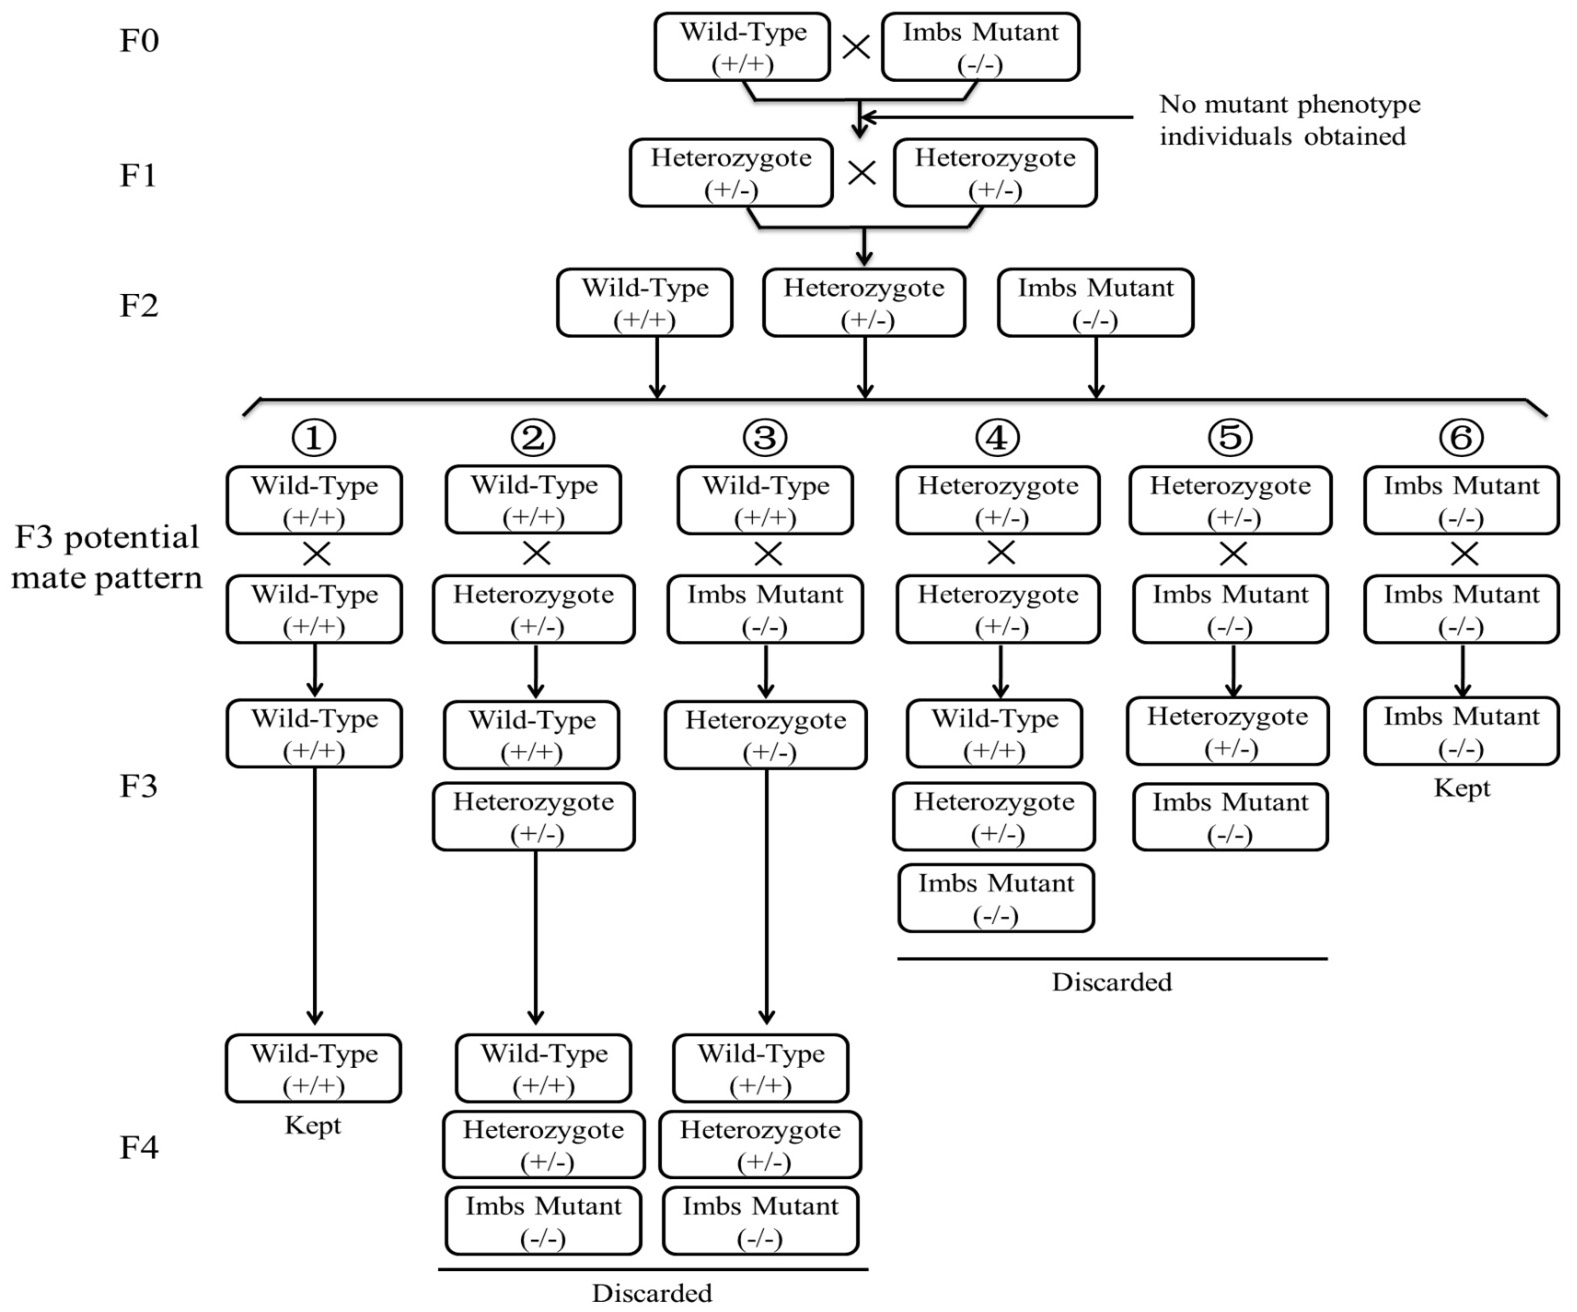
Screening of experimental zebrafish lineages. + and – represented wild-type allele and mutant allele, respectively; +/+ represented homozygous wild-type genotype; -/- represented homozygous mutant genotype; +/- represented heterozygous genotype, only individuals with homozygous mutant genotype (-/-) expressed the mutant phenotype, i.e. imb partial deletion. For avoiding the influence of the mutant allele to traits of individuals with heterozygous genotypes, only families with homozygous genotypes (+/+ or -/-) were chosen for this study.
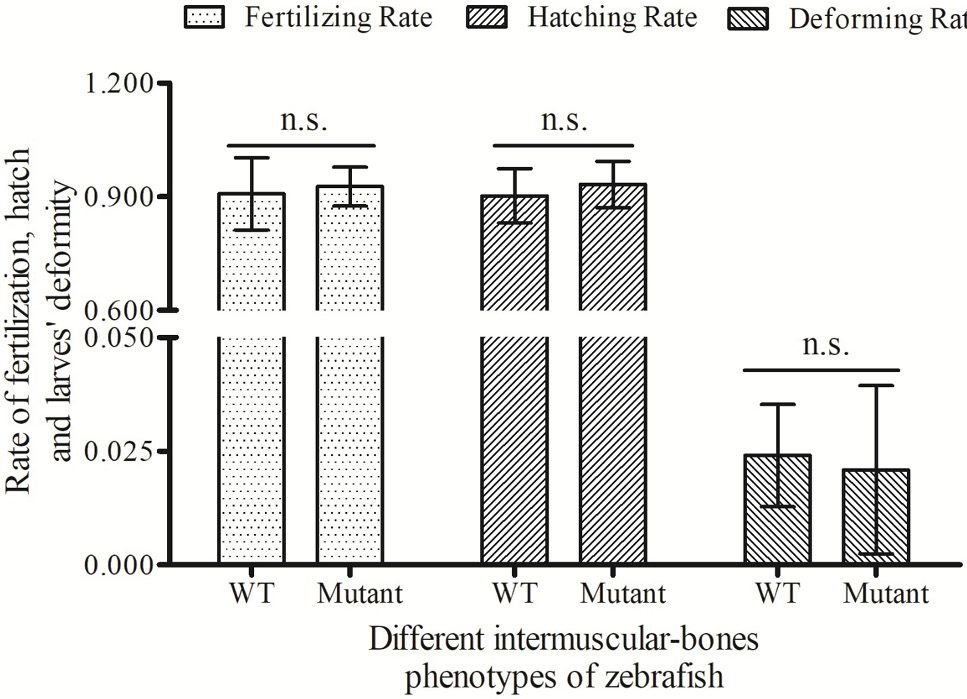
Comparisons on fertilized rate, hatched rate and deformed rate between wildtype zebrafish and lmbs deficient mutants. Fertility rate, hatched rate and deformed rate were presented as mean ± SD. n.s., no significance (P<0.001).

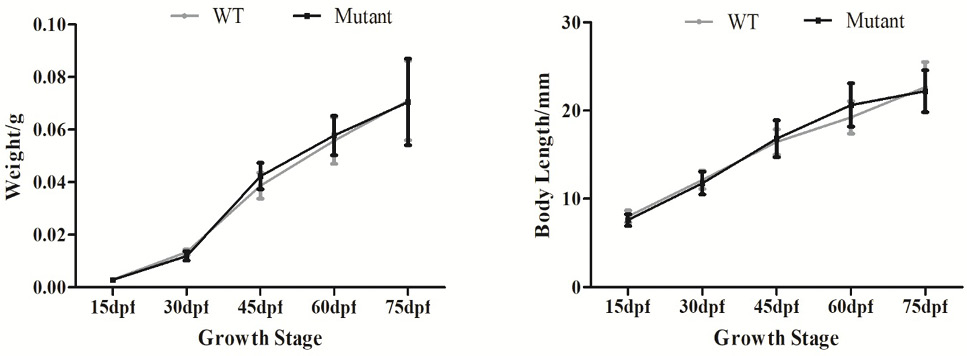
Growth curves of WT and imbs mutants at different development stages. Data are expressed as mean ± SD of body weight and length.
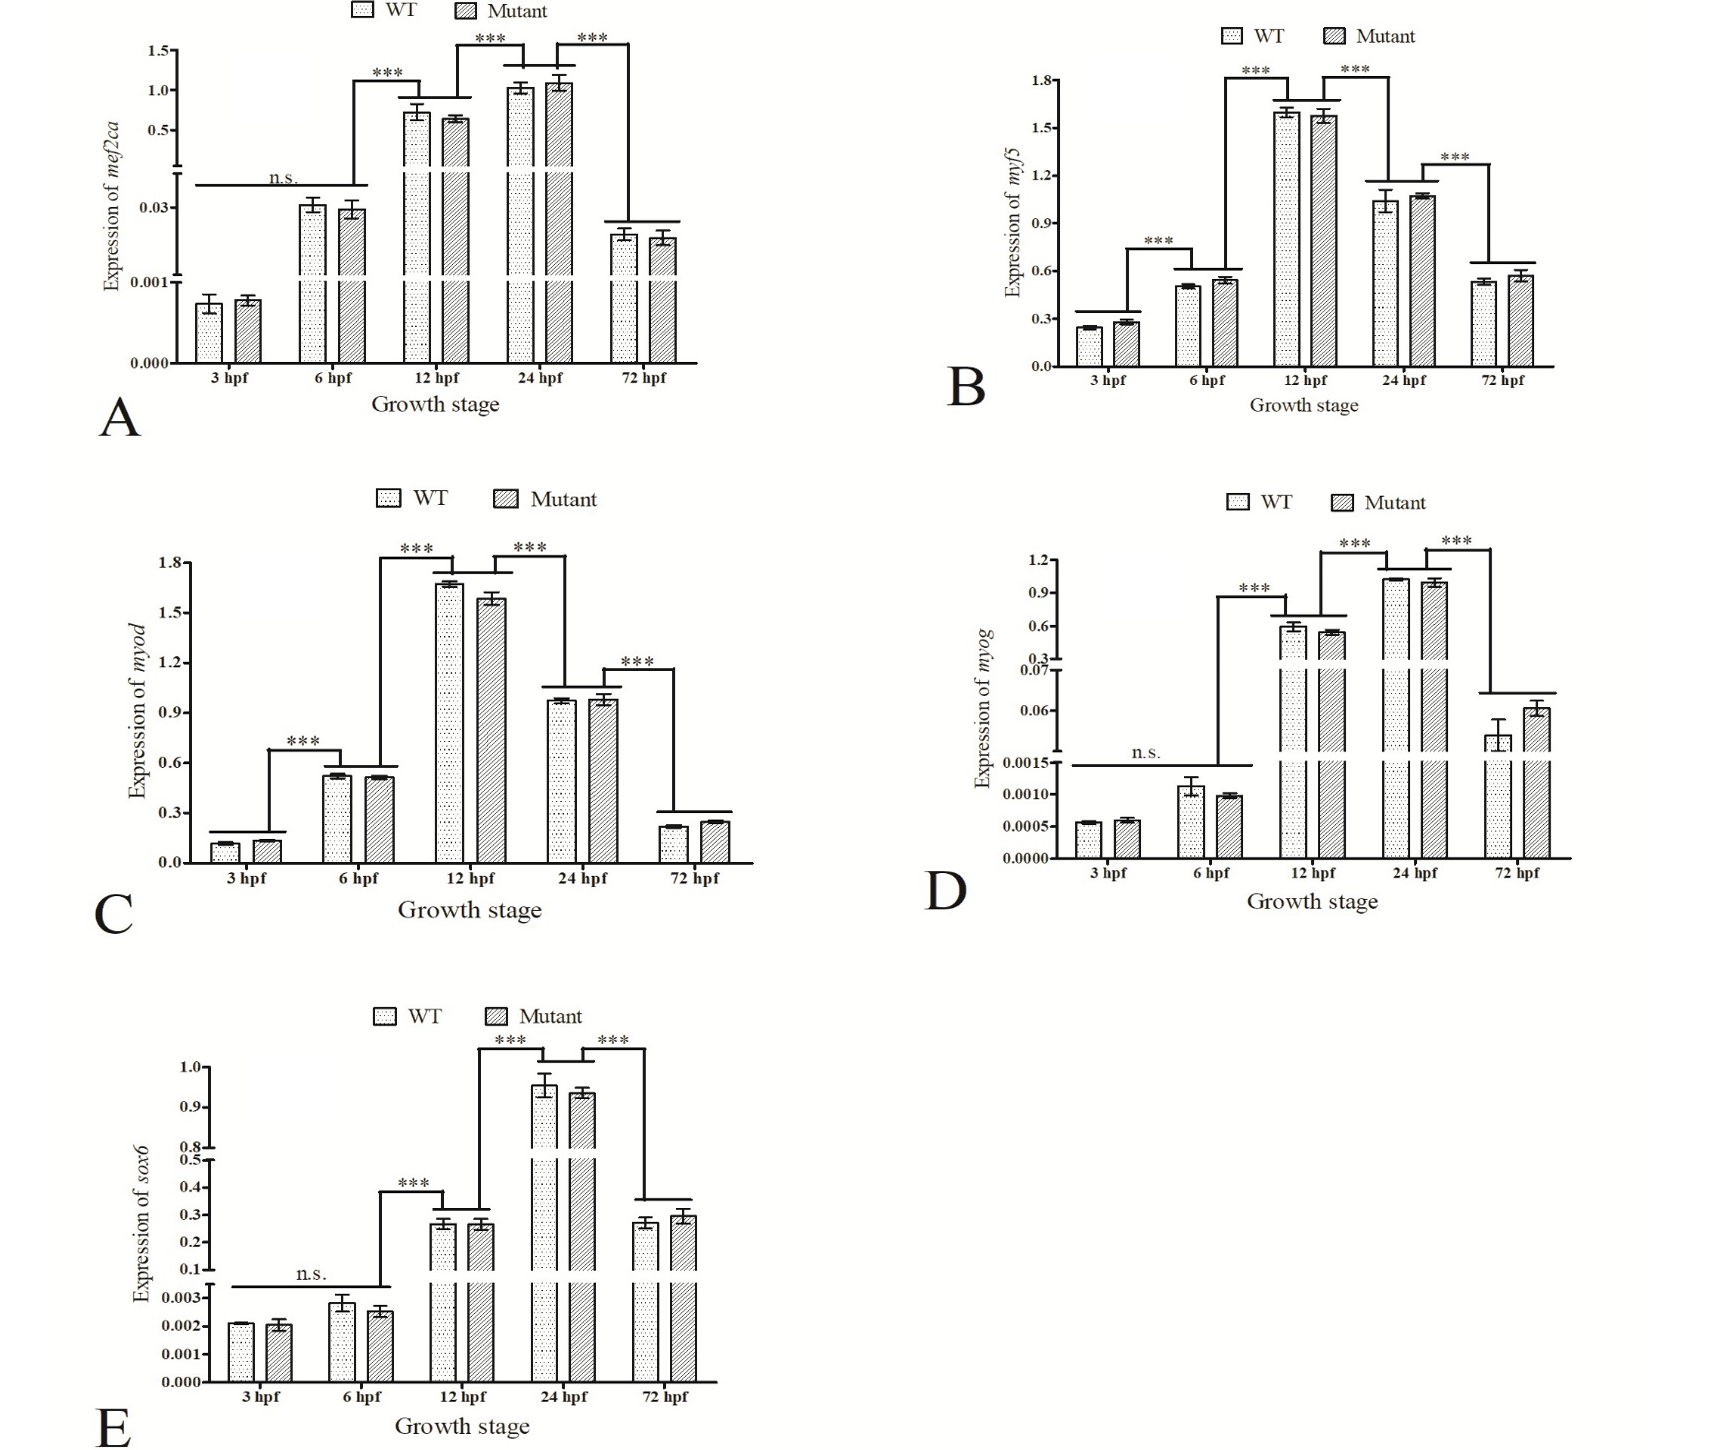
Expression of five muscle-specific genes in five embryonic development stages. The gene expression was normalized by expression of reference gene gapdh and represented using 2-△△CT. Data were expressed as mean ± SD of (n=3). ***, P<0.001; n.s. = no significance.

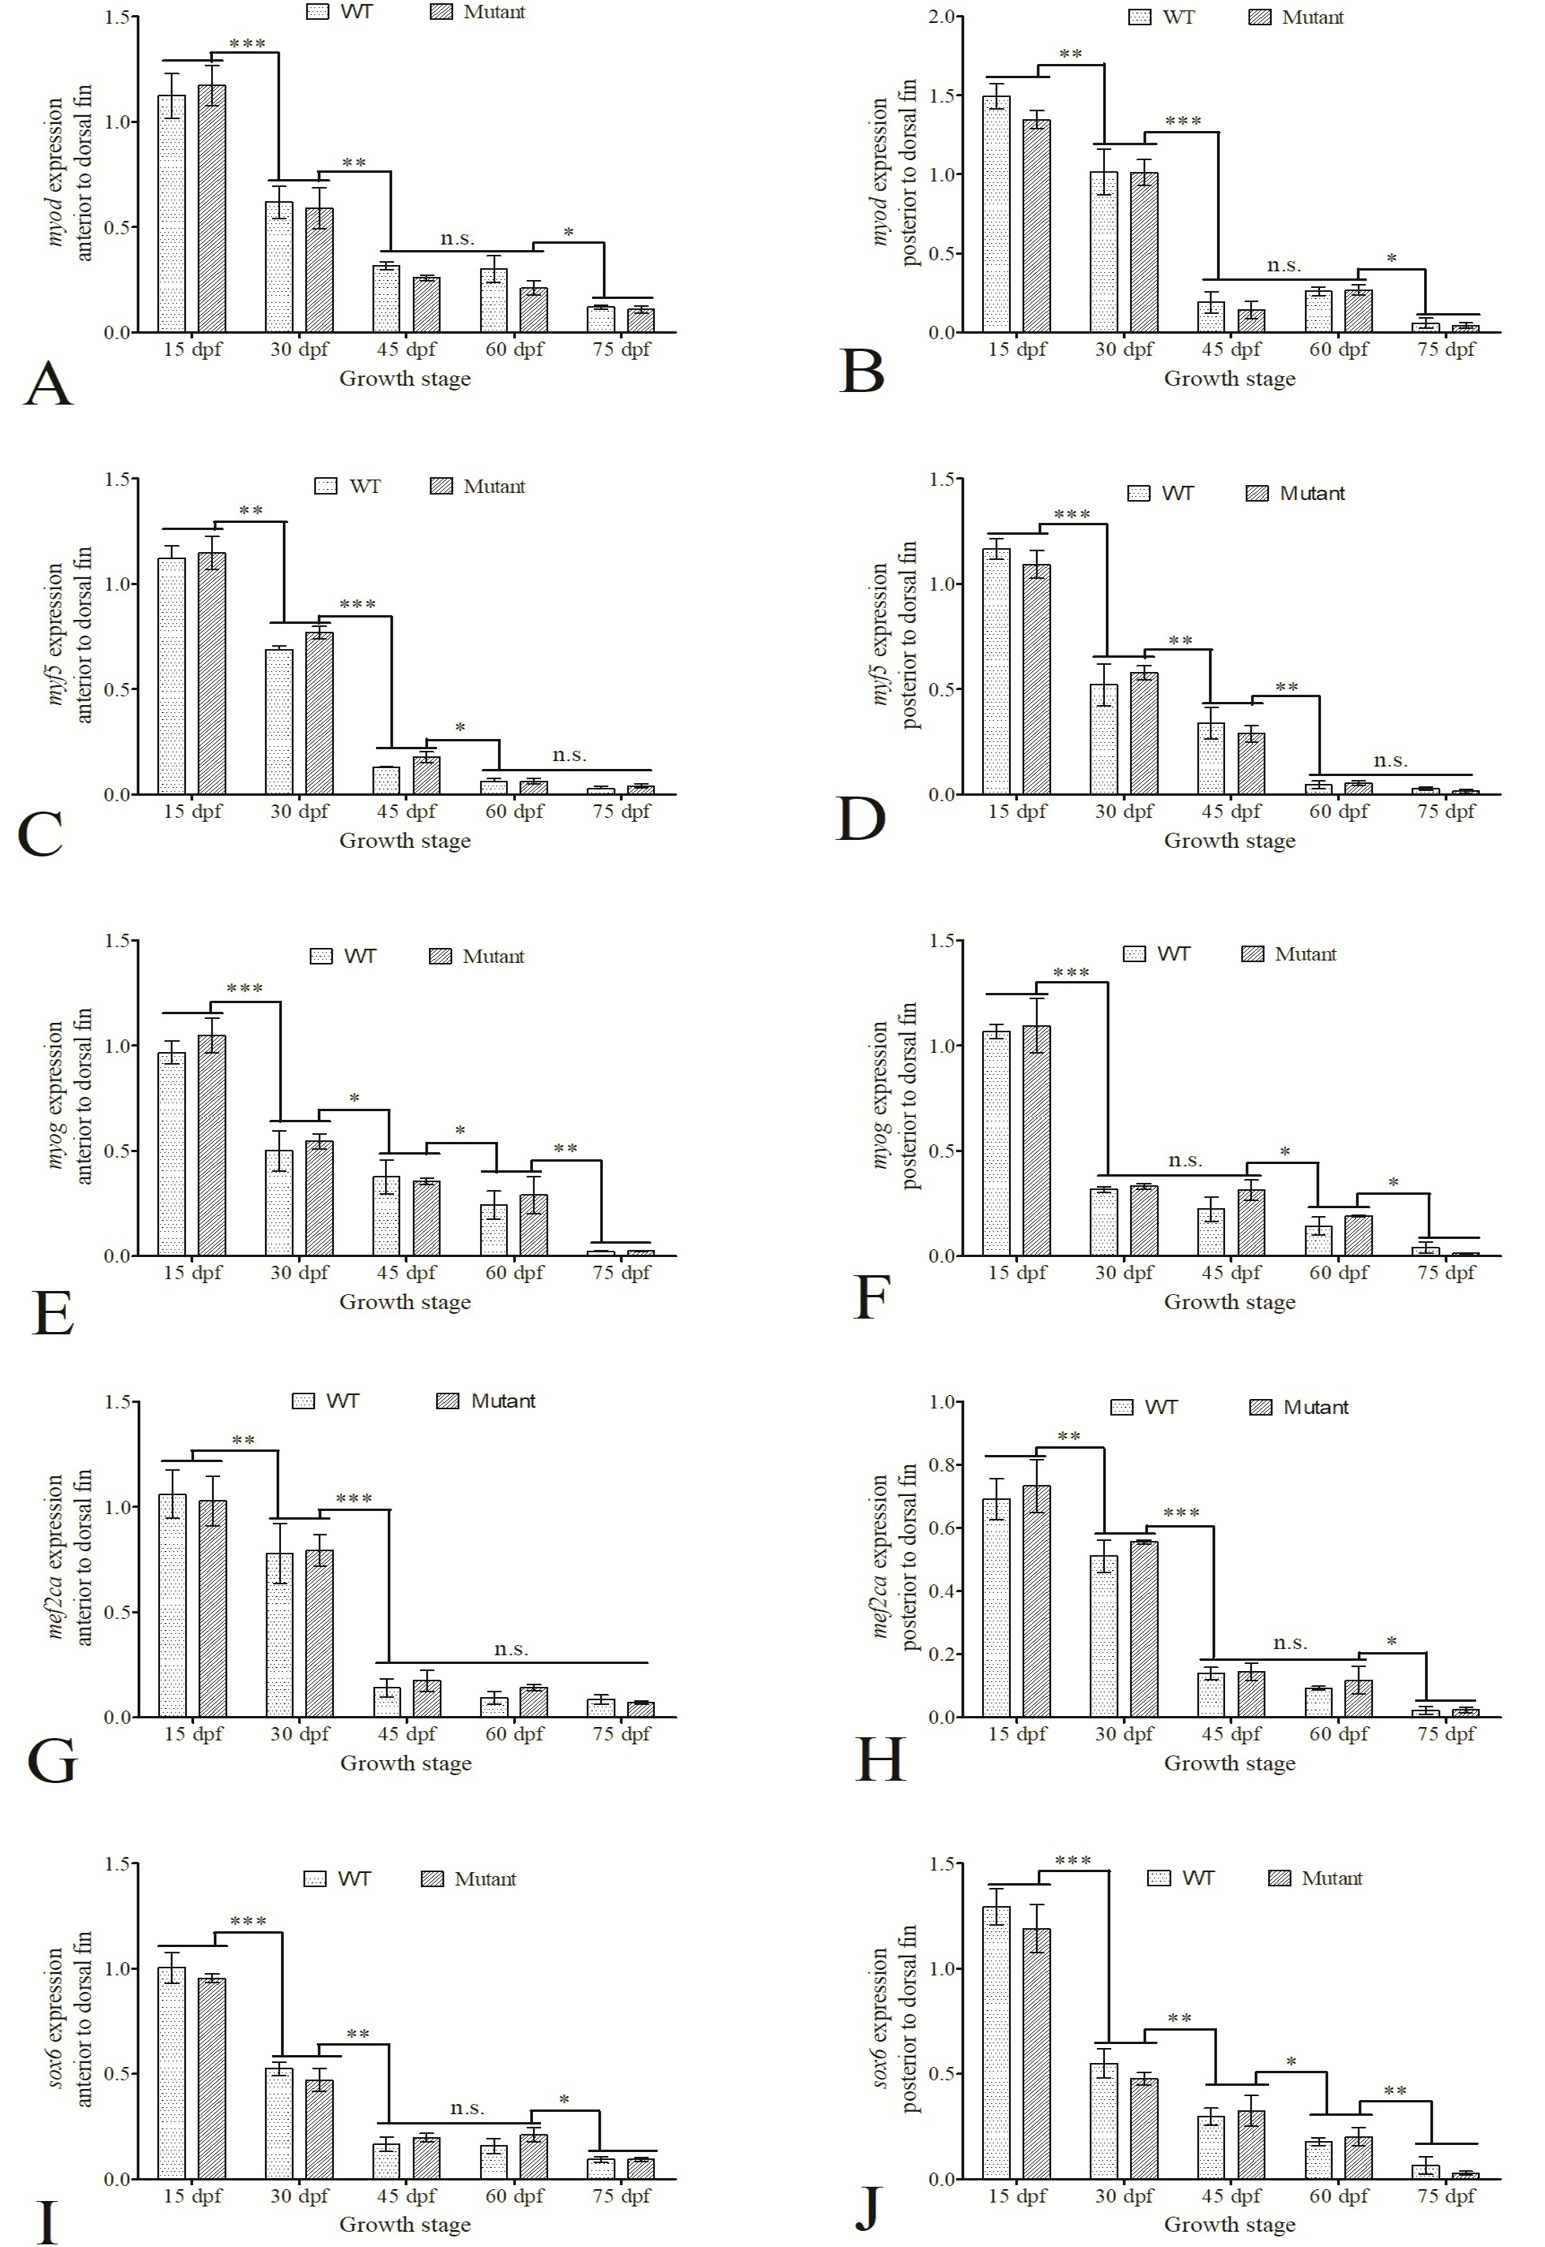
Expression of five muscle-specific genes in the anterior and posterior muscles to the dorsal fin in both WT and imbs mutant at five developmental stages. A, C, E, G and I represented the expression of myod, myf5, myog, mef2ca and sox6 in the anterior muscles of the dorsal fin at the five stages (15 dpf, 30 dpf, 45 dpf, 60 dpf and 75 dpf), respectively. B, D, F, H and J showed the expression of the five muscle-specific genes in the posterior muscles of the dorsal fin at five different stages. The gene expression was normalized to the expression level of the reference gene gapdh. Data are expressed as mean ± SD of 2-△△CT (n=3). *, P<0.05; **, P<0.01; ***, P<0.001; n.s., no significance.

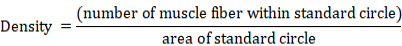
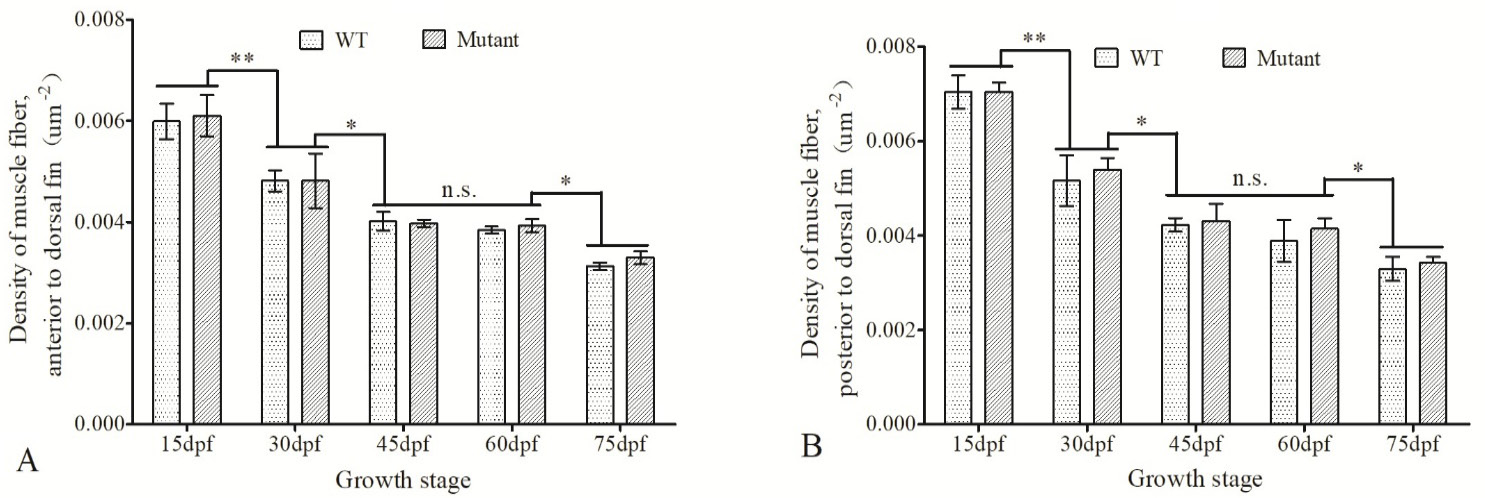
Density of muscle fibers in the anterior and posterior muscle to the dorsal fin in WT and imbs mutant zebrafish at different developmental stages. The density of the anterior muscles to (i) and posterior muscles(ii) to the dorsal fin in WT and imbs mutant fish were measured at 15 dpf, 30 dpf, 45 dpf, 60 dpf and 75 dpf, data were expressed as mean ± SD of density of muscle fiber. *, P<0.05; **, P<0.01; n.s., no significance.

