

Construction and Evaluation of Novel Plasmid DNA Encoding Somatostatin Fused to a Tissue Plasminogen Activator (tPA) in Mice


Construction and Evaluation of Novel Plasmid DNA Encoding Somatostatin Fused to a Tissue Plasminogen Activator (tPA) in Mice
Fangxiao Dong1,2, Xuan Luo1,2, Delu Yuan1,2, Aixin Liang1,2* and Liguo Yang1,2*

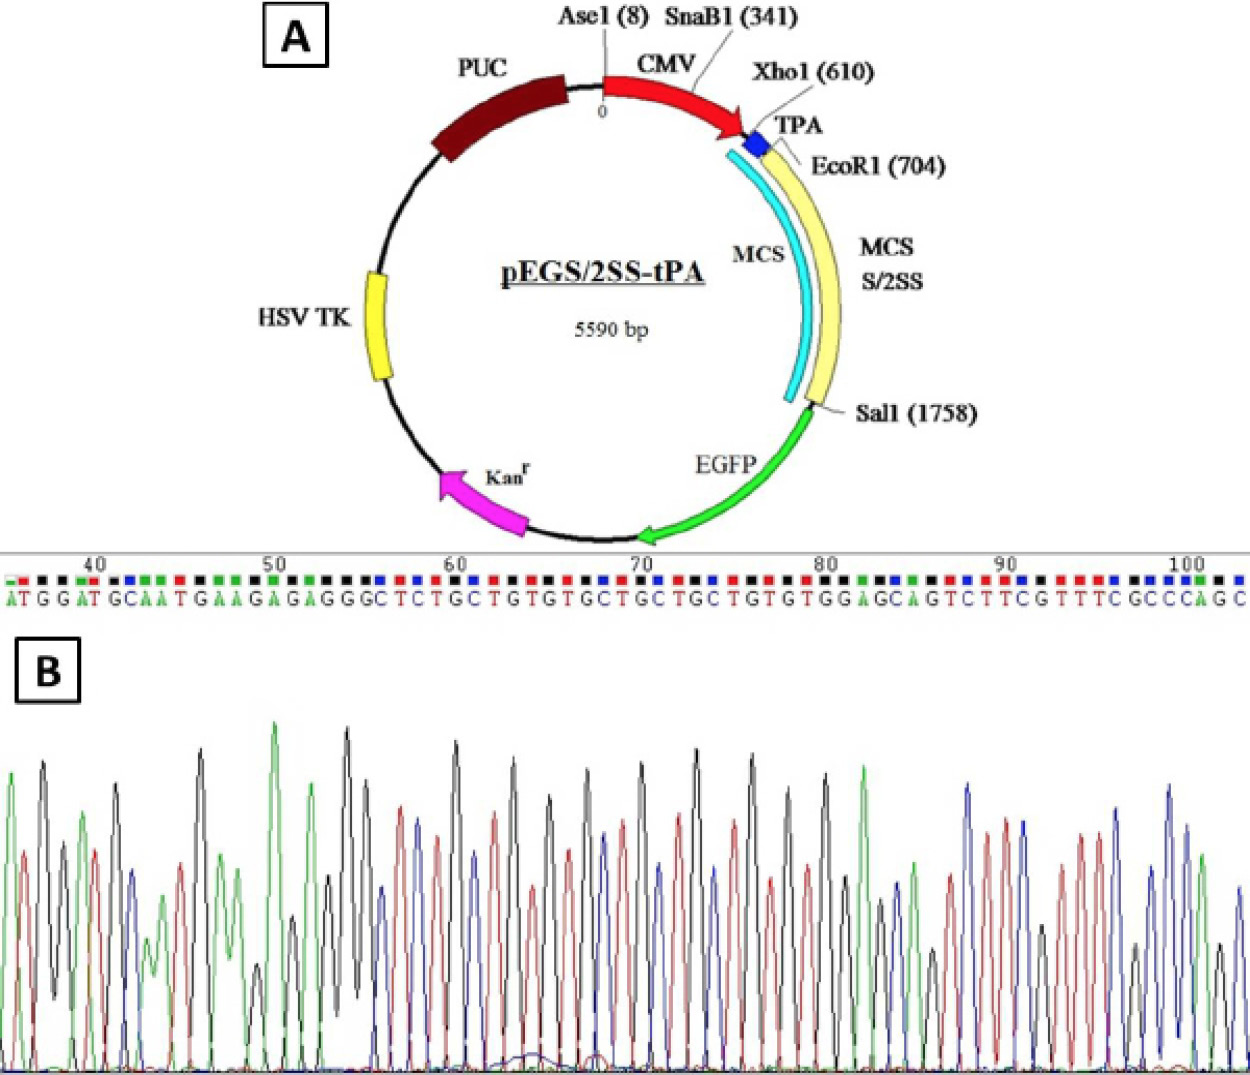
Construction of plasmid pEGS/2SS-tPA. The sequence of tissue plasminogen activator signal peptide (tPA) was inserted into previous somatostatin DNA vaccine (pEGS/2SS). A, the plasmid profile of pEGS/2SS-tPA; B, The sequencing analysis of pEGS/2SS-tPA.
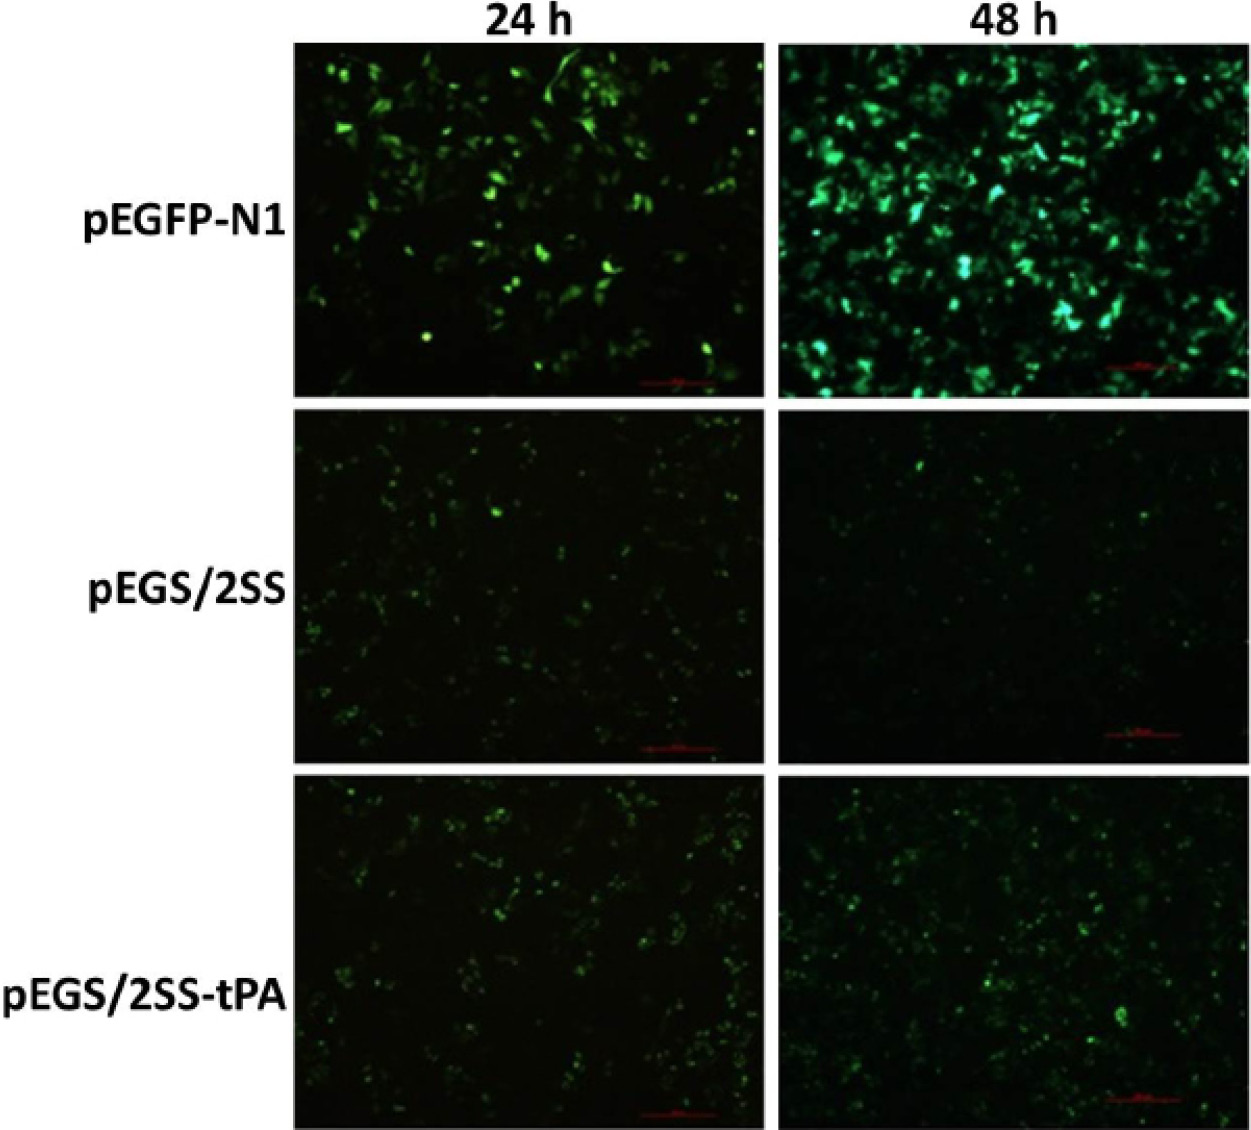
Expression and distribution of green fluorescent in MCF-7 cells at 24 h and 48 h after transfection. Scale bar = 200μm.
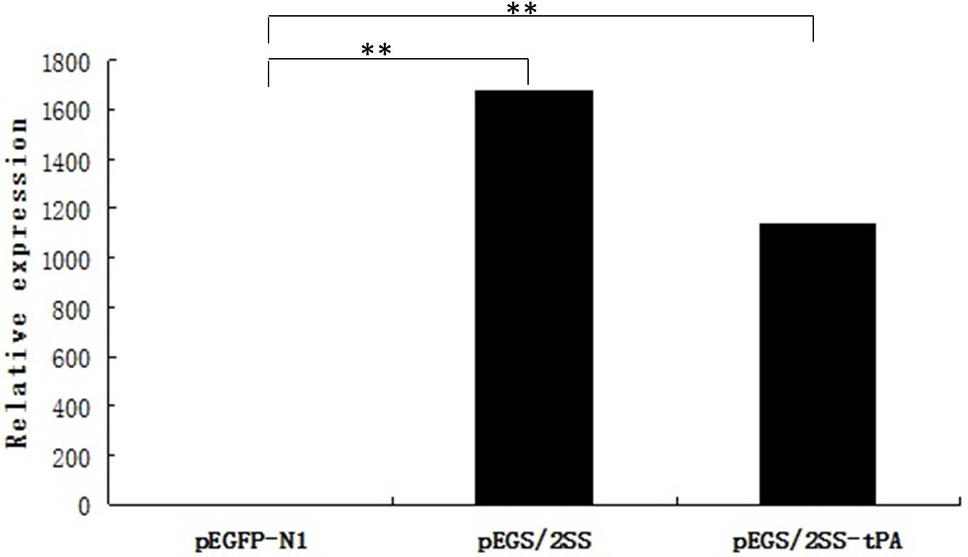
Relative expression of SS mRNA by real-time PCR. The Ct value of SS was normalized to that of GAPDH, and the SS expression level in cells transfected with pEGS/2SS-tPA or pEGS/2SS was calculated relative to cells transfected with pEGFP-N1. **P<0.01.
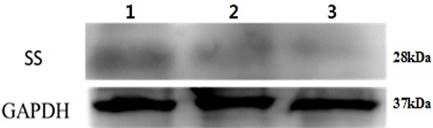
S/2SS fusion protein detection in cell supernatants by Western blot. Lane 1, cells transfected with pEGS/2SS-tPA; Lane 2, cells transfected with pEGS/2SS; Lane 3, cells transfected with negative control pEGFP-N1. GAPDH protein was selected as the standardized correction of S/2SS fusion protein expression quantity.
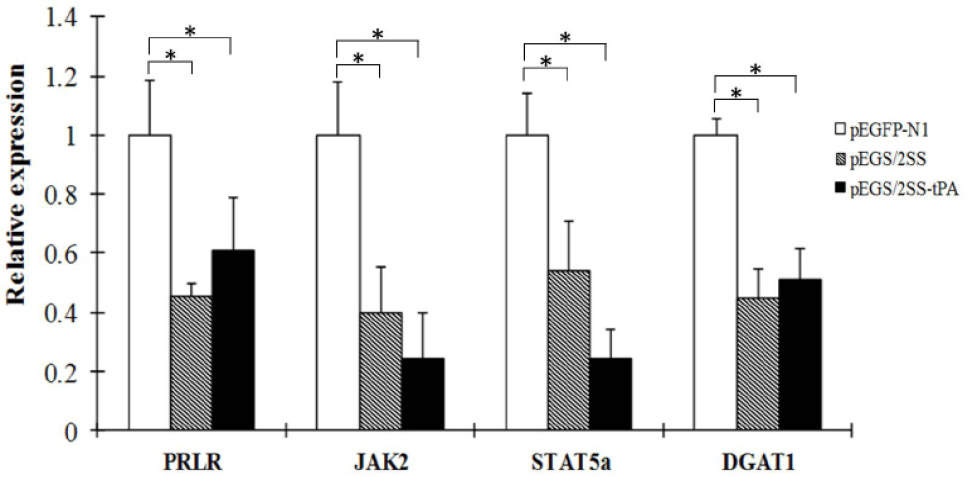
Relative expression of PRLR, JAK2, STAT5a and DGAT1 by Real-time PCR. The Ct value of SS was normalized to that of GAPDH, and the expression level of targets genes in cells transfected with pEGS/2SS-tPA or pEGS/2SS was calculated relative to cells transfected with pEGFP-N1. *P<0.05.

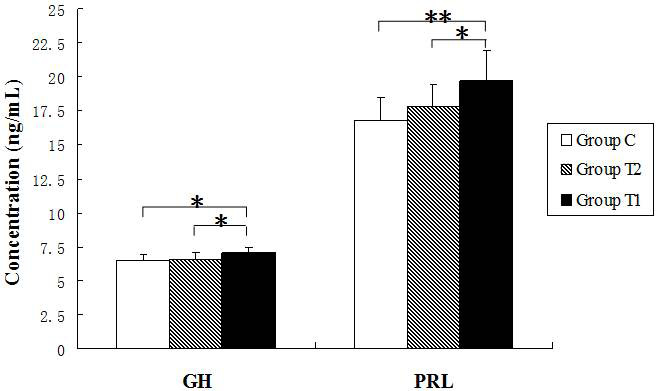
Serum GH concentration (ng/mL) and serum PRL concentration (ng/mL) in T1, T2 and C groups vaccinated with pEGS/2SS-tPA, pEGS/2SS and pEGFP-N1 at 8 week after immunization. *P<0.05 and **P<0.01.


