Determinants of Farm Households Savings in District Kohat, KP, Pakistan


Research Article
Determinants of Farm Households Savings in District Kohat, KP, Pakistan
Malik Muhammad Shafi, Rabia Habib and Haidar Ali*
Institute of Development Studies, Faculty of Rural Social Sciences, The University of Agriculture, Peshawar, KP, Pakistan.
Abstract | For exploring key factors affecting farmers’ savings the study was designed in district Kohat (KP, Pakistan). For the purpose of data collection, interview schedule and direct observation was used as a research tools. Through random sampling technique, a sample size of 90 households from 452 farm households were taken. Total consumption expenditures, total income, and land size were the variables which showed significant results. Because their overall p-values indicates significant results at 5% significant value. Results of these variables revealed a positive relationship between household (farmers) savings and total income with coefficient 0.332143 and P-value 0.00*** and land size with coefficient 1823.08 and P-value 0.000*** in the study area. On other hand, total consumption expenditures with coefficient -0.472555 and P-value 0.00*** had a negative association with household savings in the research area. Furthermore, 56% of the farmers having household savings between the ranges of 5,000 to 9,999, PKR while 25% of farmers had household saving from zero to 4,999, PKR. Similarly, the highest 78% of sampled farmers were earning above and 49,999 PKR followed by the farmers (15%) with income from 40,000 to 49,999 PKR. According to this study, small farmers can increase their savings through the provision of off-farm opportunities. To minimizing the expenditures, the small farmers can used better household budget management technique to increase their savings.
Received | January 21, 2021; Accepted | July 09, 2021; Published | November 24, 2021
*Correspondence | Haidar Ali, Institute of Development Studies, Faculty of Rural social sciences, The University of Agriculture, Peshawar, Khyber Pakhtunkhwa, Pakistan; Email: haiderkpk59@gmail.com
Citation | Shafi, M.M., R. Habib and H. Ali. 2022. Determinants of farm households savings in District Kohat, KP, Pakistan. Sarhad Journal of Agriculture, 38(1): 110-116.
DOI | https://dx.doi.org/10.17582/journal.sja/2022/38.1.110.116
Keywords | Household savings, Income, Multiple regression model, Total consumption and expenditures
Introduction
The difference between consumption and household income is called savings. In hard times savings are used or during contingencies for smoothening to consume; thus, individuals normally save to finance their future expenditures (Abid and Afridi, 2016). According to Bratta (2014), income is the main source of savings. Income sources include salaries, profits business, corporate, interest payments, and earnings from farm production, etc. Consumption is the total amount of good and service which are consumed by household during a year. There are numerous consumptions heads including expenditure on housing, food, education, health, utilities, traveling, events and ceremonies, leisure and charities, etc. In many countries household savings has a great effect on aggregate national savings. Savings ratio in the high-income countries range from 15% to 20% and individual savings account is from 10% to 15%. In Asian countries, the domestic saving ratio laying from 25% to 30%, and household savings account lays from 20 to 25 percent. The household sector contributes a great amount of the total saving for high-income countries which play a vital role in economic growth.
Table 1a shows the Pakistan GDP (Gross Domestic Product) Growth Rate from 2015 to 2019. In 2019, the agriculture sector contributed around 22.04% to the GDP of Pakistan, 18.34% came from the industry, and over half of the economy’s contribution to GDP came from the services sector.
Table 1a: Pakistan GDP Growth Rate from 2015 to 2019.
|
Year |
GDP Growth (%) |
Annual Change |
|
2019 |
0.99% |
-4.85% |
|
2018 |
5.84% |
0.28% |
|
2017 |
5.55% |
0.03% |
|
2016 |
5.53% |
0.80% |
|
2015 |
4.73% |
0.06% |
Agriculture sector is dominated by small farmers in Pakistan, 93% of the entire farmers have their place in the group of small farmers. These farmers facingvarious problems such as lack of inputs, price instability, haggling power, and altering management strategies. Due to low income and savings, small farmers are stuck in the vicious cycle of poverty, exit them in a weak position to invest in their agricultural activities. The proposed study in hand is planned to identify the impact of those factors which has affecting saving directly or indirectly of these small farmers in district Kohat, Khyber Pakhtunkhwa.
Objective of the study
To examine the factors i.e. (age, academic qualification, food consumption expenditures, health expenditures, income of the farmers, non-food expenditures, number of dependent members, and land size) affecting farmers’ savings in district Kohat, Khyber Pakhtunkhwa.
Materials and Methods
For the present research, universe of the study is district Kohat. The reason for the selection of district Kohat was manifold. Firstly, most of the agriculture activities are carried out in this district. Secondly, as researcher belongs to this district so, access to households for data collection was easy. For the present study, three villages namely Jungle khel, Nasrat khel and Malang abad from district Kohat were randomly selected. Through the proportional allocation sampling technique, a sample size of 90 households were randomly taken from the aforementioned villages. Due to limited time and financial constraints, a 20 % sample size was fixed. Through the interview schedule, primary data were collected while secondary data were also used for review purposes. Household head was a unit of analysis for the present research (Table 1b).
Table 1b: Selection of the sampled respondents in the study area.
|
Villages |
No. of farmers |
Sample size |
|
Jungle khel |
157 |
32 |
|
Nasrat khel |
199 |
39 |
|
Malang abad |
96 |
19 |
|
All |
452 |
90 |
Source: Data from respective Patwari circle of the research area, 2017.
Models selection and specification
The Ordinary Least-Square (OLS) model was used in the present study. In the Ordinary Least-Square (OLS) analysis the magnitude of an independent variable is not only affected by the dependent variable but also gives more accurate and reliable results. Along with this OLS technique also have the features of its blue properties (Gujrati, 2004). In order to achieve the objectives set for this study, a multiple linear regression model was used.
Model for identifying determinants of saving of small farmers
In the light of literature review and preliminary discussion with farm households, major determinants of saving in the study area to be tested were; age, academic qualification, food consumption expenditures, health expenditures, income of the farmer, non-food expenditures, number of dependent members, and land size. Following Hazell (2015) and Rehman et al. (2010), the following multiple regression model was used.
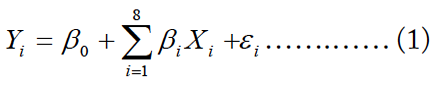
Whereas;
β0: intercept or constant term; β1 to β8: coefficients of regression; Yi: Represent saving of farmers both from farm and off-farm resources (Rs/ year); X1i: Age of farm household head i (in years); X2i: Academic qualification i (years of schooling); X3i: Food consumption expenditures of household i (Rs/Year); X4i: Health expenditures of households (Rs/Year); X5i: Non-Food expenditures of household i (Rs/Year); X6i: Income of farmer (Rs/Year); X7i: Number of dependent members i (number); X8i: Land size (acre); ɛi: Error term.
Results and Discussion
The households were classified into 4 age groups i.e., 20-29, 30-39, 40-49, and above 49 as shown in Table 1c. Majority (80%) of the sample small farmers were falling in the age group of 40-49 followed by age group 30-39 (11%) and age group 20-29 (9%) in district Kohat, respectively. it means that the farmers belonging to age group 40-49 were involved in farming activities while young people were absent from performing farming activities. It may the availability of more off-farm jobs and accessibility to other jobs for young people. The results are in line with the findings of Abid and Afridi (2016).
Table 1c: Age wise distribution of sampled farmers.
|
Age group |
Jungle khel |
Nasrat khel |
Malang abad |
Total |
Percentage |
|
20-29 |
4 |
2 |
2 |
8 |
9 |
|
30-39 |
5 |
3 |
2 |
10 |
11 |
|
40-49 |
23 |
34 |
15 |
72 |
80 |
|
Above 49 |
- |
- |
- |
- |
- |
|
Total |
32 |
39 |
19 |
90 |
100 |
Source: Field Survey, 2017.
In Table 2 on the basis of educational level, farmers were categorized into 5 groups i.e., primary level, middle level, matric level, inter and bachelor level. Results in Table 2 describe that among the sample small farmers majority (54.55%) had got education up to middle followed by 19.70%, 16.67%, 7.58%, and 1.52% were having matric level, primary level, inter-level and bachelor level education, respectively. From the above it is concluded that an educated farmer can run various farm activities in a better way as compared to the uneducated farmer, they can learn easily about new technologies and have more information about marketing situation. If a farmer is educated he can earn and save more. The results are more or less similar to the findings of Adams and Pischkel (2015).
Table 3 shows that maximum (60%) of farmers have a family size from 6 to 10 members while 40% of farmers have a family size from 1 to 5 members. Household size (Family size) has a significant impact on saving i.e., if the household size is large it will be difficult to save more and vice versa. A farmer having a small household size can save more as compared to a large family size.
Table 2: Educational level of sampled farmers.
|
Level of Education |
Jungle khel |
Nasrat khel |
Malang abad |
Total No. |
Percentage |
|
Primary |
3 |
7 |
1 |
11 |
16.67 |
|
Middle |
13 |
10 |
13 |
36 |
54.55 |
|
Matric |
9 |
4 |
0 |
13 |
19.70 |
|
Inter |
2 |
2 |
1 |
5 |
7.58 |
|
Bachelor |
1 |
0 |
0 |
1 |
1.52 |
|
Total |
28 |
23 |
15 |
66 |
100.00 |
Source: Field Survey, 2017.
Table 3: Household size of sampled farmers.
|
Family size |
Jungle khel |
Nasrat khel |
Malang abad |
Total |
Percentage |
|
1-5 |
15 |
15 |
6 |
36 |
40 |
|
6-10 |
17 |
24 |
13 |
54 |
60 |
|
Total |
32 |
39 |
19 |
90 |
100 |
Source: Field Survey, 2017.
Table 4: Distribution of landholding of sampled respondents.
|
Land Holdings |
Jungle khel |
Nasrat khel |
Malang abad |
Total |
Percentage |
|
Small farmers |
31 |
39 |
19 |
89 |
98 |
|
Large farmers |
1 |
0 |
0 |
01 |
02 |
|
Total |
32 |
39 |
19 |
90 |
100 |
Source: Field Survey, 2017.
Table 4 shows that the majority (98%) of the sampled respondents were small farmers while on other hand only 2% was belonging to the large farmer category. Land is the main source of production and farmer’s income. Farmers were categorized in two groups in the research area, i.e. small farmers and large farmers. Small farmers are those who hold less than 10-acre land and large farmers are those who hold 10 or above 10-acre land (Kohat Revenue Department, 2017). Large farmers having 10 or above 10-acre land can save more as compared to small farmers.
To determining household saving, income is an important factor as high income leads to high saving. In Table 5 income level of the farmers were categorized into 4 groups i.e. 20,000 – 29,999 PKR, 30,000 – 39,999 PKR, 40,000 – 49,999 PKR and above 49,999 PKR. Highest percentage (78 percent) of sampled farmers were falling in the income group of above and 49,999 PKR followed by income group (15 percent) from 40,000 to 49,999 PKR, income group (5 percent) from 30,000 to 39,000 PKR, and income group (2 percent) from 20,000 to 29,999 PKR, respectively in the research area. Farmers with a high income in the research area are saving more money as compared to the farmers with a low income. It may be due to more education, more family members’ earner, land size, more experience and accessibility to the nearest market. The results are in line with the findings of Hazell (2015).
Table 5: Income level of sampled farmers.
|
Income level |
Jungle khel |
Nasrat khel |
Malang abad |
Total |
Percentage |
|
20,000- 29,999 |
0 |
1 |
0 |
1 |
2 |
|
30,000- 39,999 |
1 |
3 |
0 |
4 |
5 |
|
40,000- 49,999 |
3 |
3 |
7 |
13 |
15 |
|
Above 49,999 |
28 |
32 |
12 |
72 |
78 |
|
Total |
32 |
39 |
19 |
90 |
100 |
Table 6: Monthly saving of sampled farmers.
|
Household saving (PKR) |
Jungle khel |
Nasrat khel |
Malang abad |
Total |
Percentage |
|
0-4,999 |
0 |
18 |
5 |
23 |
25 |
|
5,000- 9,999 |
28 |
12 |
11 |
51 |
56 |
|
10,000- 14,999 |
2 |
3 |
1 |
06 |
7 |
|
15,000- 19,999 |
0 |
1 |
0 |
01 |
2 |
|
Above 19,999 |
2 |
5 |
2 |
09 |
10 |
|
Total |
32 |
39 |
19 |
90 |
100 |
Source: Field Survey 2017.
Table 6 illustrates the monthly savings of sampled farmers. Highest (56 percent) farmers were having household saving between the range of 5,000 to 9,999, PKR while 25 percent of farmers were having household saving from zero to 4,999, PKR. Similarly, from the remaining 10 percent, farmers were having household saving above 19,999, PKR followed by 7 percent from 10,000 to 14,999, PKR and 2 percent from 15,000 to 19,999, PKR, respectively. From the above results it is concluded that saving of farmers in the study area was affected by some variables such as less farming experience, larger family size, low education level, low-income level, less land size, etc. These are the main hurdles which restrict farmers from saving more. The above results are in line with the findings conducted by Hazell (2015).
Test for multicollinearity
According to the basic assumption of OLS estimation, the independent variables would not be correlated with each other. If this assumption is violated, then there exists the problem of multi-collinearity. A diagnostic test VIF (variance inflation factor) is applied for identifying the existence of a multi-collinearity problem within the variables.
The data given in Table 7 suggests that the mean of VIF is 6.174 which is less than 10.00 which shows that in the estimated model the problem of multicollinearity is not present, so we accept the null hypothesis i.e. (multicollinearity is not present among the explanatory variables) and reject the alternative hypothesis of multicollinearity.
Table 7: VIF of each independent variable.
|
S. No. |
Variables |
VIF |
|
1 |
Age |
7.983 |
|
2 |
Education |
4.710 |
|
3 |
Food expenditure |
3.596 |
|
4 |
Health |
6.675 |
|
5 |
Non-food expenditure |
5.213 |
|
6 |
Total income |
4.288 |
|
7 |
Family size |
8.360 |
|
8 |
Land size |
8.569 |
|
Overall VIF |
6.174 |
|
Source: Primary Data, 2017.
Heteroscedasticity
One of the important assumptions of Classical Linear Regression Model (CLRM) is homoscedasticity which means equal variance of the error term. If the assumption of homoscedasticity is violated i.e. variance of error term will no longer be remain equal which will lead to the problem of heteroscedasticity.
Detection tests of heteroscedasticity: As Primary data was used in the current study so, there is a more chance of occurring heteroscedasticity problem. In order to detect this problem, the following tests were used.
White’s test for Heteroscedasticity
Null hypothesis: heteroscedasticity not present
Test statistic: LM = 89.47 with p-value = P (Chi-square (44) > 89.47) = 6.1432
The result of white test suggests that there is no problem of heteroscedasticity in the data.
Breusch-Pagan test for heteroscedasticity
Null hypothesis: heteroscedasticity not present
Test statistic: LM = 280.746 with p-value = P (Chi- square (8) > 280.746) = 5.12611
The result indicates that the problem of heteroscedasticity does not exist in the data.
Estimated results of the factors affecting farmers’ saving through ordinary least square model
The following coefficients were being estimated by regressing the dependent variable (saving) on independent variables i.e., age, education, income, land size, family size, food expenditure, health expenditure, and non-food expenditure.
Table 8 describes the results of the analysis. The coefficient of determination (R2 = 0.844) suggests that 84.4% variation in the saving of the household is explained by the independent variables. The F-statistic is highly significant shows that the model is overall significant.
Table 8: Empirical results of multiple regressions model of factors affecting savings of farm household.
|
Variables |
Coefficient |
Std. Error |
t-ratio |
p-value |
|
Constant |
-5661.51 |
4837.54 |
-1.1703 |
0.245 |
|
Age |
105.043 |
77.3835 |
1.3574 |
0.17 |
|
Education |
181.489 |
167.023 |
1.0866 |
0.28 |
|
Food expenditure |
-0.472555 |
0.0868529 |
-5.4409 |
0.00*** |
|
Health |
-0.444899 |
0.174205 |
-2.5539 |
0.01** |
|
Non-food expenditure |
-0.341836 |
0.111314 |
-3.0709 |
0.00*** |
|
Total income |
0.332143 |
0.0522746 |
6.3538 |
0.00*** |
|
Family size |
-564.85 |
517.368 |
-1.0918 |
0.27 |
|
Land size |
1823.08 |
484.877 |
3.7599 |
0.000*** |
R-squared=0.844109; Adjusted R-squared= 0.828713; F(8, 81) = 54.82439; P-value(F) = 0.000
Furthermore, the model also illustrates the individual effect of explanatory variables.
The coefficients of income and land size were positive and statistically significant at 5% significance level. The effect of income on saving was positive and statistically significant at 5% significance level. That means any incensement in household income or land size will also lead to increases household saving and vice versa. The results are in line with the findings of Issahaku (2011) according to him these two variables were playing a pivotal role in household saving.
The positive sign of the constant in the saving model contradicts theory as according to theory when income equal to consumption or consumption is more than income, saving becomes negative. However, data collected for the study in hand, every household head was earning and saving some portion of their income, so the saving constant is positive.
The variables such as food expenditure, non-food expenditure, and health expenditure co-efficient were negative and statistically significant at a 5% significant level. Showing negative impact on household saving. These results concluded that as the number of dependents rise, saving of the households fall and vice versa. The results were found to be in line with Ahmad and Asghar (2015) findings.
Conclusions and Recommendations
The findings of the study revealed that all given socio-economic determinants of savings in the study area are equally important. The results are in accordance with the Keynesian theory of savings shows that income is the main determinant of savings. The life cycle hypothesis is also indirectly tested and was proved by the findings of the study that maturity in age is also an important determinant of savings in the study area. The people who were employed had a consistent flow of income and were saving comparatively more than their counterparts. Furthermore, land size, total consumption expenditure, education level, total income, age, and health are also the main determinant of saving for small farmers in the research area.
Based on the research findings the following recommendations were made to increase the savings of farmers in the study area. This study recommends that better off-farm opportunities may increase the saving of small scale farmers, efforts shall be made to provide off-farm opportunities to small scale farmers. Household can increase their saving through better household budget management techniques and by minimizing their expenditures. The study reports a low literacy level among sampled farmers. Agriculture or off-farm income sources cannot be improved without improving the educational level of people. It enables farmers to cultivate their land on a scientific basis. Similarly, it provides awareness regarding other income sources. In order to develop agriculture and provide more off-farm income opportunities, the government should give especial attention to educate the people. For small-scale enterprises government should encourage banks and micro-finance institutions. A large number of the males especially from tenant households were found working as laborers and daily wagers or minor jobs due to illiteracy or low education levels. Their economic status can be enhanced by providing them off-job training at their doorsteps.
Novelty Statement
The researchers identified the new factors which were not used in other studies so far i.e., land size and total expenditures which would play an important role in getting out small farmers from poverty.
Authors’ Contributions
Malik Muhammad Shafi: Supervised the research work.
Rabia Habib: Did research, data analysis and wrote the manuscript.
Haidar Ali: Helped in analysis and technical write up.
Conflict of interest
The authors have declared no conflict of interest.
References
Abid, S. and Afridi, G.S. 2016. Assessing the household saving pattern of urban and rural households in district Muzaffarabad. Pak. J. Life Soc. Sci. 8(2): 137-141.
Adams, D. and von Pischkel, S. 2015. National savings rates of India and Pakistan: The Macro econometric analysis. Pak. Dev. Rev. 34 (1): 125-132.
Agriculture Land Holding Records. 2017. Agriculture Land Holding Records of Farmers in District Kohat in 2017. Kohat Revenue Department Khyber Pakhtunkhwa-Pakistan, 2017
Ahmad, M. and Asghar, T. 2015. Estimation of saving behaviour in Pakistan using micro data. Lahore J. Econ. 9(2): 73-92. https://doi.org/10.35536/lje.2004.v9.i2.a4
Amu, M.E.K. and Amu, E.K. 2014. Saving behaviour in Ghana: A Study of rural households in the ho municipality of the Volta Region. Online J. Soc. Sci. Res. 1(2): 54-61.
Brata, A.G. 2014. Household Saving Behavior: The case of rural industry in Bantul. CSIS. 28(1): 75-86.
Bime, M.J. 2013. Savings mobilization and rural credit markets performance in the North West Province, Cameroon”, Ph.D Thesis submitted to the Department of Agricultural Economics, Michael Okpara University of Agriculture, Abia State Nigeria.
Government of Pakistan. 2019. Economic Survey of Pakistan 2018-19. Finance Division, Economic Advisor’s Wing, Islamabad Pp: 23-27.
Government of Pakistan. 2018. Pakistan Census of Agriculture. Ministry of Food, Agriculture and Livestock, Islamabad. pp: 31-35.
Gujarati, D. 2004. Basic econometrics. 4th Edition, McGraw-Hill Companies, New York.
Hazell, R.B.P. 2015. Is there a future for small farmers? Development Strategy and Governance Division, International Food Policy Research Institute, Washington, DC, USA.
Haruna, I. 2011. Determinants of savings and investment in a deprived district capitals in Ghana. Cont. J. Soc. Sci. 4(1): 1 – 11. http://www.kohat.financekpp.gov.pk/index.php?option=com_content&view=article&id=53&Itemid=63
Issahaku, H. (2011). Determinants of saving and investment in deprived district capitals in Ghana: a case study of Nadoli in the west region of Ghana. Continental Journal of Social Sciences, 4, pp. 1-11
Issahaku, H. 2011. Determinants of saving and investment in deprived district capitals in Ghana: a case study of Nadoli in the west region of Ghana. Continent. J. Soc. Sci., 4: 1-11.
Iyoha, M., Oyefusi, S.A. and Oriakhi, D. E. 2003. An introduction to modern Macroeconomics. Mindex publishing, Benin City.
Pearce, D. 2012. Buyers and Supplier Credit to Farmers. Research Support Program (BASIS- CRSP) and the World Council of Credit Unions, Inc.
Rehman, H., Bashir, F. and Faridi, M.Z. 2011. Rural-Urban saving differentials in Pakistan: investigation from primary data. Int. J.of Human. Soc. Sci. 1(10): 268-277.
Rehman, H., Faridi, M.Z. and Bashir, F. 2010. Households saving behavior in Pakistan: A case of Multan District. Pak. J. Soc. Sci. 30(1): 17-29.
Rutherford, S. 2010. The Poor and their money, Oxford University Press, U.S.A. Shitu, G.A. (2012). Rural Households Income and Savings pattern in South- Western Nigeria. Agric. J. 7(3): 172-176. https://doi.org/10.3923/aj.2012.172.176
Todaro, P.M. 2009. Economic Development in the Third World, 4th Ed. McGraw Hill Ins. USA.
Zeller, M. and Sharma, M. 2008. Many borrow, more save and all insure: Implications for food and micro finance policy. Food Policy. 25: 143–167. https://doi.org/10.1016/S0306-9192(99)00065-2
To share on other social networks, click on any share button. What are these?