

Developmental Changes in Myofibers and Expression Profiles of Potential Regulatory Genes in Slow- and Fast- Growing Chickens


Developmental Changes in Myofibers and Expression Profiles of Potential Regulatory Genes in Slow- and Fast- Growing Chickens
Jia Liu1, Zhen Wang1, Zifan Ning1, Ali Mujtaba Shah2,3,Qing Zhu1, Yan Wang1, Huadong Yin1, Zhichao Zhang1, Lu Zhang1, Yaofu Tian1, Diyan Li1,Gang Shu2,4, Lin Ye1 and Xiaoling Zhao1,*

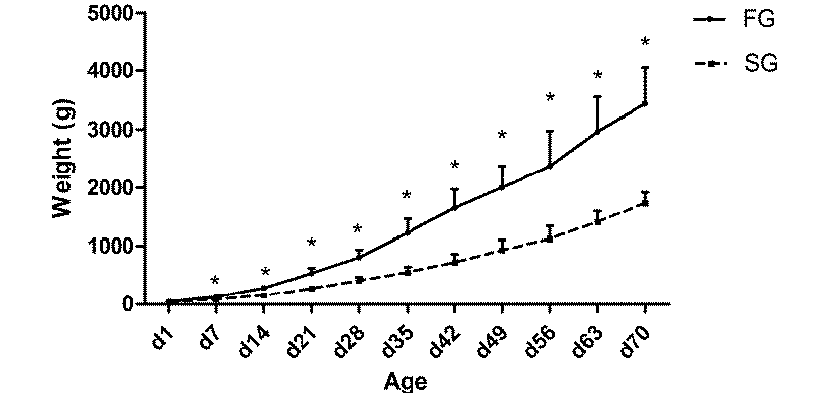
Body weights of FG and SG from d 7 to 70. Means with “*” differ significantly (P < 0.05).
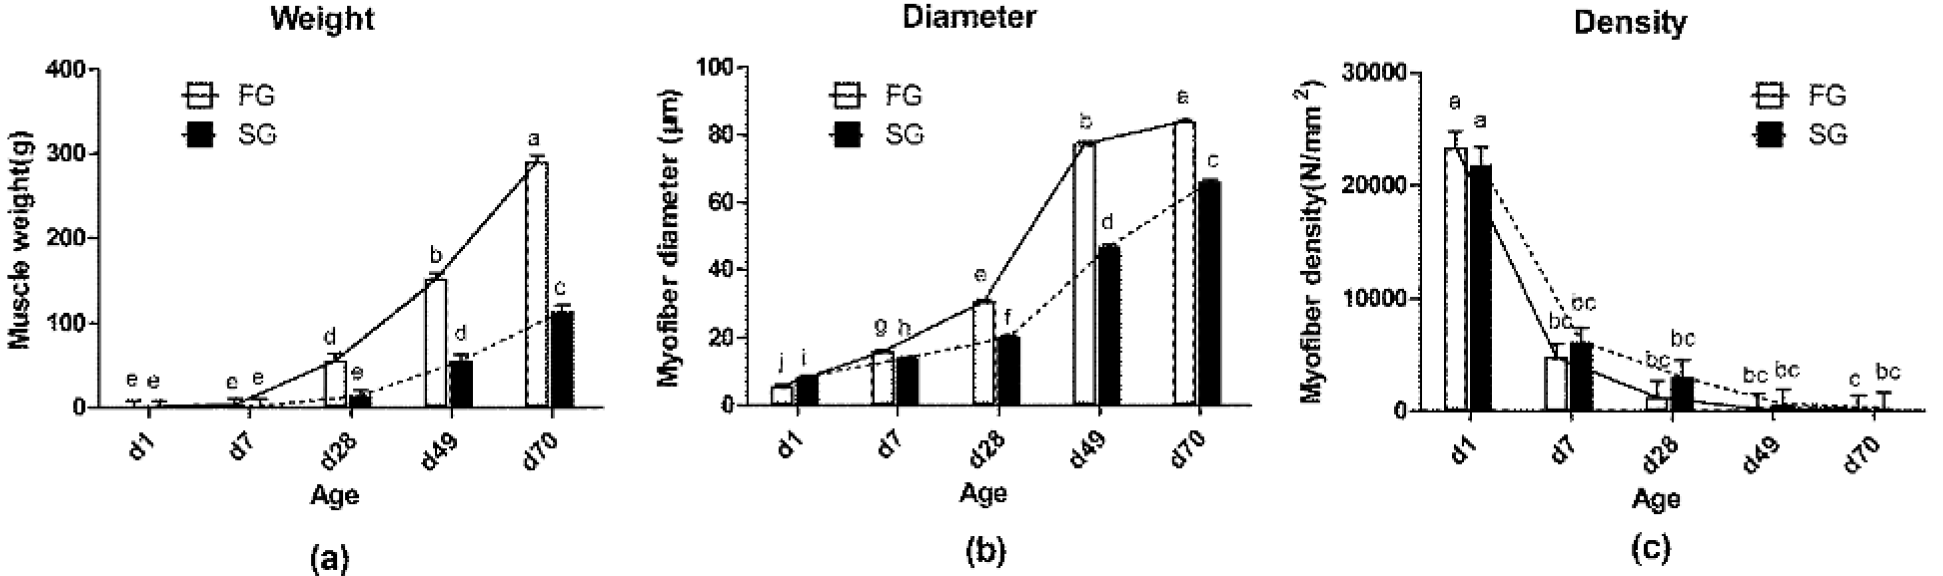
Myofiber characteristics of populations FG and SG on d 1, 7, 28, 49, and 70. (a) Muscle weight, (b) myofiber diameter, (c) myofiber density. Means without a common lowercase differ significantly (P < 0.05).

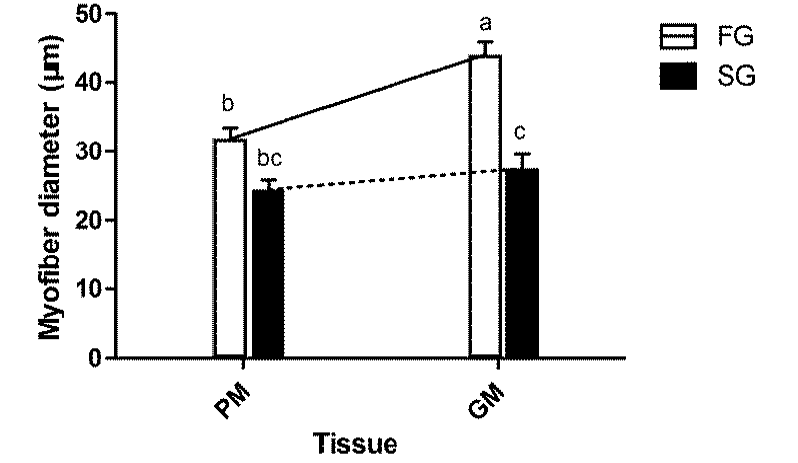
Myofiber characteristics (myofiber diameter) of PM and GM for populations FG and SG. Means without a common lowercase differ significantly (P < 0.05).

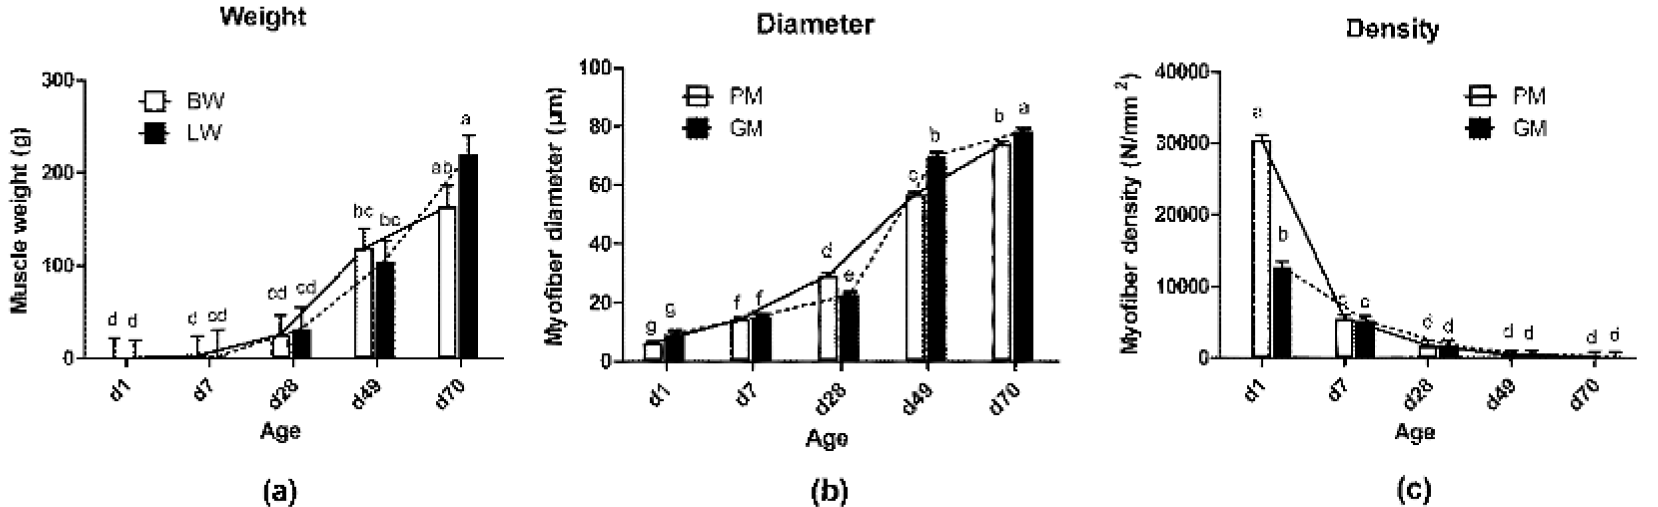
Myofiber characteristics of PM and GM on d 1, 7, 28, 49, and 70. (a) Muscle weight, (b) myofiber diameter, (c) myofiber density. BW = doubled pectoralis major and minor muscle weights, LW = doubled drum and thigh muscle weights. Means without a common lowercase letter differ significantly (P < 0.05).

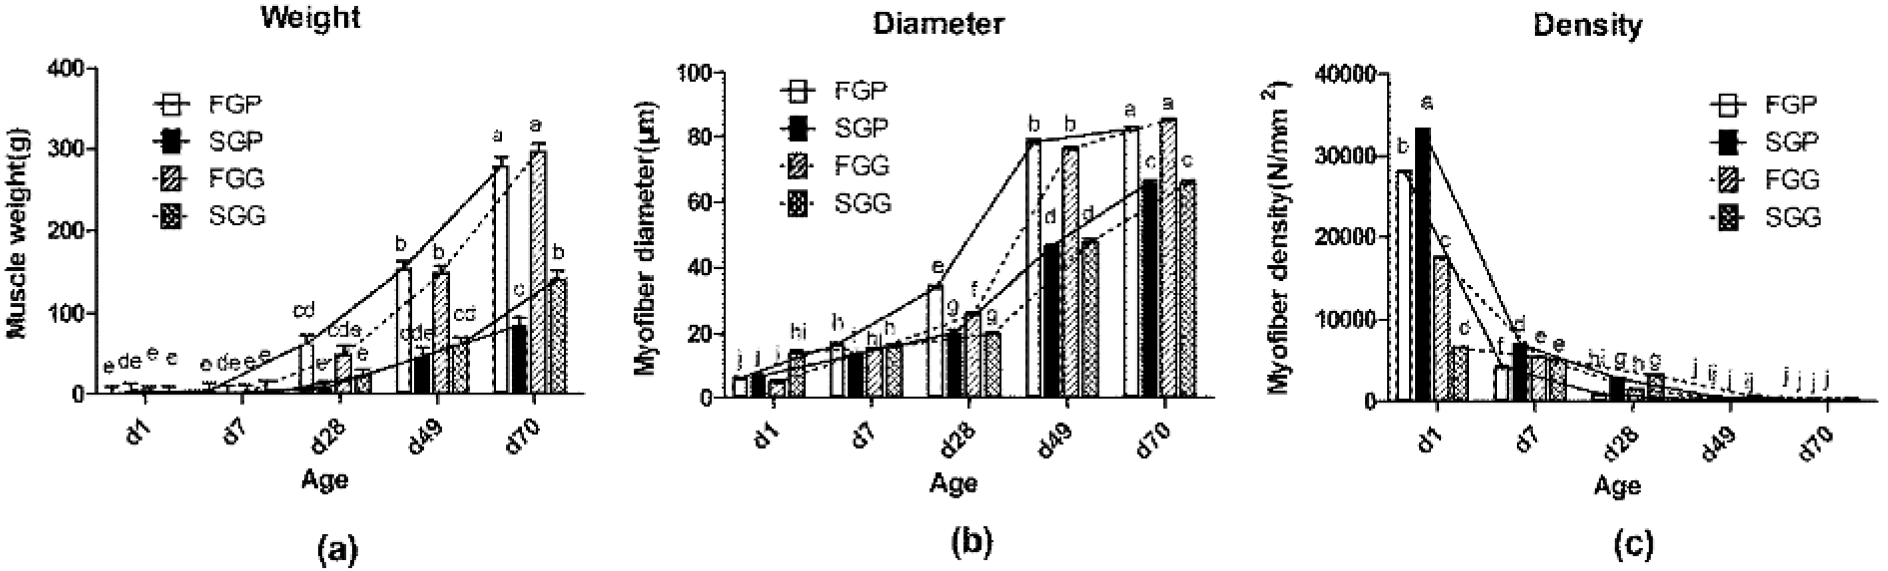
Myofiber characteristics of two populations for PM and GM on d 1, 7, 28, 49, and 70. (a) Muscle weight, (b) myofiber diameter, (c) myofiber density, FGB = breast of FG, SGB = breast of SG, FGL = leg of FG, SGL = leg of SG, FGP = PM of FG, FGG = GM of FG, SGP = PM of SG, SGG = GM of SG. Means without a common lowercase letter differ significantly (P < 0.05).

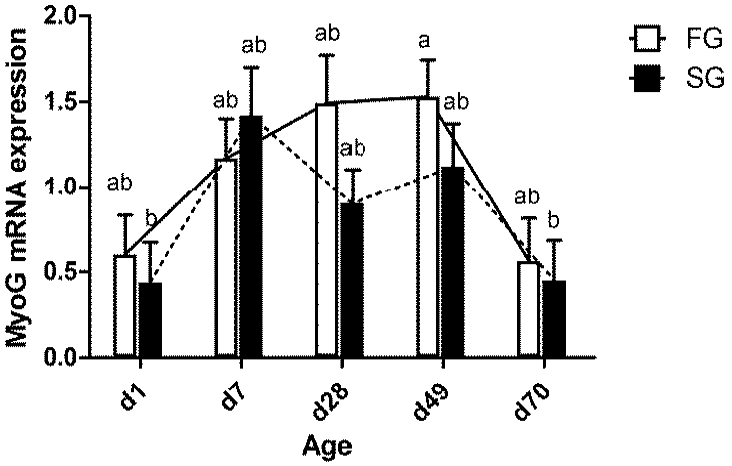
Effect of population and age on expression of MyoG in the two populations on d 1, 7, 28, 49, and 70. Means without a common letter differ significantly (P < 0.05).

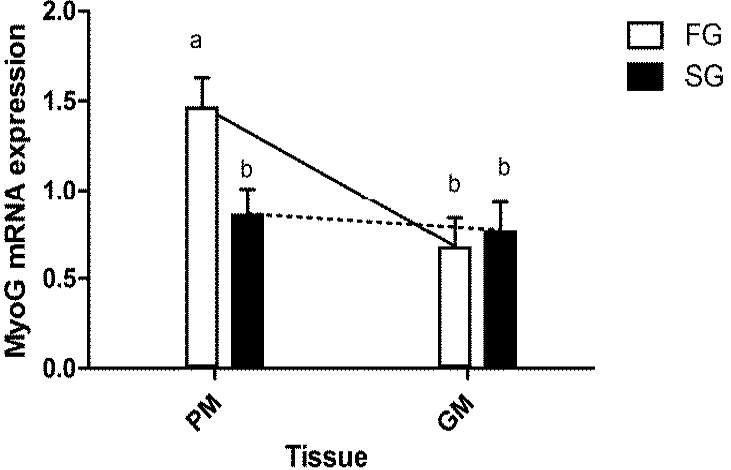
Effects of population and tissue on expression of MyoG in PM and GM tissues. Means without a common letter differ significantly (P < 0.05).
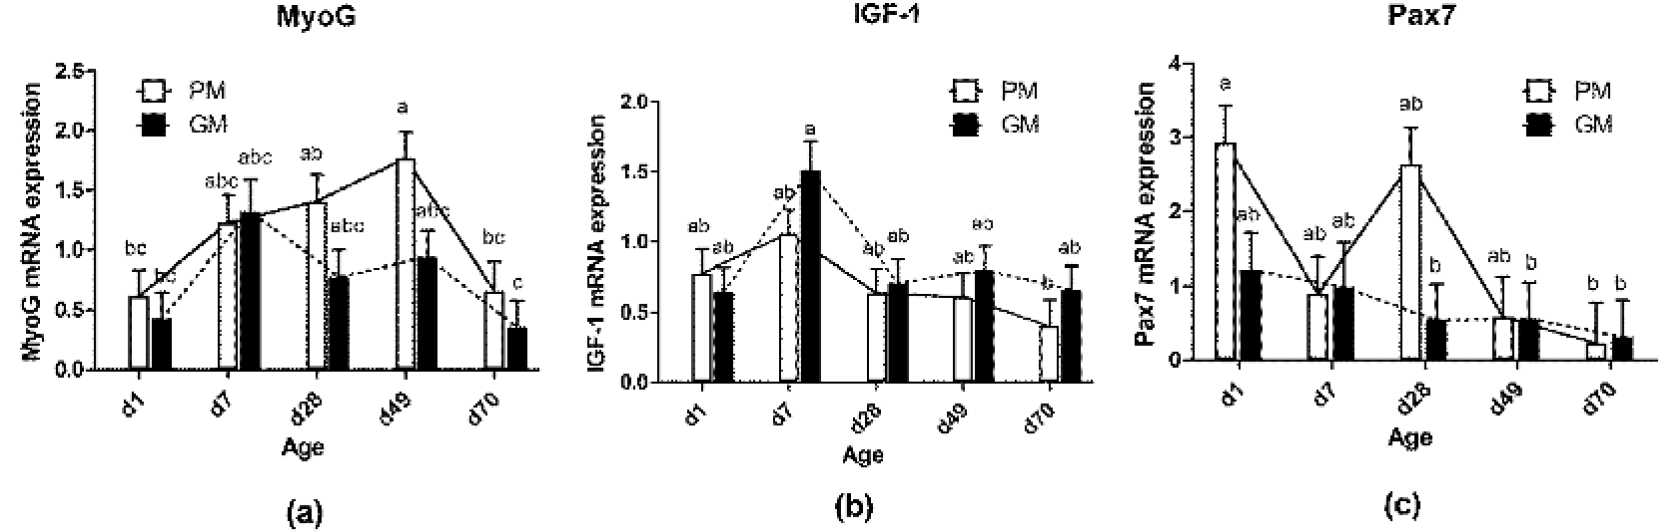
Effect of age and tissue on gene expression in PM and GM on d 1, 7, 28, 49, and 70. (a) MyoG, (b) IGF-1, (c) Pax7. Means without a common letter differ significantly (P < 0.05).

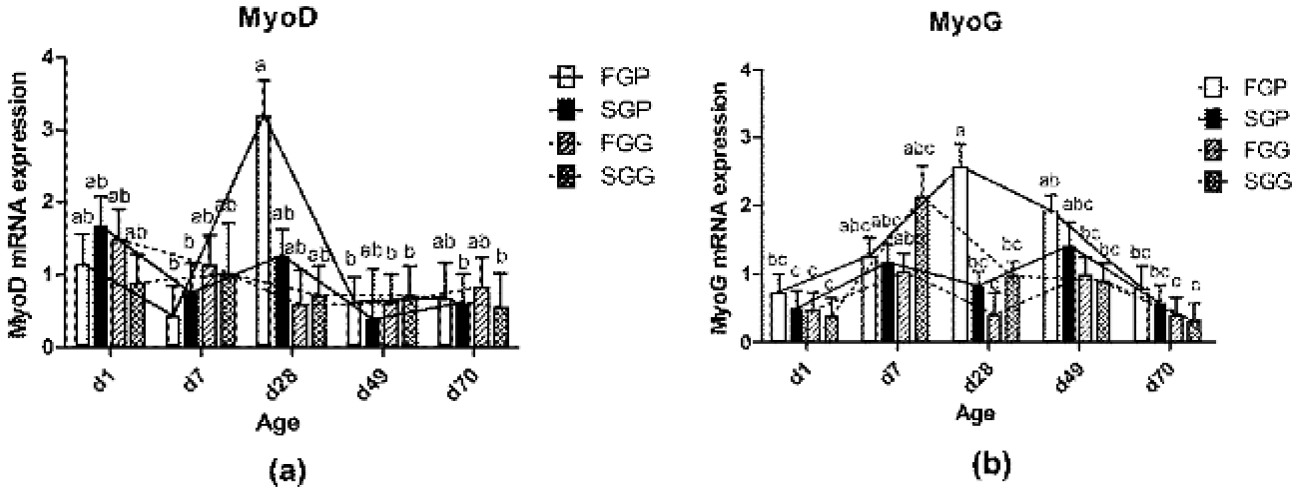
Gene expression in the PM and GM of populations FG and SG on d 1, 7, 28, 49, and 70. (a) MyoD, (b) MyoG; FGP = PM of FG, SGP = PM of SG, FGG = GM of FG, SGG = GM of SG. Means without a common letter differ significantly (P < 0.05).


