

Developmental and Pluripotent Genes in Rat Adult and Neonatal Kidney


Developmental and Pluripotent Genes in Rat Adult and Neonatal Kidney
Sumreen Begum, Atta-ur-Rahman and Asmat Salim*
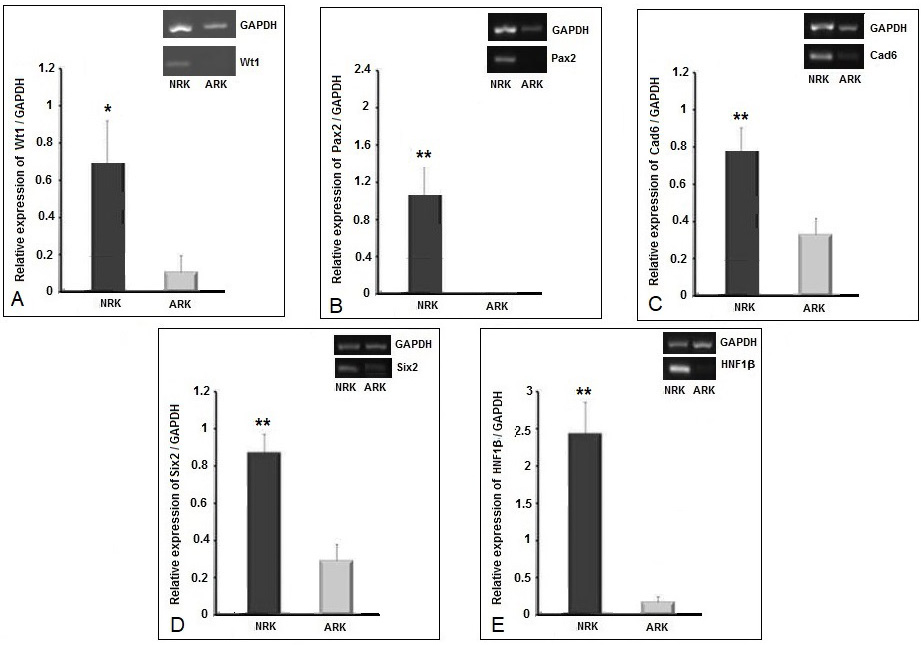
mRNA expression levels of kidney developmental genes in neonatal and adult rat kidney. One dimensional agarose gel image showing gene expression levels by RT-PCR for (A) Wt1, (B) Pax2, (C) Cad6, (D) Six2, and (E) HNF1β. Each gel image is accompanied by bar diagrams showing representative densitometry analyses of these genes. Y-axis shows the relative expression of each gene with respect to GAPDH expression. Data is presented as means ± standard error of means (SEM) where n = 3. For statistical analysis, a Shapiro-Wilk Normality Test was performed and all comparisons were made with Student’s t-test. 95 percent two-tailed confidence interval for differences of means was considered significant (p-value<0.05).
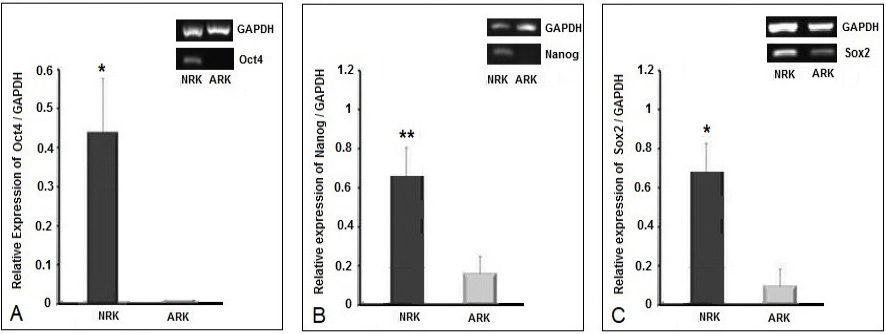
mRNA expression levels of core pluripotency genes in neonatal and adult rat kidney. One dimensional agarose gel image showing gene expression levels by RT-PCR for (A) Oct4 (B) Nanog and (C) Sox2. Each gel image is accompanied by bar diagrams showing representative densitometry analyses of these genes. Y-axis shows the relative expression of each gene with respect to GAPDH expression. Data is presented as means ± standard error of means (SEM) where n = 3. For statistical analysis, a Shapiro-Wilk Normality Test was performed and all comparisons were made with Student’s t-tests. 95 percent two-tailed confidence interval for differences of means was considered significant (p-value<0.05).
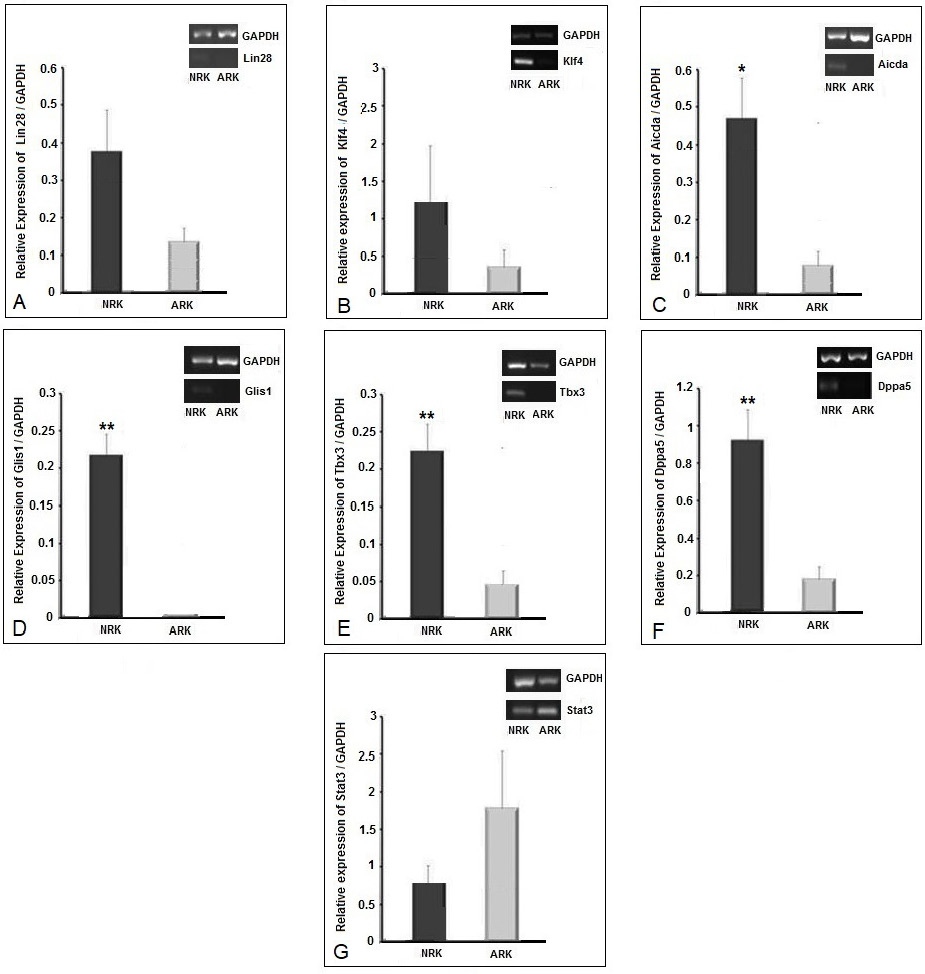
mRNA expression levels of pluripotency regulatory genes in neonatal and adult rat kidney. One dimensional agarose gel image showing gene expression levels by RT-PCR for (A) Lin28, (B) Klf4, (C) Aicda, (D) Glis1, (E) Tbx3, (F) Dppa5 and (G) Stat3. Each gel image is accompanied by bar diagrams showing representative densitometry analyses of these genes. Y-axis shows the relative expression of each gene with respect to GAPDH expression. Data is presented as means ± standard error of means (SEM) where n = 3. For statistical analysis, a Shapiro-Wilk Normality Test was performed and all comparisons were made with Student’s t-test. 95 percent two-tailed confidence interval for differences of means was considered significant (p-value <0.05).

