

Distinct Larva and Adult Food Preferences Drive the Spatial Distribution of Agriotes fuscicollis Miwa (Coleoptera: Elateridae) in the Crop Land, Northeast, China


Distinct Larva and Adult Food Preferences Drive the Spatial Distribution of Agriotes fuscicollis Miwa (Coleoptera: Elateridae) in the Crop Land, Northeast, China
Lichao Feng1,2, Shaoqing Zhang4, Dianyuan Chen2, Sina Adl3 and Donghui Wu1,4*
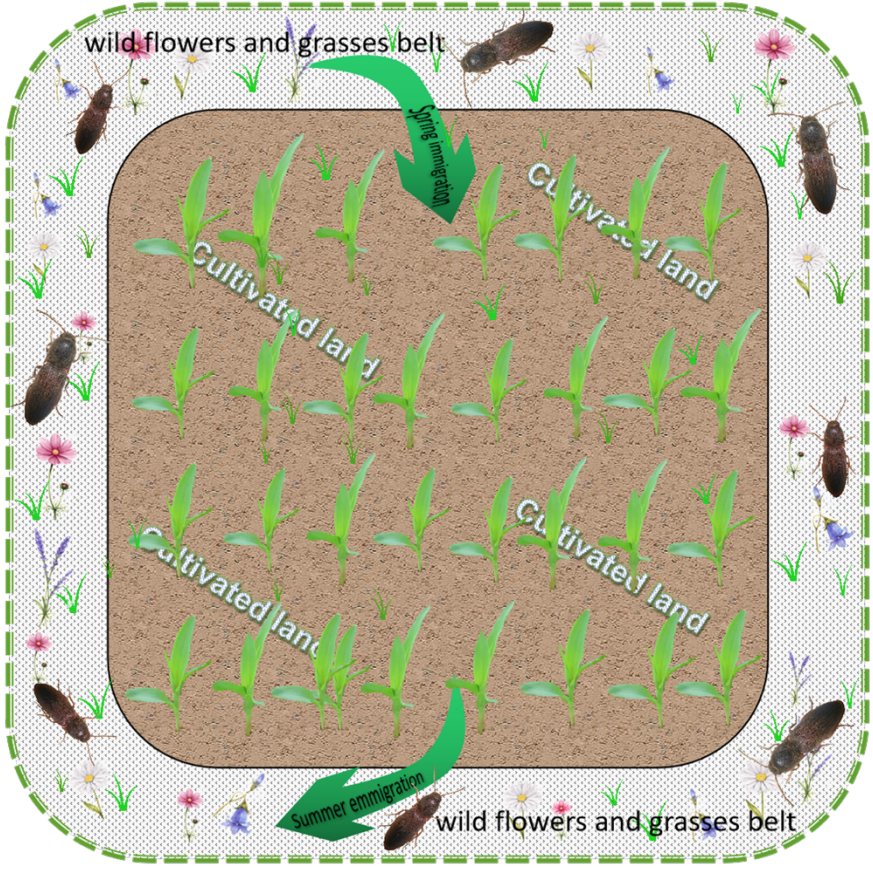
The edge represent the wildflowers and grasses belts around the field. The southern and western boundaries of the field are near to the road, and the other two edges neighbour another field. Sampling plots were evenly allocated at 10-m intervals in 1-ha field. Food sources, which included wildflowers, grasses, and maize, caused a seasonal migration of A. fuscicollis. Most adults mated in the wildflowers and grass belt after overwintering. The adults were able to feed on the flowers as their primary nutrition source before mating. The larvae immigrated to the field in the maize seedling stage in spring; however, they emigrated during the corn jointing stage in summer.
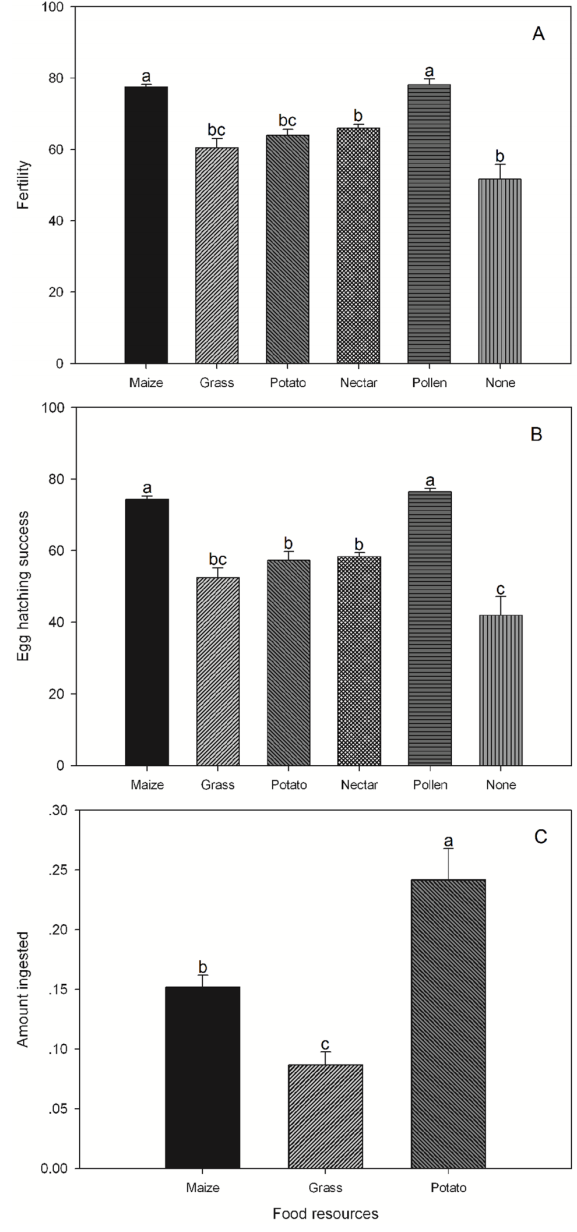
A, Reproductive quantity of A. fuscicollis after consuming different foods. The mean±SEM is shown; n=3. Bars with identical letters are not significantly different; B, Number of eggs hatching on different food sources. The mean±SEM is shown; n=3. Bars with identical letters are not significantly different; C, Amount of A. fuscicollis feeding after larvae consumed different foods. The mean±SEM is shown; and n=3. Bars with identical letters are not significantly different.
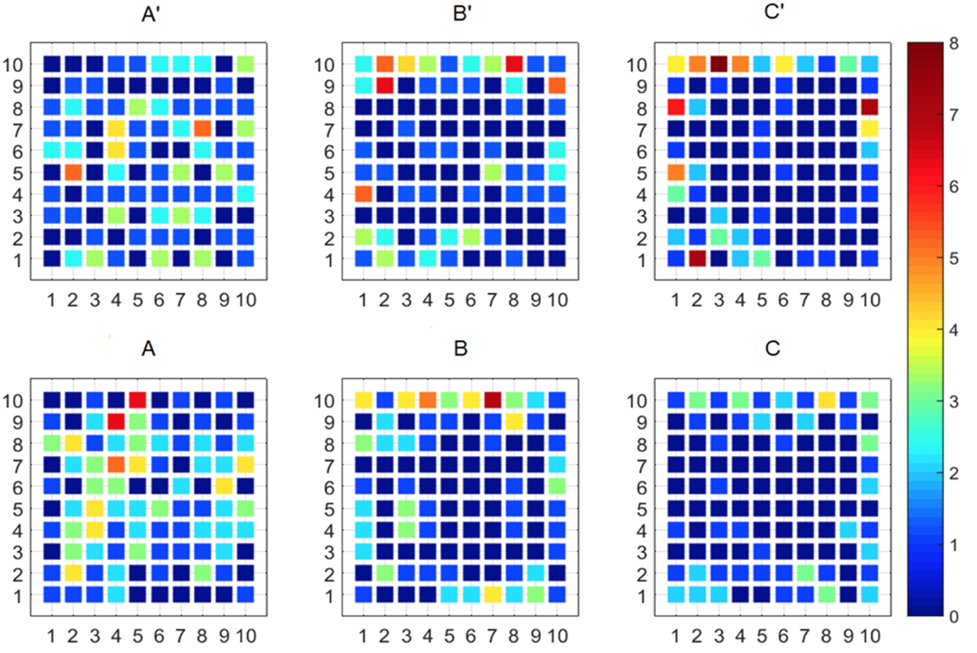
Larval and adult (A. fuscicollis) populations in various plant growth stages, including the corn germinating (A’) and flower vegetative (A) stages, the corn jointing (B’) and flower blossom (B) stages, and the corn (C’) and flower withering (C); average statistical data from 2016 to 2017. Different colors refer to the adult and larval densities in the field and flowers and grasses belt.
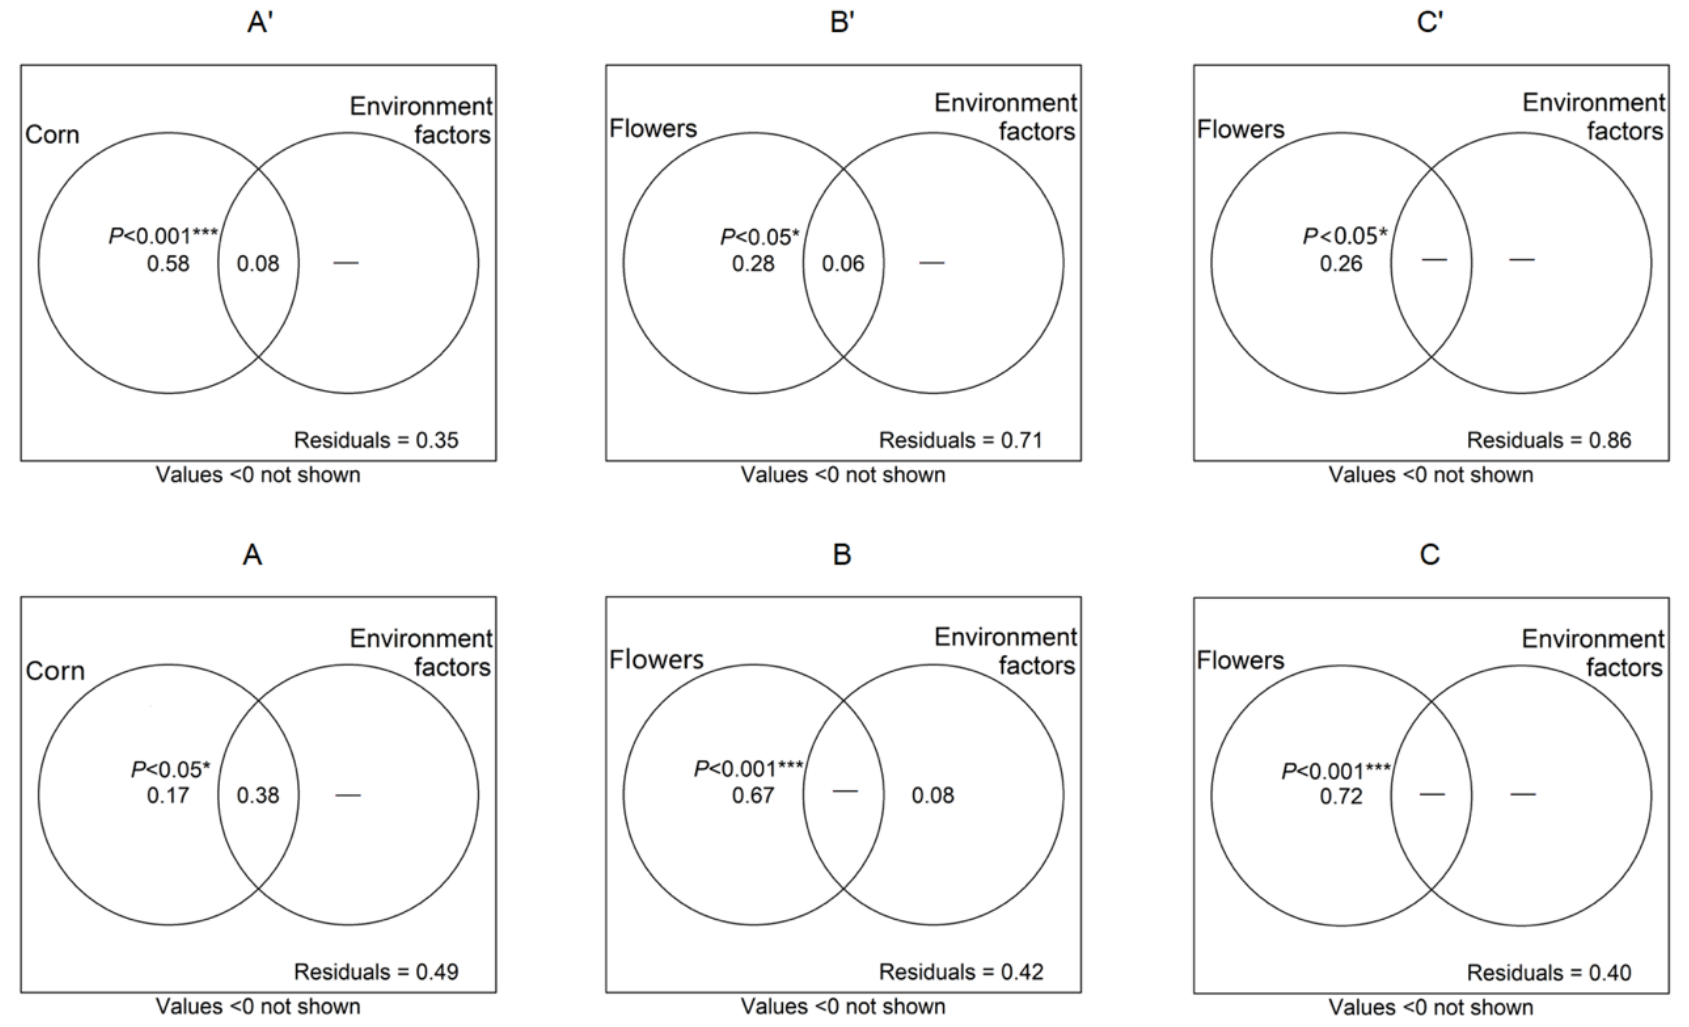
VPA analysis: Environmental factors (SWC, pH, SOMC) and food choices (wildflowers or corn) explain adult and larval spatial distributions. The intersection is the common explanation value of environmental factors and food. The other part of each circle is the separate explanation value. Explanatory values are statistically significant at * P<0.05; ** P<0.01; and *** P<0.001.


