Does Education and Farming Experience Affect Technical Efficiency of Rice Crop Growers? Evidence from Khyber Pakhtunkhwa, Pakistan


Research Article
Does Education and Farming Experience Affect Technical Efficiency of Rice Crop Growers? Evidence from Khyber Pakhtunkhwa, Pakistan
Shahid Ali1*, Murtaza2, Waqas Ahmad1, Nargis Bibi3, Aftab Khan2 and Jahangir Khan1
1Department of Agricultural and Applied Economics, The University of Agriculture, Peshawar, Pakistan; 2College of Economics and Management, Northwest A and F University, Yangling, Shaanxi, China; 3Economics Department, Jinnah College for Women, University of Peshawar, Pakistan.
Abstract | Education and farming experience of farmers are considered the most important factors in allocation of inputs during production process. This study, therefore, aimed at evaluating effect of education and farming experience on technical efficiency of rice farmers in Khyber Pakhtunkhwa, Pakistan. A sample of 300 rice growers was drawn randomly using a multistage sampling procedure through a well-organized pretested interview schedule. Stochastic frontier models (SFM-1 and SFM-2) were utilized to investigate effects of farm inputs and socioeconomic factors on rice production. Results of SFM-1 explicated that all the regressors except irrigation numbers were highly significant with the estimated coefficients of 0.369, 0.047, 0.060, 0.246 and 0.098 for labor hours, tractor hours, chemicals, urea and irrigation numbers respectively. Results of inefficiency’s model exposed that education and farming experience had a significant and adverse influence on technical inefficiency, age had a positive significant effect on farmers’ technical inefficiency whereas tenancy status and primary source of income were found insignificant. The mean technical efficiency of the sampled farmers was estimated at 0.74, ranged between 0.52 and 0.99. The estimated production model showed the highest coefficients for labor hours and urea, it is therefore suggested that rice growers can rise their rice output by increasing labor hours and urea application during the production process. Inefficiency effects model showed a negative and significant relationship of inefficiency with farmers’ education and farming experience, so government is recommended to facilitate farmers with formal as well as informal education and proper trainings regarding rice farming for efficient utilization of available resources.
Received | March 01, 2021; Accepted | March 02, 2022; Published | September 13, 2022
*Correspondence | Shahid Ali, Department of Agricultural and Applied Economics, The University of Agriculture, Peshawar, Pakistan; Email: drshahid@aup.edu.pk
Citation | Ali, S., Murtaza, W. Ahmad, N. Bibi, A. Khan and J. Khan. 2022. Does education and farming experience affect technical efficiency of rice crop growers? Evidence from Khyber Pakhtunkhwa, Pakistan. Sarhad Journal of Agriculture, 38(3): 1147-1159.
DOI | https://dx.doi.org/10.17582/journal.sja/2022/38.3.1147.1159
Keywords | Rice, Technical efficiency, Education, Farming experience, Khyber Pakhtunkhwa
Copyright: 2022 by the authors. Licensee ResearchersLinks Ltd, England, UK.
This article is an open access article distributed under the terms and conditions of the Creative Commons Attribution (CC BY) license (https://creativecommons.org/licenses/by/4.0/).
Introduction
About two third of Pakistan’s population depends directly or indirectly on agriculture as it is the most vital and largest sector of the country’s economy in terms of employment and labor involvement in it. Though, its share to country’s GDP over the last few decades has steadily declined to 19.3 percent but this sector has a plenty of potential and ability to escalate its contribution to GDP by improving and increasing the use of new agricultural technology in productivity GoP (2021).
The sector employed the highest percentage of the labor force and facilitates majority of the country’s manufacturing industries with raw materials. The sector is further classified into sub-sectors like field crops, agricultural forestry, fishing department and livestock where all of them have a substantial effect on Pakistan’s GDP (Ali et al., 2019) and its development not only ensures the poverty alleviation but is also quite capable of uplifting the socioeconomic structure of the remarkable fragment of the entire population. Among the aforementioned subsectors, crops’ subsector contributes more to the economy where the main crops (wheat, maize, rice, sugar cane and cotton) account for almost 22 percent of the agricultural sector’s value added and 4.20 percent to GDP showing a growth of 4.65 percent while other crops account for 11.69 percent of the agricultural sector’s value added and 2.23 percent to GDP (GoP, 2021).
Rice among other crops, is a commonly used food and a cash crop that holds a key position in Pakistan’s agriculture sector. It is not only the 2nd highest consumable food after wheat but also is a 2nd most important exportable commodity for Pakistan after cotton (Jan and Khan, 2019). The crop shares about 0.7 percent to country’s GDP and 3.5 percent of the value-added in agriculture (GoP, 2021). According to crop statistics report, rice in 2019-2020 was cropped on an area of 3034 million hectares, showed an increase of 8 percent compared to 1810 million hectares of the last year’s cultivated area and similarly its production compared to 7.2 million tons of the last year raised by almost 3 percent to 7.4 million tons because of the increase in rice cultivated area in 2020 (GoP, 2020) whereas its production further increased by 13.6 percent to 8.4 million metric tons in 2021 against 7.4 million metric tons of the previous year (GoP, 2021).
Being a country’s major exportable cash crop, it generates substantial revenues for both the farming community and the government. In Pakistan, rice is cultivated in almost all the provinces but Punjab and Sindh are the leading rice producing provinces, accounting for 56 percent and 39 percent of the entire rice production in country respectively (GoP, 2013). Khyber Pakhtunkhwa province isn’t behind in this race and shares a lot to the country’s production where it produced about 129,579 tons of rice with the average yield of 2312 Kg/ha during 2016-17. Rice crop showed an unceasing growth regarding its cultivated area and production in the country over several years as its area and production increased by of 9.9 percent and 13.6 percent respectively during 2020-21 (GoP, 2021), but still its yield and production compared to other countries are low.
Rice production in the country is low as compared to other developed and developing countries and the reason for this are the country’s scarce resources and lower rate of adopting the modern farming technologies. In Pakistan, among all the other provinces Khyber Pakhtunkhwa is facing an alarming challenge to feed its growing population despite the fact of having a firm footage on rice cultivation. The scope to expand area for rice cultivation and conversion of agricultural land to societies and other non-agricultural activities, the demand for food grain could only be met by increasing the production through enhancement in productivity. As the farming communities in such areas are unable to adopt modern agricultural technologies due to higher prices of resources and insufficient fund to invest in agriculture sector, it is quite necessary to improve farmers’ technical efficiencies, so they may be able to utilize the available scarce resources more efficiently and improve their production.
The technical efficiency’s term was initially familiarized by Michael Farrell in the middle of 20th century and the term generally captures the capability of an individual to operate on the frontier isoquant (Farrell, 1957). This type of efficiency can be assessed in a relative way which simply indicates the deviation of an individual from the preeminent performer of a representative peer group (Ali and khan, 2014). A lot of studies have been conducted to measure the technical efficiency and its relationship with farmers socioeconomic characteristics (Reddy and Sen, 2004; Abedullah and Khalid, 2007; Idiong, 2007; Sikdar et al., 2008; Kadiri et al., 2014) and most of them revealed that education and farming experience influence the technical efficiency of the firms as these tools fortify the farmers’ perception and spread awareness among them to adopt modern technologies in best possible ways. Therefore, a progression in technical efficiency of a firm is the best possible and quite potent source of enhancing production as productivity of a firm can be gauged with the help of it and the difference in production among various firms could be determined by it easily.
The Swabi district is gifted by nature with highly suitable and fertile agricultural land, having potential of higher productivity (Ali et al., 2019) but ranked 16th regarding its rice cultivated area and production (GoKP, 2021). During the survey year 2019, the rice production in district Swabi was about 803 tonnes with the observed yield of 1, 916 kgs ha-1 whereas the crop was cultivated on a total of 419 hectares land (GoKP, 2021) but as compared to other districts the rice yield in this specific district was quite low and it might be due to the unawareness of modern technology, illiteracy, and lack of experience or simply because of the inefficient and penniless resources’ allocation (under or over-utilization of the farm resources). Therefore, this study was put forward to evaluate the technical efficiency along with the influence of education and experience on inefficiency of the rice producers in this specific district of Khyber Pakhtunkhwa.
Materials and Methods
Universe of the study
This specific study was conducted in Swabi, the 4th most well-known and popular district of Khyber Pakhtunkhwa located in between the Kabul and Indus rivers (72° 28′ 0″ to the east and 34° 7′ 0″ to the north). It was a major tehsil of Mardan district before the late 1980’s and was nominated as an independent district of the province in July, 1988 and now it has its own tehsils namely Razarr, Swabi, Toppi and Chota-Lahore. Geographically it covers an area of almost 1,550 km2 and its entire population in 2017 was 1,826,804 (GoKP, 2018). The district has an effective relative advantage of producing cereals, fruits, vegetables and other cash crops as it is gifted with fertile agricultural lands, favorable climate for cropping, better irrigation facilities and punctilious farming society. (Figure 1).
Sampling procedure and sample size
Swabi district was chosen purposively because of the time and budget constraints and a random multistage sampling technique was used to collect the data from rice growers. Among the four tehsils of Swabi district, Razarr tehsil was randomly picked up in the 1st stage. In stage 2nd of the procedure seven villages were chosen namely Yar-Husain, Kalu Khan, Daagai, Gunbad, Adina, Yaqoobi and Nazar. In 3rd stage a total of 300 rice growers were randomly interviewed and this sample size was taken by using the Yamane’s formula (Yamane, 1967) given below.
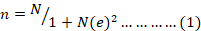
Where;
n: Size of the sample; N: Entire individuals of selected villages involved in rice farming; e: Accuracy’s term of the formula.
After deciding the total size of the sample, proportional allocative sampling method was used to choose the rice farmers from each village. The formula is given below.
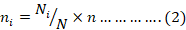
Where;
ni: Number of rice growers interviewed from a specific village; Ni: Total no. of rice farmers in that specific village; N: Number of total rice farmers in all selected villages; n: Over-all sample size (Table 1).
Data collection
The study employed both the primary and secondary data whereas the former one were collected with the help of questionnaire that was pre-tested in the field and designed well to investigate all the necessary particulars experienced in rice farming. Farmers were interviewed at their farms, houses and hujras in their local languages while secondary data were taken from Pakistan Bureau of Statistics, Khyber Pakhtunkhwa Development Statistics and local extension departments.
Table 1: Sampling procedure and sample size.
|
Tehsil/ District |
Villages |
Population |
Sample size |
Percentage |
|
Razarr/ Swabi |
Adina |
225 |
61 |
20.33 |
|
Yar-Hussain |
195 |
53 |
17.67 |
|
|
Kalu Khan |
184 |
50 |
16.67 |
|
|
Daagai |
151 |
41 |
13.67 |
|
|
Yaqoobi |
133 |
36 |
12.00 |
|
|
Nazar |
117 |
31 |
10.33 |
|
|
Gunbad |
105 |
28 |
9.33 |
|
|
Total |
1,110 |
300 |
100.00 |
Source: Agriculture extension department, Swabi (2020)
Conceptual framework
In the mid of 20th century, Farrell (1957) for the first time developed a method to measure and describe allocative, technical and economic efficiencies whereas economic efficiency refers to increase a firm’s output without consuming any additional conventional resources (Farrell, 1957; Khai and Mitsuyasu, 2011). Using available resources is highly cost effective as compared to modern technology only if individuals operate with the accessible resources efficiently while cultivating their crops (Khai and Mitsuyasu, 2011; Belbase and Grabowski, 1985). Economic efficiency of an individual is simply the product of allocative and technical efficiency whereas allocative efficiency is related to an individual’s ability to get to the desired output’s level with the lowest possible cost while technical efficiency measures an individual’s skills and abilities to accomplish the maximum possible output by means of the given available technology (Coelli et al., 2005; Shapiro, 1977; Farrell, 1957).
According to Farrell (1957) technical efficiency of a firm measures the output accomplished with existing technology without involving their relative prices and can be defined better with three major efficiency’s phenomenon such as the pure and real technical efficiency, congestion (where increasing some specific resources might cause a decline in output) and scale-efficiency (potential output achieved from an optimal firm’s size). To better understand the concept of technical efficiency, let’s assume an individual producing only one output (Y) while operating with a couple of inputs (X1, X2) with the supposition of 1:1 returns to scale. Technical efficiency of the fully efficient firm can be measured through the isoquant namely S, S´ given in Figure 2. Point A is fully technically efficient point because the firm at this point is operating on the efficient and effective isoquant curve and any deviation from this point gets counted in the inefficiency of the firm. Let say at point B where the firm is underutilizing the inputs while producing the given output’s unit, the length of BA represents that firm’s technical inefficiency. This implies that reducing the percentage use of both the inputs by proportion of AB/OB could result the technically efficient level of output.
Usually, a firm’s technical efficiency is gauged by the proportion of OA/OB and ranges within 0, 1 showing the degree of efficiency such as more the value closer to 1, the more technically sound or efficient a firm would be.
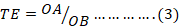
The situational allocative efficiency of the firm can be find out by the proportion of CO/CA while economic efficiency can be calculated by the multiplication of both the efficiencies and in this situation it equals to the ratio of CO/BO. The equations are given as:

Evident from the reviewed literature, generally two approaches are used to analyze the firms’ technical efficiency. The DEA approach (Data Envelopment Analysis) which is non-parametric and mathematical in nature and the SFM approach (Stochastic Frontier model) that focuses on a developing model built on deterministic frontier of Aigner and Chu (1968). The DEA approach helps in production process involving multiple outputs and inputs. Being a non-parametric approach, it’s not too much sensitive to deal with the error term’s specification because it lacks the ability to make a clear separation of inefficiency and noise while estimating the technical efficiency (Kebede, 2001). In contrast the SFM approach explains the relationship of a single output to multiple inputs (Khai and Mitsuyasu, 2011) and being a parametric approach, it is quite capable of differentiating the inefficiency’s effects from the noise term and generates better estimates for output and inputs relationship (Khai and Mitsuyasu, 2011; Kebede, 2001). (Figure 3).
Among the few concepts of deterministic frontier, Kopp and Diewert (1982) imposed a very restrictive assumption that only inefficiency of the firms is responsible for the deviation of observed output from frontier level but Schmidt (1985–86) argued on this and concluded that statistical noises always have impact on efficiency of the firms estimated by such models. In order to deal with this conflict and eliminate the random effect from efficiency Bravo-Ureta et al. (1991) employed a stochastic frontier production model given below.

Where;
Yj: Output achieved by jth firm; Xij: ith variable utilized by jth firm; ∝: parameters to be estimated by the model; ε: Error term of the model.
The key factor of the SFM approach is that it’s error term is special and composed of two parts such as the technical inefficiency of individuals involve in production and the random error (Khai and Mitsuyasu, 2011; Bravo-Ureta et al., 1991; Meeusen and Broeck, 1977). The composed error term of the model is given as;

According to Greene (1980) and Aigner et al. (1977) both the terms are independent of each other and “ui” shows the technical inefficiency of an individual or simply it captures the gap in observed output to that of the frontier level output, half normally distributed and always greater than 0 (ui>0) while “vi” term of the composed error indicates the random factors that are far beyond someone’s control (luck, climate, and other natural calamities) and is normally distributed on both the sides (-∞<vi<∞). Because of the consistency and specialty of the stochastic frontier production approach, the study implied this model to analyze the farmers’ efficiency and inefficiency (technical) following Murtaza et al. (2020), Ali et al. (2019), Khai and Mitsuyasu (2011), Coelli et al. (2005), Kebede (2001), Bravo-Ureta et al. (1991), Belbase and Grabowski (1985), Kopp and Diewert (1982), Meeusen and Broeck (1977), Shapiro (1977), Aigner et al. (1977), Aigner and Chu (1968) and Farrell (1957).
The specified form of SFM (Model-1) is given as:

Where;
ln: Natural log; ∝i: Coefficients’ parameters; labor and tractor: Amount of labor working hours and tractor hours respectively; chemicals: Amount of pesticides and weedicides used in litres; urea: amount of urea in kgs.; irrigation: No. of irrigation give to the rice; εi: Composed error term.
The specified form of SFM (Model-2) is given as:

Where;
αi: Coefficients estimated; T.Ineff: Inefficiency of the rice firms: age: Age of the rice growers; farmingexp: Rice farming experience of respondents in years; education: Education of respondents in years; incomesource: Dummy for primary source of income (1 for agriculture, 0 otherwise); tenancystatus: Dummy (1 for owner, 0 otherwise); εi: Error of SFM (Model-2). Analysis was carried out in Stata 16 software (Stata Corp, 2019)
Results and Discussion
Cost of rice production (per acre)
The total cost incurred in rice production resulted by summing up the transportation and on-field production cost, whereas the on-field cost is the sum of fixed cost (land rent) and variable cost (cost on variable inputs such as seed, labor, chemicals, tractor, fertilizers and irrigation etc.).
Rice production cost per acre in the study area was calculated as Rs. 32676.59, sharing about 97.8 percent to the total cost of Rs. 33402.17. The major elements of the on-field cost incurred on rice production are given as:
Cost on seeds: Rice growers in the study area used Garma (local seed) for production and it contributed 1.59 percent to the total cost with the mean cost of Rs. 533.1 per acre.
Cost on labor: Labors in the study area were used to perform several field activities such as sowing seeds, seedlings’ raising and transplantation, irrigation, chemicals and urea’s application, harvesting and threshing etc. The average daily basis wages in the study area were recorded as Rs. 68.30 and the total cost of labor on average was calculated as Rs. 10074.25, 2nd highest among all the other costs contributing almost 30 percent of the total cost.
Cost on tractor use: Tractor was used to prepare seed bed for sowing. The average cost of tractor used by sampled farmers was Rs. 2940 with the unit cost of Rs. 1200 and it contributed about 8.8 percent to the total cost.
Cost on chemicals and urea: Chemicals such as pesticides and weedicides along with the fertilizer like urea were applied to enhance the rice production. The average cost incurred on both the inputs were recorded as Rs. 2324.9 and Rs. 3842.9 with their average application of 2.85 litres and 98.53 kgs respectively, contributing about 18.10 percent to the total cost.
Cost on irrigation: Frequent irrigation is required to irrigate the rice crop as it is quite water intensive and all the sampled farmers used canal water for irrigation. The variable was measured in numbers and the average cost incurred on it was Rs. 696, sharing about 2 percent of the total cost.
Land rent: Land rent is considered as fixed cost and it varied across the villages based on water availability, soil texture and fertility and its distance from villages. Average land rent in the study area was calculated as Rs. 12265.4 acre-1, highest among all the other costs and contributed almost 37 percent to the total cost.
Marketing cost: It includes the cost of rice bags, loading, unloading and transportation but as all the sampled farmers sold both their main and by-product at their relative farms, this particular cost wasn’t too much. The average marketing cost was recorded as Rs. 725.58 which contributed 2.17% to the aggregate cost on rice crop. The results are given below, in Table 2.
Profitability ratio, gross and net return from rice farming acre-1
Table 3 describes the profitability ratio, gross and net return of rice farming acre-1 in the study area. The average rice grain yield in the study area was recorded as 1573.27 kgs acre-1, resulting an average revenue of Rs. 59941.71 while the average revenue of rice crop’s by-product was calculated as Rs. 12659.32. The gross and net revenues of rice growers per acre were calculated as Rs. 72601.03 and Rs.39198.86 respectively. The sampled rice growers were reasonably profitable as the profitability ratio of 1.17 revealed that a single rupee investment on rice farming generated a profit of Rs. 1.17 which is far greater than its competitive seasonal maize crop. The profitability ratio and net revenue of its competitive crop in the same district was recorded as Rs. 0.20 and Rs. 5293.7 in 2020 (Murtaza et al., 2020).
Table 2: Cost of rice production (per acre).
|
Particulars |
Unit |
Cost/unit (PRs) |
Quantity |
TC |
Percentage |
|
Tractor |
Hrs. |
1200.00 |
2.45 |
2940.00 |
8.80 |
|
Labor |
Hrs. |
68.30 |
147.50 |
10074.25 |
30.17 |
|
Seed sown |
Kgs. |
100.00 |
5.33 |
533.13 |
1.59 |
|
Urea |
Kgs. |
39.00 |
98.53 |
3842.98 |
11.50 |
|
Chemicals |
Litres |
815.76 |
2.85 |
2324.91 |
6.96 |
|
Irrigation |
No. |
43.50 |
16.00 |
696.00 |
2.08 |
|
Land rent |
PKR |
12265.34 |
1.00 |
12265.34 |
36.73 |
|
Production cost |
PKR |
- |
- |
32676.59 |
97.83 |
|
Marketing cost |
- |
- |
- |
725.58 |
2.17 |
|
Total cost |
- |
- |
- |
33402.17 |
100 |
Source: Author’s calculation (Rice data, 2020); Note: Production cost + Marketing cost = Total cost.
Summary statistics of variables used in SFM-1
Table 4 displays the descriptive analysis of all the regressors used for estimating the stochastic frontier production model for rice growers. Explanatory variables such as tractor, labor, chemicals, urea and irrigation were used to estimate SFM-1 while technical inefficiency model was estimated by variables like age, education, farming experience and dummies of tenancy status and primary source of income. The results showed that the average rice yield was 1573.27 kgs., ranged from 1060 to 2065 kgs/acre with the std. deviation of 234.31 kgs. The mean value for tractor used was 2.45 hours acre-1 with the minimum and maximum use of tractor for 2 and 4 hours and std. deviation of 0.27 hours. The labor working hours per acre ranged within 95.3 and 217 hours with an average of 147.5 hours and std. deviation of 22.7 hours. The mean value for urea’s application was 98.5 kgs with the std. deviation of 23.02, ranging in between 65 and 175 kgs per acre. On average the rice growers sprayed 2.8 litres of chemicals, ranged in between 2 and 4.2 litres with the std. deviation of 1.93 litres acre-1. The sampled respondents on average irrigated their farms 16 times during the cropping season with the maximum and minimum of 19 and 11 times respectively.
Demographic characteristics such as farming experience, age, education level, tenancy status and primary source of income influence the inefficiency of farming community in a production process (Murtaza et al., 2020). The statistics showed that rice growers in the study area had an average age of 45.5 years, with the maximum, minimum and std. dev of 69, 30 and 9.85 years respectively. Majority (60%) of the sampled rice growers were literate with an average education level of 5.59 years, maximum of 16 years and about 40% of them were illiterate. On average the sampled farmers were experiencing rice farming for 5.53 years, ranging between 2 and 13 years whereas 42 percent of them were owners while the remaining were tenants. About 62 percent of the sampled respondents were agriculture reliant as agriculture was their primary income’s source.
SFM (Model-1) estimates
Table 5 portrays the parameters estimated by SFM-1 for rice growers in the research area. The coefficients were estimated as 0.369, 0.047, 0.060, 0.246 and 0.098 for labor hours, tractor hours, chemicals, urea and irrigation numbers respectively.
The estimated coefficients along with their z-statistics and p-values showed that all the regressors had a direct significant effect on the rice productivity except for number of irrigation. The estimated 0.369 coefficient for labor working hours was positive and highly significant (α= 0.000), ranked as the highest among all the other coefficients which revealed that a 1 percent increase in the labor hours raised the rice yield
Table 3: Profitability ratio, gross and net return from rice farming.
|
Particulars |
Yield |
Revenue |
TR |
TC |
NR |
Profitability 39198.86/33402.03 = 1.17 |
|
Main product |
1573.27 |
59941.71 |
72601.03 |
33402.17 |
39198.86 |
|
|
By-product |
… |
12659.32 |
Source: Author’s calculation (Rice data, 2020)
Table 4: Summary statistics of variables used in stochastic frontier production model.
|
Particulars |
Unit |
Mean |
S.D |
Minimum |
Maximum |
|
Summary statistics of variables used in Model-1 |
|||||
|
Yield |
Kgs. |
1573.27 |
234.31 |
1060 |
2065 |
|
Tractor |
Hrs. |
2.45 |
0.27 |
2 |
4 |
|
Labor |
Hrs. |
147.50 |
22.74 |
95.35 |
217 |
|
Urea |
Kgs. |
98.53 |
23.02 |
65 |
175 |
|
Chemicals |
Litres |
2.85 |
1.40 |
2 |
4.2 |
|
Irrigation |
No. |
16.00 |
1.93 |
11 |
19 |
|
Summary statistics of variables used in Model-2 |
|||||
|
Age |
Years |
45.51 |
9.85 |
30 |
69 |
|
Farming Exp. |
Years |
5.53 |
2.17 |
2 |
13 |
|
Education |
Years |
5.59 |
4.51 |
0 |
16 |
|
T. status |
Dummy |
0.42 |
0.49 |
0 |
1 |
|
Income source |
Dummy |
0.62 |
0.48 |
0 |
1 |
Source: Author’s calculation (Rice data, 2020).
Table 5: SFM (Model-1) estimates.
|
Regressors |
β's (coefficients) |
Std. error |
Z-statistic |
P-value |
|
Ln (Labor Hrs.) |
0.36913 |
0.04414 |
8.36** |
0.000 |
|
Ln (Tractor Hrs.) |
0.04746 |
0.02015 |
2.36* |
0.018 |
|
Ln (Chemicals) |
0.06026 |
0.01721 |
3.50** |
0.000 |
|
Ln (Urea) |
0.24677 |
0.01984 |
12.4** |
0.000 |
|
Ln (Irrigation No.) |
0.09880 |
0.05267 |
1.88ns |
0.061 |
|
Constant |
4.10888 |
0.27551 |
14.91** |
0.000 |
|
Sigma_v |
0.06324 |
0.00854 (0.000) |
||
|
Sigma_u |
0.12722 |
0.01499 (0.000) |
||
|
Lambda |
2.01152 |
0.02231 |
||
|
Gamma |
0.80 |
|||
Source: Authors’ estimates for rice data, 2020; Note: ** indicates significance level at 1%, * indicates significance level at 5% and ns shows non significance.
by 0.369 percent. This is because that rice being a laborious crop, draws more time and attention of the farmers and thus plays a key role in the rice farming (Ogundele and Okoruwa, 2006). The same positive and significant results for labor were estimated by Lema et al. (2017), Heriqbaldi et al. (2015), Ahmadu and Erhabor (2012) and Sowunmi and Akintola (2009). The estimated tractor hours’ coefficient of 0.047 implied that a unit change in tractor hours increased the rice yield by 0.047 percent. The effect was positive and highly significant, showing the importance of machinery hours in the rice farming and this is because rice is one of the crops having deep roots by nature and according to Arora et al. (2019) it requires intensely ploughed soil to enter the feeding zones and get the desired amount of water, minerals and other nutrients easily. The results for tractor hours are in coherence to that of Subedi et al. (2020), Bempomaa et al. (2014), Ali and Munir (2014) and Reddy and Sen (2004). The coefficient estimated for weedicides and pesticides revealed that increase in the chemicals’ application had a positive and significant effect of 0.06 percent on rice productivity. The reason for this is that chemicals are much more important in production because they control pests, herbs and harmful weeds which affect the productivity of crops by competing them for essential nutrients and water (Hewitt, 2004). The results are in correspondence to Shaheen et al. (2017), Abedullah et al. (2010), Hassan (2005) and Hassan and Ahmad (2005). The adequate use of chemical fertilizer such as urea has an indispensable role in enhancing the rice productivity and is considered very important in production because it flourishes the leaves growth and aids the crop to improve the process of photosynthesis (Chen et al. 2020). The statements are factual as the estimated coefficient of urea in this study showed that an increase in its application significantly raised the rice productivity by 0.24 percent and the results are consistent to Kea et al. (2016), Smith and Hornbuckle (2013), Yu and Diao (2011) and Khan et al. (2010).
The coefficient for number of irrigation was positive but statistically insignificant, implying that irrigation numbers didn’t contribute significantly to rice production and it may be due to the reason that rice growers didn’t irrigate their farms in time or they didn’t use the adequate numbers of irrigating the crop. Same insignificant impact of irrigation on farmer’s technical efficiency was estimated by Achandi (2018), Narala and Yogendrasinh (2010). The estimated 0.80 value of gamma (variance parameter) implied that 80% deviation of the observed rice yield from frontier-level output was because of the sampled rice growers’ inefficiency whereas the 20 percent of it was due to the random factors that are beyond the farmers’ approach.
SFM (Model-2) estimates
Table 6 depicts the estimates of SFM-2 for inefficiency of rice growers in the study area. The coefficients for age, rice farming experience, education, income source and tenancy status of the respondents were estimated as 0.071, -0.392, -0.154, -0.085 and 0.146, respectively.
Table 6: Estimates of stochastic frontier model for inefficiency of rice growers, Model-2.
|
Regressors |
Unit |
Coefficients |
Std. Err |
Z- statistic |
P- value |
|
Age |
Years |
0.07197 |
0.02692 |
2.67** |
0.008 |
|
Farming Exp. |
Years |
-0.39270 |
0.12552 |
-3.13** |
0.002 |
|
Education |
Years |
-0.15411 |
0.06093 |
-2.53* |
0.011 |
|
Income source |
Dummy (1 for agriculture, 0 otherwise |
-0.08594 |
0.38795 |
-0.22ns |
0.825 |
|
Tenancy status |
Dummy (1 for owner, 0 otherwise) |
0.14655 |
0.38846 |
0.38ns |
0.706 |
Source: Authors’ estimates for rice data, 2020; Note: ** indicates significance level at 1%, * indicates significance level at 5% and ns shows non-significance.
The socioeconomic characteristics of respondents such as age, experience and education, source of income and tenancy status have a great influence on their technical efficiencies because these characteristics reflect their perceptions, interests and decisions about the modern farming. The findings of the study showed that age, rice farming experience and education were statistically significant while tenancy status and primary source of income had an insignificant effect on farmers’ inefficiency. The coefficient for age of the rice growers was positive and significant, inferring that a year increase in farmers’ age increased the technical inefficiency by 0.07 percent. The fact is that rice being a laborious crop draws some more time and attention and younger farmers got the plenty of potential to do that as compared to the aged farmers. Same positive impact of age on technical inefficiency of the farmers was found by Ali and Khan (2014), Khan et al. (2010) and Coelli and Battese (1996). The coefficient for rice farming experience had a significant effect on technical inefficiency and its estimated value of -0.39 revealed that inefficiency of the sampled respondents showed a negative change of 0.39 percent with one year increase in rice farming experience of the farmers. The reason behind this is the more familiar a farmer is with a crop, the more technically efficient he/she would be as an experienced farmer is fed to mouth with the relevant farming information and the results are in coherence to Abasi et al. (2013), Orewa and Izekor (2012), Backman et al. (2011), Khan et al. (2010) and Idiong (2007). The results further showed that education of the rice growers had a significant negative impact on technical inefficiency and its estimated coefficient of -0.15 revealed that a unit increase in farmers’ schooling years resulted a decline in their inefficiency by 0.15 percent. This negative impact of education might be due to the fact that education boosts up the farmers’ potential to enhance their skills and perception regarding modern farming practices. Educated farmers as compared to illiterate always have up to date information regarding seeds, fertilizers, chemicals and other agronomic activities and thus are more technically sound. Same positive and significant coefficients for education were found by Lema et al. (2017), Kea et al. (2016), Kabir et al. (2015) and Balde et al. (2014), while estimating the technical efficiency of rice farmers. Income source and tenancy status of the rice growers were treated as dummies in the model and their coefficients inferred that the farmers who were tenants and relying only on agriculture as their primary income source were technically more efficient as compared to others but the results for both the variables were insignificant. Generally, the tenants incur more variable cost in a production process as they face more economic burden of paying annual land rent and it makes them more responsible to fight on their behalf and get some tremendous amount of yield (Ahmad et al., 2002). Shaheen et al. (2017), Wahid et al. (2017) and Taraka et al. (2010) found the same impact of tenure status on technical inefficiency.
Frequency distribution of individual rice growers’ technical efficiency
Table 7 depicts the technical efficiency’s frequency distribution of the sampled rice farmers. The mean technical efficiency of the sampled farmers was estimated at 0.74, ranging within 0.52 and 0.99. These findings affirmed that the rice growers had still the potential to raise their rice production by 74 percent with the existing technology. The average technical efficiency of the rice growers in current study is almost equal to that of Kolawole and Ojo (2007), Ogandri (2008), Hossain et al. (2008) with their relative efficiencies of 73, 75 and 75 respectively. Similarly, the efficiency estimated in this study is less than the efficiencies estimated by Khan et al. (2010), Nchare (2007), Abedullah et al. (2006) and Hasan and Islam (2010) with the score of 91, 89, 84 and 84 respectively and greater than that of Dolisca and Jolly (2008), Ali and Munir (2014), Tchale (2009) and Gul et al. (2009) with the mean efficiencies of 63, 62, 53 and 20 respectively. The efficiency’s score for each and every sampled respondent was estimated and categorized into four groups. The statistics showed that most of the rice farmers (39%) were in the range of 0.80 and 0.90 efficiency’s score, 35.6 percent had technical efficiency greater than 0.90, 18 percent were having efficiency within the range of 0.65 and 0.80 while 7.3 percent respondents’ efficiency ranged within 0.52 and 0.65.
Table 7: Frequency distribution of individual rice growers’ technical efficiency.
|
Technical efficiency |
Frequency |
%age |
|
0.52-0.65 |
22 |
7.33 |
|
0.65-0.80 |
54 |
18.0 |
|
0.80-0.90 |
117 |
39.0 |
|
0.90-1.00 |
107 |
35.6 |
|
Mean 0.74 |
||
|
Maximum 0.99 |
||
|
Minimum 0.52 |
||
Source: Author’s estimates for rice data, 2020.
Conclusions and Recommendations
The findings of the study revealed that the average rice grain yield in the study area was 1573.27 kgs acre-1. Rice growers were reasonably profitable as the profitability ratio of 1.17 revealed that a single rupee investment on rice farming created a profit of Rs. 1.17. All the estimated coefficients of SFM-1 except no. of irrigation were highly significant with the estimated values of 0.369, 0.047, 0.060, 0.246 and 0.098 for labor hours, tractor hours, chemicals, and urea and irrigation numbers respectively. The estimates of SFM-2 for inefficiency of the rice growers revealed that age, rice farming experience and education had a significant effect on technical inefficiency of the farmers while tenancy status and primary source of income had no significant effect on farmers’ inefficiency. On average the farmers were 74 percent technically efficient, ranging from 0.52 to 0.99 and the estimated 0.80 value of gamma (variance parameter) implied that 80% deviation of the observed rice yield from frontier-level output was because of the sampled rice growers’ inefficiency.
As the estimated production model showed the highest coefficients for labor hours and urea, it is therefore suggested that rice growers can rise their rice output by increasing labor hours and urea application during the production process. Inefficiency effects model indicated negative and significant relationship of inefficiency with farmers’ education and farming experience, so government needs to facilitate farmers with formal as well as informal education along with proper trainings regarding rice farming. Moreover, extension department needs to arrange gatherings in rice producing areas for sharing skills of experienced farmers with the farming community.
Novelty Statement
Education and farming experience, among other factors, plays important role in enhancing efficiency of raising crops. This study, therefore, estimated and examined the effects of these factors in affecting technical efficiency of the rice crop growers in Khyber Pakhtunkhwa province of Pakistan.
Author’s Contribution
Shahid Ali: Developed main theme of the study, wrote title of the study, objectives and constructed interview schedule. Helped in interpretation of results and recommendations write up.
Murtaza: Reviewed literature, wrote conceptual framework, specified the model and wrote results and discussion.
Waqas Ahmad: Collected data and punched in excel sheet and helped in review of literature.
Nargis Bibi: Helped in writing abstract, materials and methods, conclusions, and recommendations. Wrote and corrected references.
Aftab Khan: Helped in developing interview schedule and writing results and discussion.
Jahangir Khan: Compared results with the findings of other studies and discussed comparison of results.
All authors read and approved the final manuscript.
Conflict of interest
The authors have declared no conflict of interest.
References
Abasi, N., A. Etim, D. Thompson and C.E Onyenweaku. 2013. Measuring efficiency of yam production among resources poor farmers in rural Nigeria. JAFS, 1(3): 42-47.
Abedullah, S.K. and M. Khalid. 2007. Analysis of technical efficiency of rice production in Punjab (Pakistan): Implications for future investment strategies. Pak. Econ. Soc. Rev., 231-244.
Abedullah, S.K. and K. Mushtaq. 2010. Environmental efficiency analysis of basmati rice production in Punjab, Pakistan: Implications for sustainable agricultural development. Pak. Dev. Rev., 49(1): 57-72. https://doi.org/10.30541/v49i1pp.57-72
Achandi, E. L. 2018. Technical efficiency: A study of smallholder rice farmer in Kilombero district, Tanzania. J. Econ. Bibliograph., 5(3): 193-208.
Ahmad, M., G.M. Chaudhry and M. Iqbal. 2002. Wheat productivity, efficiency, and sustainability: A stochastic production frontier analysis. Pak. Dev. Rev., 643-663. https://doi.org/10.30541/v41i4IIpp.643-663
Ahmadu, J. and P.O. Erhabor. 2012. Determination of technical efficiency of rice farmers in Taraba state Nigeria. Nigerian J. Agric. Food Environ., 8(3):78-84.
Aigner, D.J. and S.F. Chu. 1968. On estimating the industry production function. Am. Econ.Rev., 58(4): 826-839.
Aigner, D.J., C.A.K. Lovell and P. Schmidt. 1977. Formulation and estimation of stochastic frontier production function models. J. Econ., 6(1): 21–37. https://doi.org/10.1016/0304-4076(77)90052-5
Ali, S. and M. Khan. 2014. Technical efficiency of wheat production in District Peshawar, Khyber Pakhtunkhwa, Pakistan. Sarhad J. Agric., 30(4): 433-441.
Arora, A., S. Bansal and P.S. Ward. 2019. Do farmers value rice varieties tolerant to droughts and floods? https://globalwaterforum.org/2018/09/17/do-farmers-value-rice-varieties-tolerant-to-droughts-and-floods-evidence-from-a-discrete-choice-experiment-in-odisha-india/
Backman, S., K.Z. Islam, J. Sumelius. 2011. Determinants of technical efficiency of rice farms in North-Central and North-Western Regions in Bangladesh. J. Dev. Areas, 45(1): 73-94. https://doi.org/10.1353/jda.2011.0001
Balde, B.S., H. Kobayashi, M. Nohmi, A. Ishida, M. Esham and E. Tolno. 2014. An analysis of technical efficiency of mangrove rice production in the Guinean Coastal Area. J. Agric. Sci., 6(8): 179-196. https://doi.org/10.5539/jas.v6n8p179
Belbase, K. and R. Grabowski. 1985. Technical efficiency in Nepalese agriculture. J. Dev. Areas, 19(4): 515-525.
Bempomaa, B. and H.D.G. Acquah. 2014. Technical efficiency analysis of maize production: evidence from Ghana. APSTRACT. Appl. Stud. Agribus. Commerce, 8(2-3): 73-79. https://doi.org/10.19041/APSTRACT/2014/2-3/9
Bravo-Ureta, E. Boris, and L. Rieger. 1991. Dairy farm efficiency measurement using stochastic frontiers and neoclassical duality. Am. J. Agric. Econ., 73(2): 421–428. https://doi.org/10.2307/1242726
Chen, Z., Q. Wang, J. Ma, P. Zou and L. Jiang. 2020. Impact of controlled-release urea on rice yield, nitrogen use efficiency and soil fertility in a single rice cropping system. Sci. Rep., 10, 10432. https://doi.org/10.1038/s41598-020-67110-6
Coelli, T., J. Rao, D.S.P. Donnell and C.J. Battese. 2005. An introduction to efficiency and productivity analysis. 2nd Edition. New York: Springer.
Coelli, T.J. and G.E. Battese. 1996. Identification of Factors which Influence the Technical Inefficiency of Indian Farmers. Aus. J. Agric. Econ., 40(2): 103-128. https://doi.org/10.1111/j.1467-8489.1996.tb00558.x
Dolisca, F. and C.M. Jolly. 2008. Technical efficiency of traditional and nontraditional crop production: A case study from Haiti. World. J. Agri. Sci., 4(4): 416-426.
Farrell, M. 1957. The measurement of productivity Efficiency. J. Royal Stat. Soc., 120(3): 253–90. https://doi.org/10.2307/2343100
GoKP. 2018. Crop Reporting Services, 2017-18. Agriculture Livestock and Cooperation Department.
GoP. 2020. Pakistan Economic Survey, 2019-20. Economic advisory wing, Finance division. Government of Pakistan, Islamabad, Pakistan.
GoKP. 2018. Development Statistics of Khyber Pakhtunkhwa, 2018. Bureau of Statistics, Planning and Development Department, Government of Khyber Pakhtunkhwa.
Greene, W.H. 1980. Maximum likelihood estimation of econometric frontier functions. J. Econ., 13(1): 27–56. https://doi.org/10.1016/0304-4076(80)90041-X
Gul, M., B. Koc, E. Dagistan., M.G. Akpinar and O. Parlakay. 2009. Determination of technical efficiency in cotton growing farms in Turkey: A case study of Cukurova region. Afr. J. Agric.Res., 4(10): 944-949.
Jan, S.A.K. and N. Khan. 2019. Determinants of rice productivity in district lower Dir, Khyber Pakhtunkhwa, Pakistan. Sarhad J. Agric., 35(1): 253-263. http://dx.doi.org/10.17582/journal.sja/2019/35.1.253.263
Hadi, N.A., S. Ali and U. Wahid. 2018. Estimation of technical efficiency of broiler farms in District Mardan, Khyber Pakhtunkhwa. Sarhad J. Agric., 34(2): 349-358. https://doi.org/10.17582/journal.sja/2018/34.2.349.358
Hasan and Islam. 2010. Technical inefficiency of wheat production in some selected areas of Bangladesh. Bangladesh J. Agric. Res., 35(1): 101-112. https://doi.org/10.3329/bjar.v35i1.5871
Hassan, S. 2005. Stochastic frontier production, application hypothesis testing. Int. J. Agric. Econ., 7(3): 427-430.
Hassan, S., and B. Ahmad. 2005. Technical efficiency of wheat farmers in mixed farming system of the Punjab, Pakistan. Int. J. Agric. Biol., 7(3): 431-435.
Heriqbaldi, U., R. Purwono, T. Haryanto, and M. R. Primanthi. 2015. An analysis of technical efficiency of rice production in Indonesia. Asian Soc. Sci., 11(3): 91-102. https://doi.org/10.5539/ass.v11n3p91
Hewitt, H.G. 2004. Outlooks on pest management, 2004 (15): 90-95. https://doi.org/10.1564/15apl13
Hossain, M.A., M.K. Hasan and Q. Naher. 2008. Assessment of technical efficiency of potato producers in some selected areas of Bangladesh. J. Agric. Rural Dev., 6(1&2): 113-118. https://peshawarhighcourt.gov.pk/app/site/52/c/District_Courts.html.
Idiong, I.C. 2007. Estimation of Farm level technical efficiency in small scale swamp rice production in cross river state of Nigeria: A stochastic frontier approach. World J. Agric. Sci., 3(5): 653-658.
Kabir, H., M. Musharraf, M.M. Haque and M. Khan. 2015. Technical efficiency of Boro rice production in Bangladesh: A case of bio-slurry application. J. Bangladesh Agric. Univ., 13(1): 101–108. https://doi.org/10.3329/jbau.v13i1.28725
Kadiri, F.A., C.C. Eze, J.S. Orebiyi, J.I. Lemchi, D.O. Ohajianya and I.U. Nwaiwu. 2014. Technical efficiency in paddy rice production in the Niger Delta Region of Nigeria. Glob. J. Agric. Res., 2(2): 33-43.
Kea, S., H. Li and L. Pich. 2016. Technical efficiency analysis of Cambodian household’s rice production. Glob. J. Human Soc. Sci. Econ., 16(3):1-11.
Kebede, T. A. 2001. Farm Household Technical Efficiency: A stochastic frontier analysis: A study of rice producers in Mardi Watershed in the Western Development Region of Nepal. Thesis/Dissertation. The University of Bergen.
Khai, H.V. and M. Yabe. 2011. Technical efficiency analysis of rice production in Vietnam. J. ISSAAS, 17(1):135-146.
Khan, A., F.A. Huda and A. Alam. 2010. Farm household technical efficiency: A study on rice producers in selected areas of Jamalpur District in Bangladesh. Eu. J. Soc. Sci., 14(2): 262-271.
Kolawole, O. and S.O. Ojo. 2007. Economic efficiency of small-scale food crop production in Nigeria: A stochastic frontier approach. J. Soc. Sci., 14(2): 123–130. https://doi.org/10.1080/09718923.2007.11978363
Kopp, R.J. and W.E. Diewert. 1982. The decomposition of frontier cost functions deviations into measures of technical and allocative Efficiency. J. Econ., 19(2-3):319-331. https://doi.org/10.1016/0304-4076(82)90008-2
Lema, T.Z., S.A. Tessema and F.A. Abebe. 2017. Analysis of the technical efficiency of rice production in Fogera District of Ethiopia: A stochastic frontier approach. Ethiopian J. Econ., 26(2): 90-107.
Meeusen, W. and J.V.D. Broeck. 1977. Efficiency estimation from Cobb-Douglas Production Function with composed error. Int. Econ. Rev., 18(2): 435–44. https://doi.org/10.2307/2525757
Murtaza, S.A. Shah, S. Ali, A. Ali and A. Baig. 2020. Economic analysis of maize production in central Khyber Pakhtunkhwa, Pakistan. Sarhad J. Agric., 36(3): 966-973. https://doi.org/10.17582/journal.sja/2020/36.3.966.973
Narala, A. and Y.C. Zala. 2010. Technical efficiency of rice farms under irrigated conditions in central Gujarat. Agric. Econ. Res. Rev., 23: 375-381.
Nchare, N. 2007. Analysis of factors affecting technical efficiency of Arabica coffee in Camroon. Afr. Econ. Consortium, Nairobi, AERC Research paper No. 163.
Ogandri, K. 2008. Resource productivity, allocative efficiency and determinants of technical efficiency of rain fed rice farmers: A guide for food security policy in Nigeria. Agric. Econ., 54(5): 224-233. https://doi.org/10.17221/246-AGRICECON
Ogundele, O.O. and V.O. Okoruwa. 2006. Technical efficiency differentials in rice production technologies in Nigeria. AERC Research Paper, 154 African Economic Research Consortium, Nairobi, Kenya.
Orewa, S.I. and O.B. Izekor. 2012. Technical efficiency analysis of yam production in Edo State Nigeria. IJDS. 1(2): 516-526.
Reddy, A.R. and C. Sen. 2004. Technical inefficiency in rice production and its relationship with farm-specific socio-economic characteristics. Ind. J. Agric. Econ., 59(2): 259-267.
Schmidt, P. 1986. Frontier production functions. Econ. Rev., 4(2): 289–328. https://doi.org/10.1080/07474938608800089
Shaheen, S., H. Fatima and M.A. Khan. 2017. Technical efficiency analysis of rice production in Pakistan under dry and puddle conditions: A case study of selected districts of Punjab province, Pakistan. Sarhad J. Agric., 33(3): 447-458. https://doi.org/10.17582/journal.sja/2017/33.3.447.458
Shapiro, K.H. 1977. Sources of technical efficiency: The roles of modernization and information. Econ. Dev. Cult. Change, 25(2): 293-310. https://doi.org/10.1086/450948
Sikdar, M.M.H., M.A. Alam and M.I. Hossain. 2008. Factors affecting the technical efficiency of Boro rice production in Bangladesh a Cobb-Douglas stochastic frontier analysis. J. Bangladesh Agril. Univ., 6(1): 215-226.
Smith, D. and J. Hornbuckle. 2013. A Review of rice productivity in Cambodia and water measurement using direct and indirect methods on a dry season rice crop, Technical Report to ACIAR, Canberra, CSIRO Sustainable Agriculture Flagship, Australia.
Sowunmi, F.A. and J.O. Akintola. 2009. Effect of climatic variability on maize production in Nigeria. Resh. J. Environ. Earth Sci., 2(1): 19-30.
StataCorp. 2019. Stata Statistical Software: Release 16. College Station, TX: StataCorp LLC.
Subedi, S., Y.N. Ghimire, M. Kharel, S.P. Adhikari, J. Shrestha and B.K. Sapkota. 2020. Technical efficiency of rice production in Terai district of Nepal. J. Agric. Nat. Resour., 3(2): 32-44. https://doi.org/10.3126/janr.v3i2.32301
Taraka, K., M.N. Shamsudin, I.A. Latif and S.B.A. Sidique. 2010. Estimation of technical efficiency for rice farms in central Thailand using stochastic frontier approach. Asian J. Agric. Dev., 9(2): 1-11.
Tchale, H. 2009. The efficiency of small-holders agriculture in Malawi. AFJARE, 3(2): 101–121.
Wahid, U., S. Ali and N.A. Hadi. 2017. On the estimation of technical efficiency of tomato growers in Malakand, Pakistan. Sarhad J. Agric., 33(3): 357-365. https://doi.org/10.17582/journal.sja/2017/33.3.357.365
Yamane, T. 1967. Statistics, An Introductory Analysis. 2nd Ed., Harper and Row, New York.
Yu, B. and X. Diao. 2011. Cambodia’s agricultural strategy: Future development options for the rice sector. Phnom Penh, Cambodia, A policy discussion paper of Cambodia Development Resource Institute (CDRI).
To share on other social networks, click on any share button. What are these?