

Effect of Feeding Methods on Rumen Bacterial Flora in Chinese Tan Sheep Based on 16S rDNA High-throughput Analysis


Effect of Feeding Methods on Rumen Bacterial Flora in Chinese Tan Sheep Based on 16S rDNA High-throughput Analysis
Jie Zhang, Na Li, Tingting Guo, Dandan Hu, Xiaofeng XU and Lili Zhang*
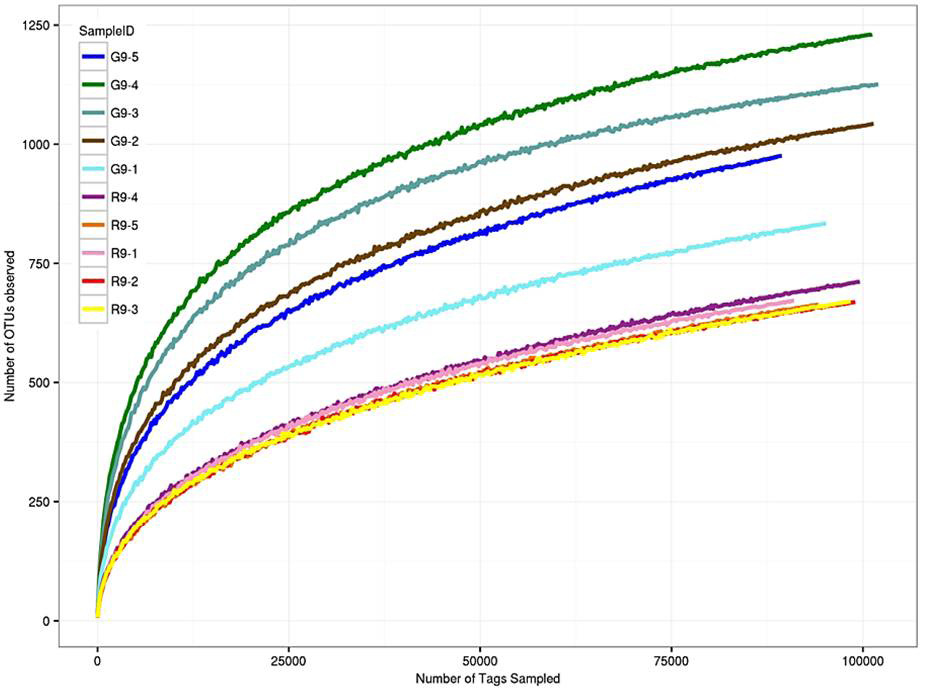
Relationship between sequencing depth and number of OTUs (organizational taxonomic unit) for bacteria in rumen samples of grazed (G9) and house-raised (R9) Tan sheep. Different colored lines identify different samples by sample identification (ID) number.

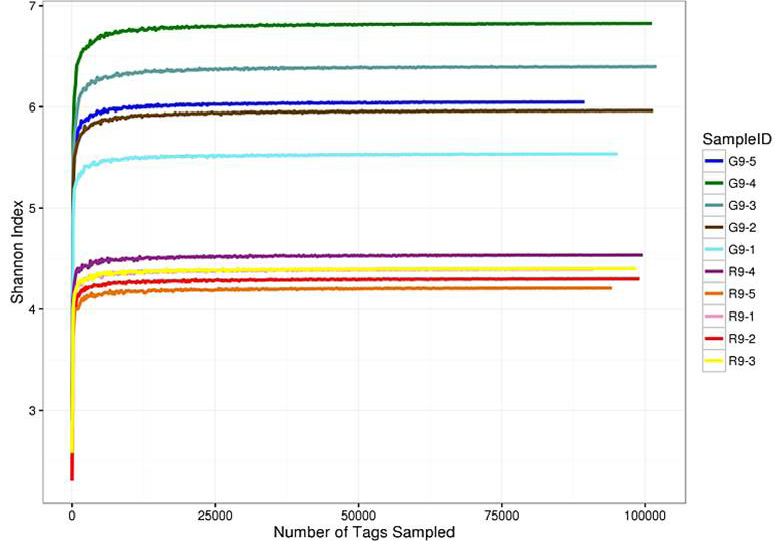
Relationship between Shannon and number of OTUs (organizational taxonomic unit) for bacteria in rumen samples of grazed (G9) and house-raised (R9) Tan sheep. Different colored lines identify different samples by sample identification (ID) number.

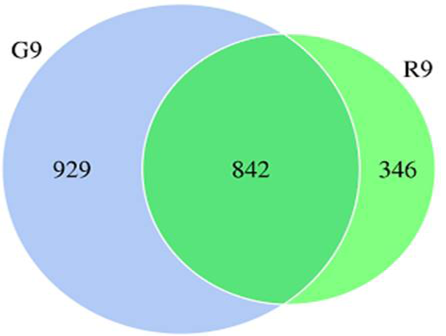
Venn diagram of common and unique rumen microorganism 0TUs in grazed (G9) and house-raised (R9) Tan sheep. Blue represents the OTUs of grazing group and green represents the OTUs of house-raising group, the intersecting part is a common OTUs.

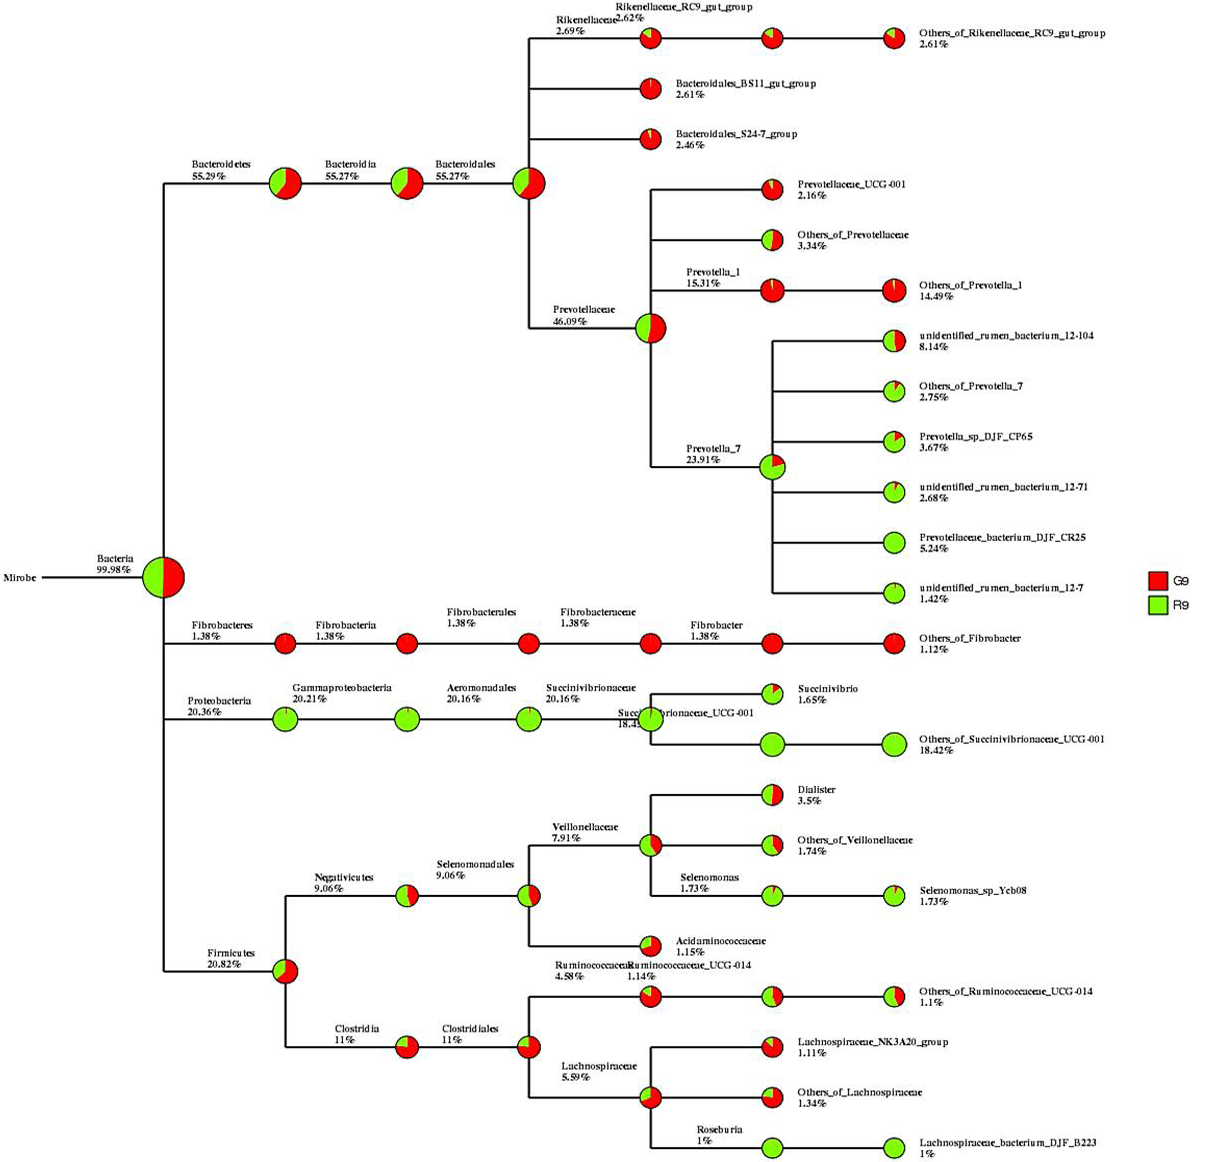
Species classification of rumen microorganisms in both grazed (G9) and house-raised (R9) Tan sheep. Red represents the grazing group and green represents the house-raising group, and different branches represent different classification levels, successively including boundary, phylum, class, order, family, genus and species.

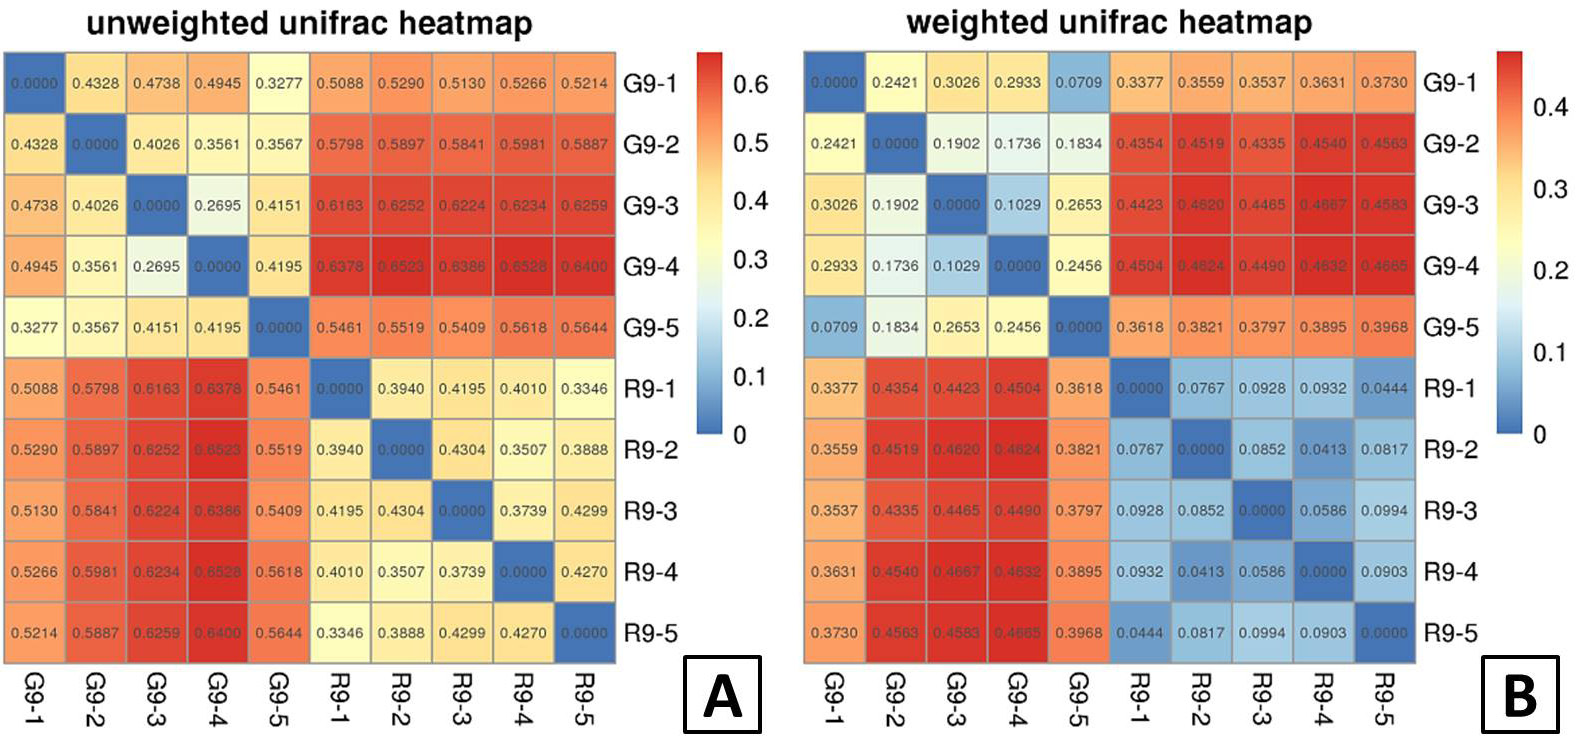
Heat map of microbial Beta diversity index in rumen of grazed (G9) and house-raised (R9) Tan sheep. The color ranges from blue to red representing the range of 0 ~ 0.5. The larger the value, the greater the species abundance. A, unweighted; B, weighted.
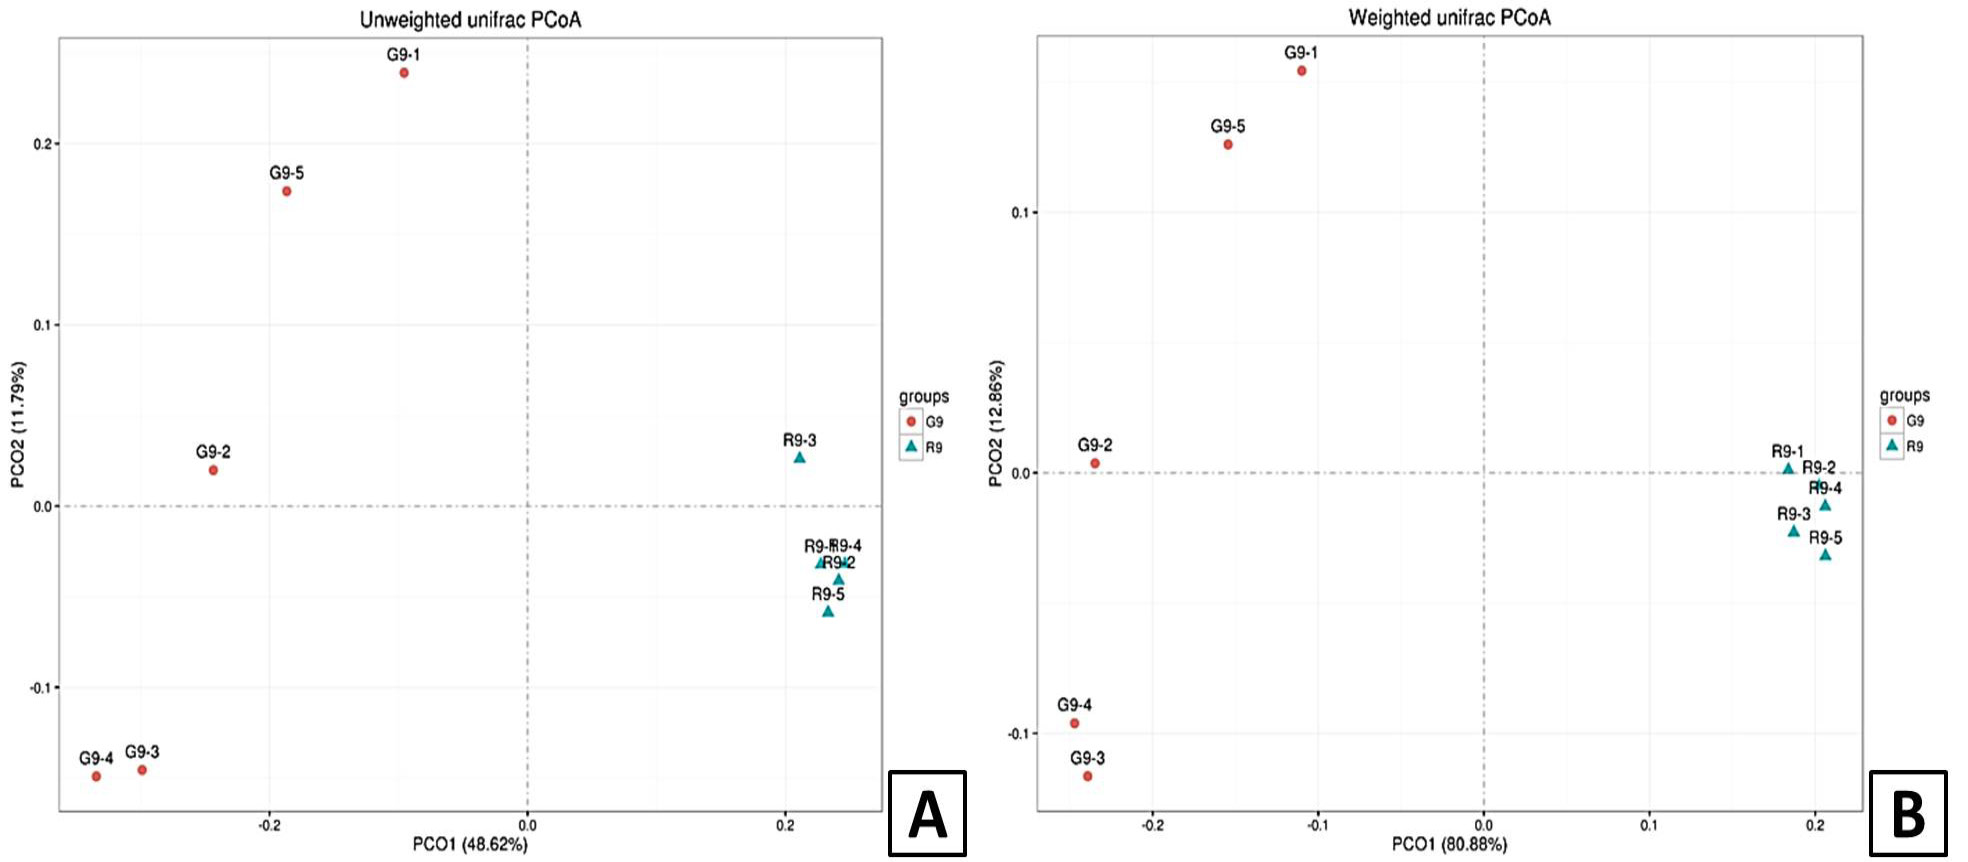
PCoA (principal co-ordinates analysis) of rumen microorganisms in grazed (G9) and house-raised (R9) Tan sheep. The red circles represent grazing samples and the blue triangles represent house-raising samples. A, unweighted; B, weighted.
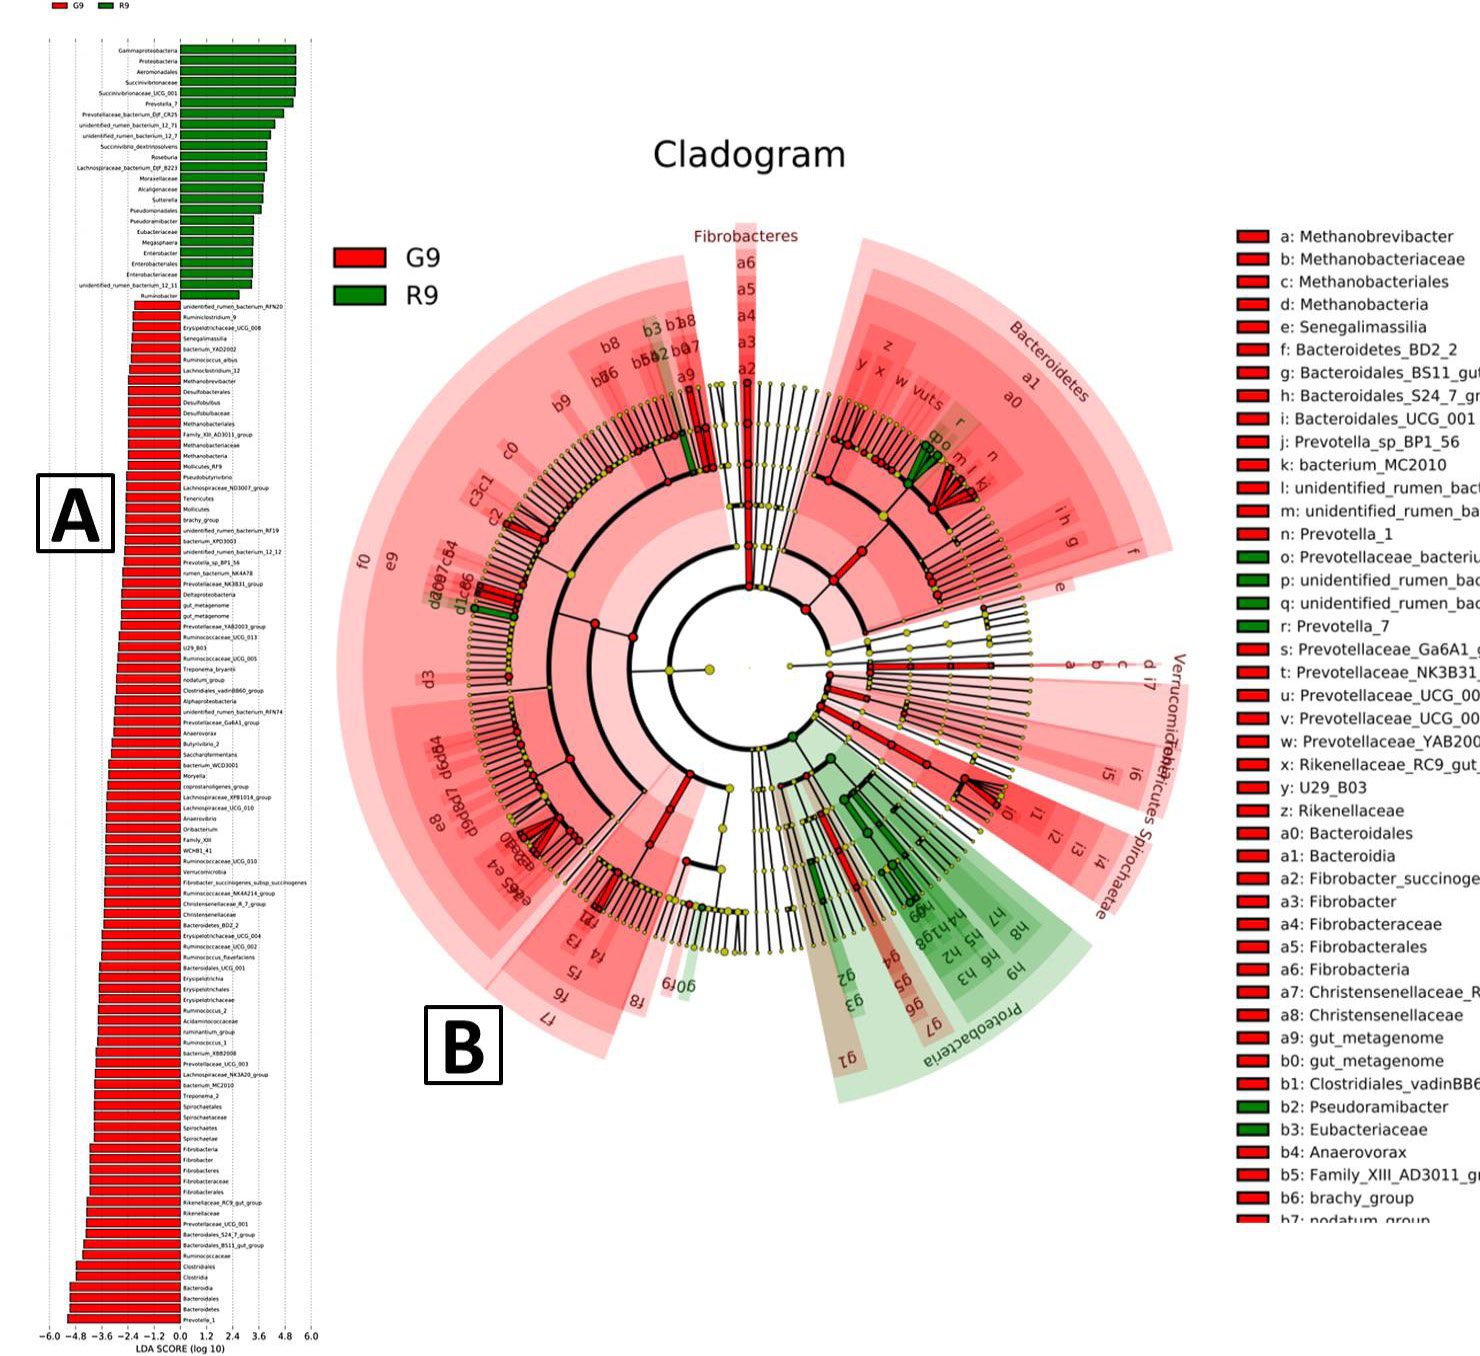
Rumen microorganism LEFse difference analysis of grazed (G9) and house-raised (R9) Tan sheep. Red represents the grazing group and green represents the house-raising group. A, linear discriminant analysis (LDA); B, evolutionary branching. In the evolutionary branching diagram, the circles that radiate from inside to outside represent the taxonomic level from phylum to genus (or species). Each small circle at the different classification levels represents a classification at that level. The diameter of the small circle is proportional to the relative abundance. For the coloring scheme, the species that are not significantly different are uniformly colored yellow.

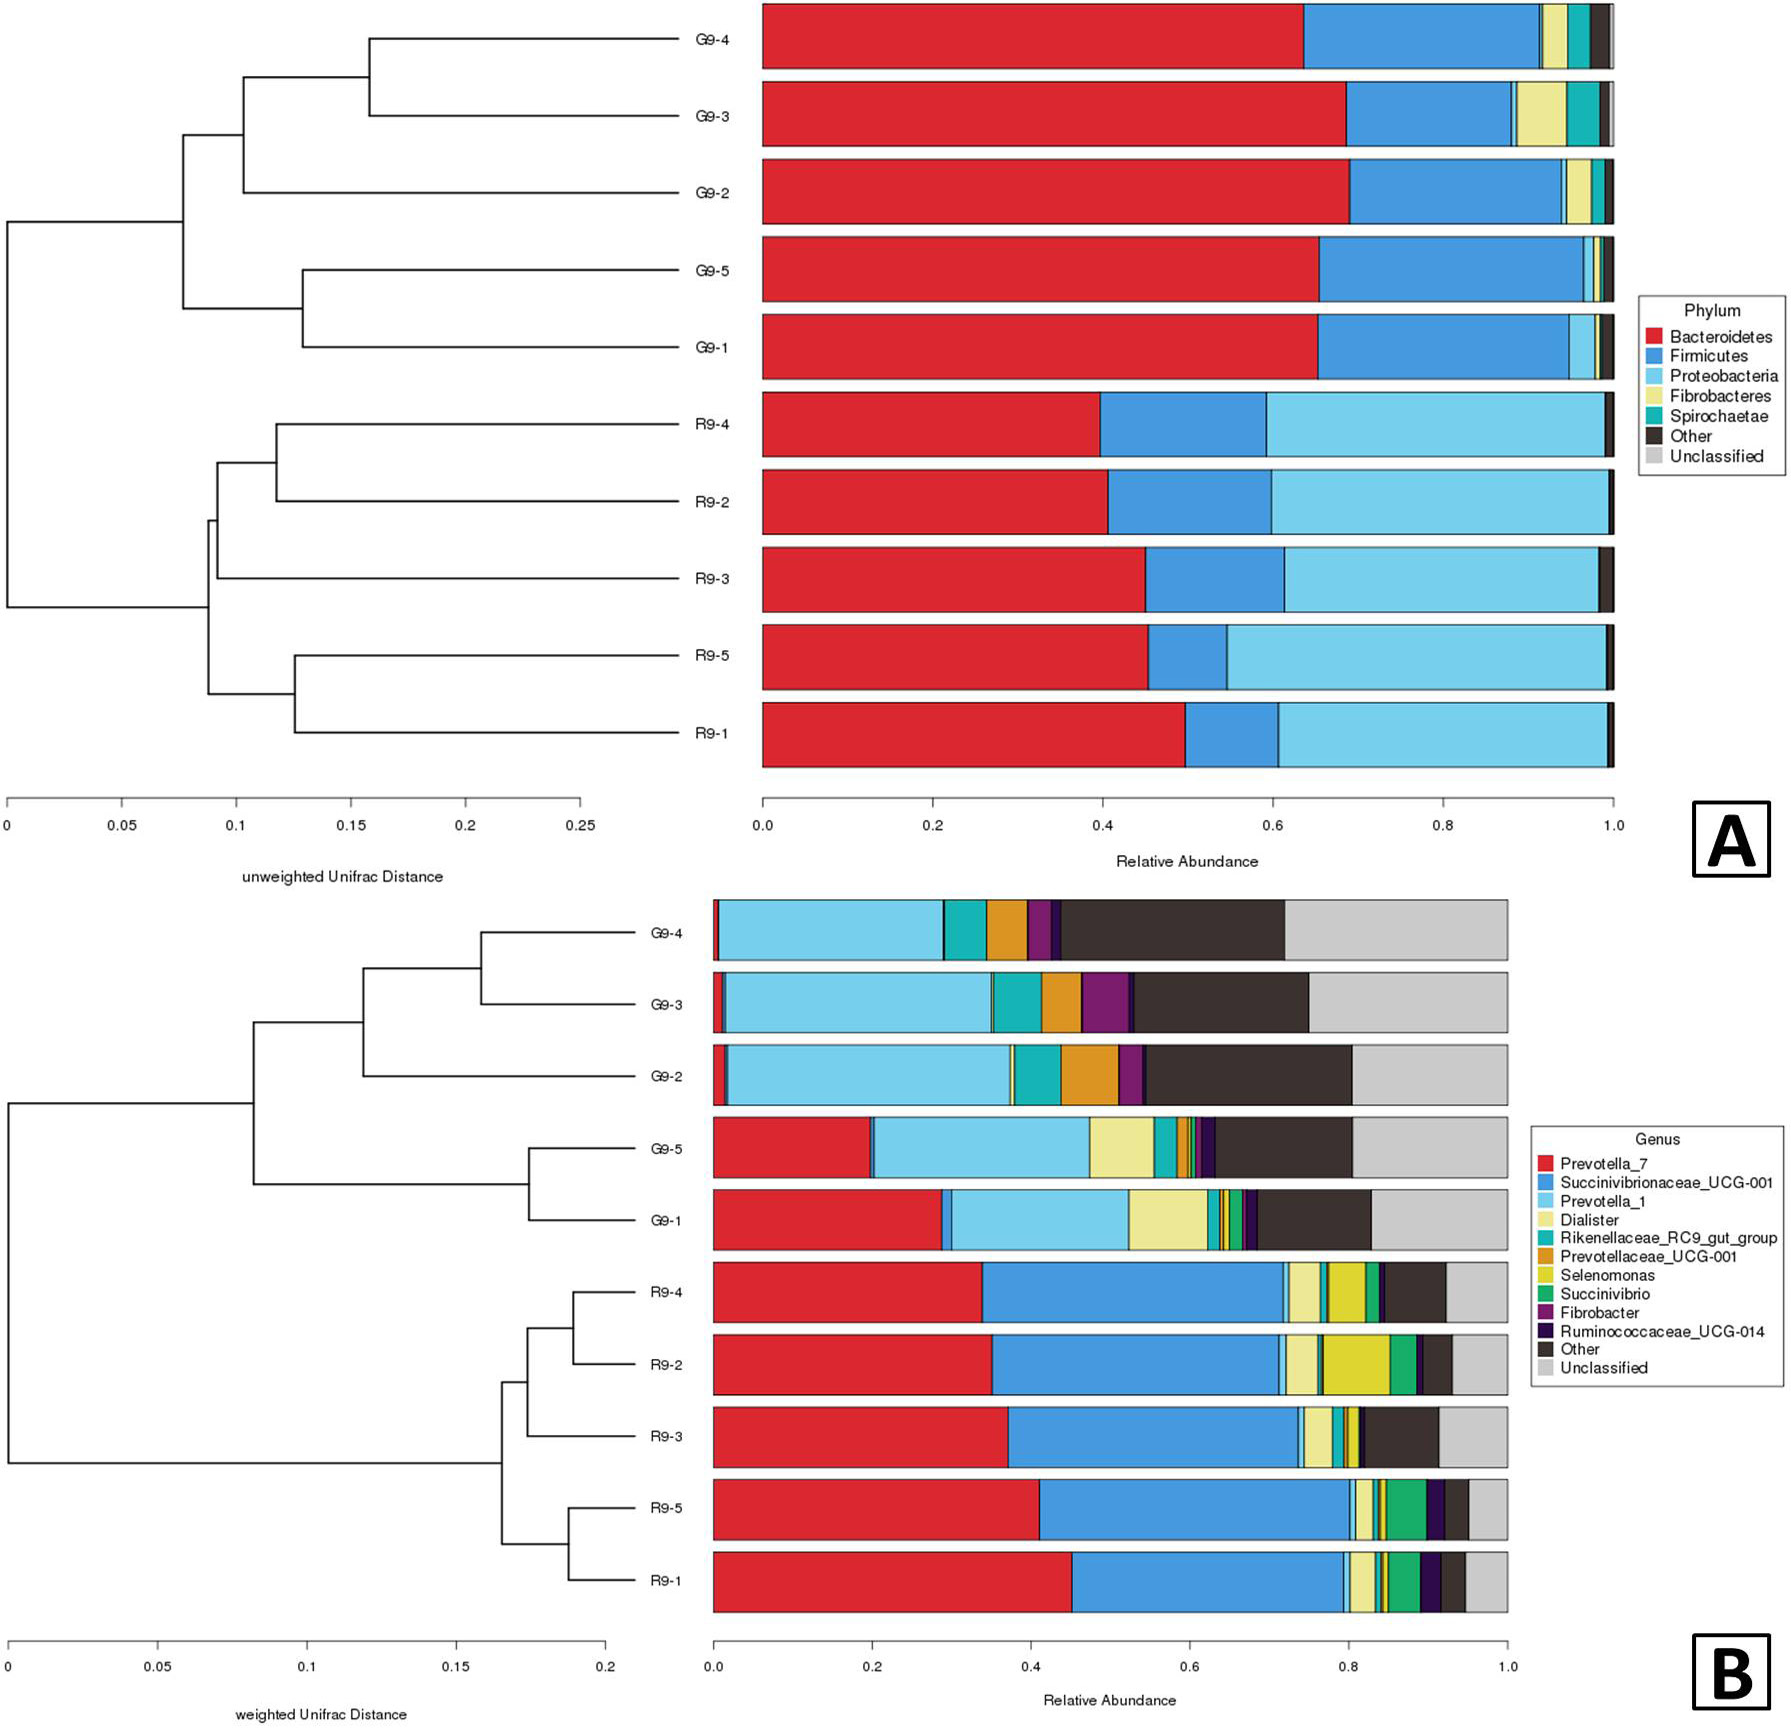
UPGMA (unweighted pair-group method with arithmetic means) cluster analysis of rumen microorganisms in grazed (G9) and house-raised (R9) Tan sheep. A, the phylum level, different colors represent different phylum; B, shows the genus level, different colors represent different genera. The closer the branch distance is, the higher the similarity between samples will be.

