
RETRACTED: Enhancing Grain Yield and Improving Oil Quality of Canola Through the Application of Sulfur and Nitrogen in Agro-Climatic Condition of Peshawar, Pakistan

RETRACTED: Enhancing Grain Yield and Improving Oil Quality of Canola Through the Application of Sulfur and Nitrogen in Agro-Climatic Condition of Peshawar, Pakistan
Muhammad Bakhtiar1*, Fayaz Ali Niaz2, Asim Muhammad2, Mamoona Munir3, Wajiha Seerat4, Sadiqullah Khan5, Ghulam Yaseen6, Muhammad Noman Khan7 and Asma Bibi8
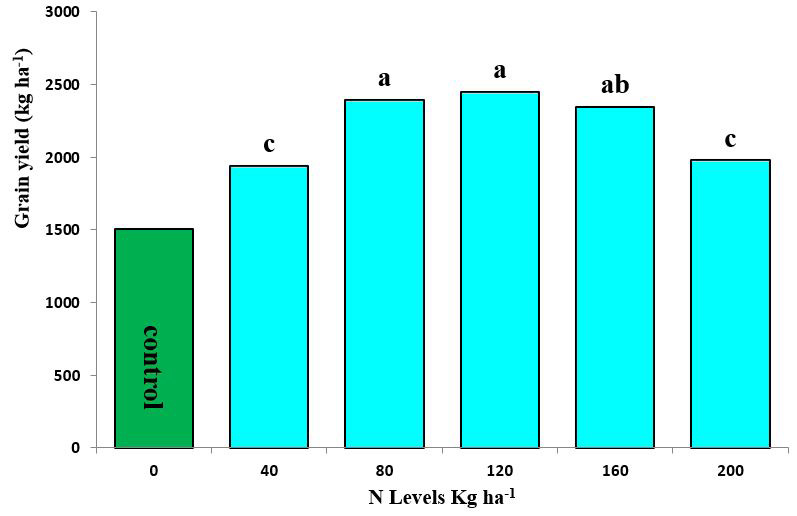
Grain yield (kg ha-1) as affected by different N levels. Different letters over the vertical bars represent means significant difference within each category.

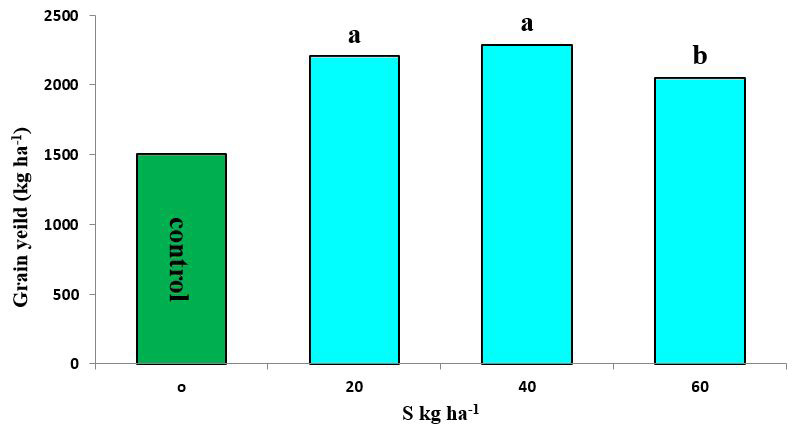
Grain yield (kg ha-1) as affected by different S levels. Different letters over the vertical bars represent means significant difference within each category.
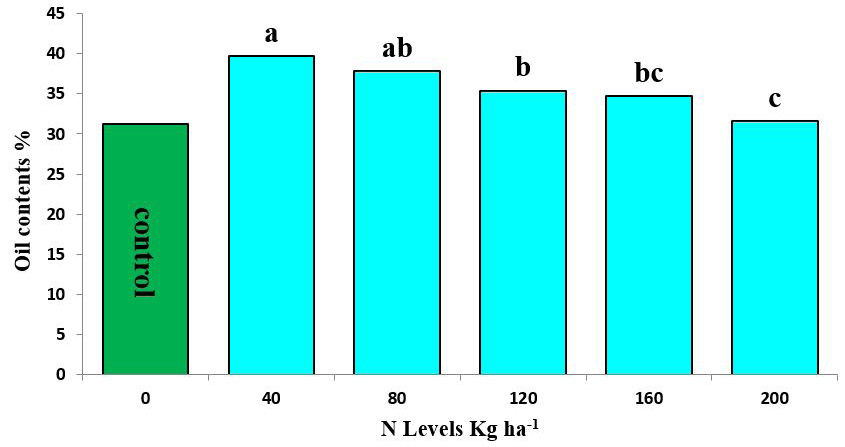
Oil contents (%) as affected by different N levels. Different letters over the Vertical bars represent means significant difference within each category.
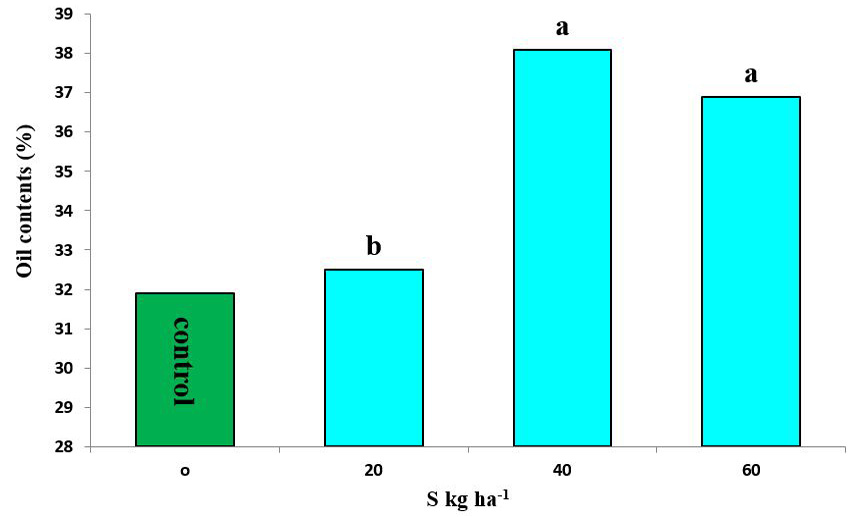
Oil contents (%) as affected by different S levels. Different letters over the vertical bars represent means significant difference within each category.
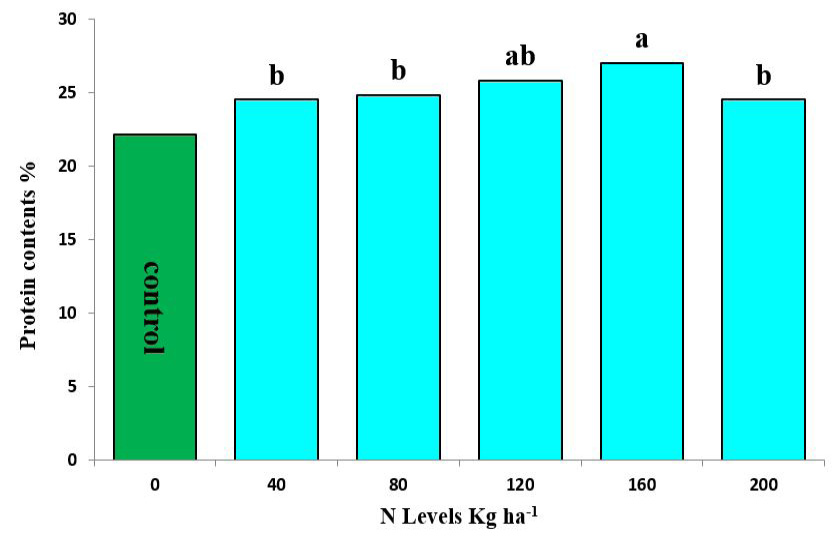
Protein contents (%) as affected by different N levels. Different letters over the vertical bars represent means significant difference within each category.
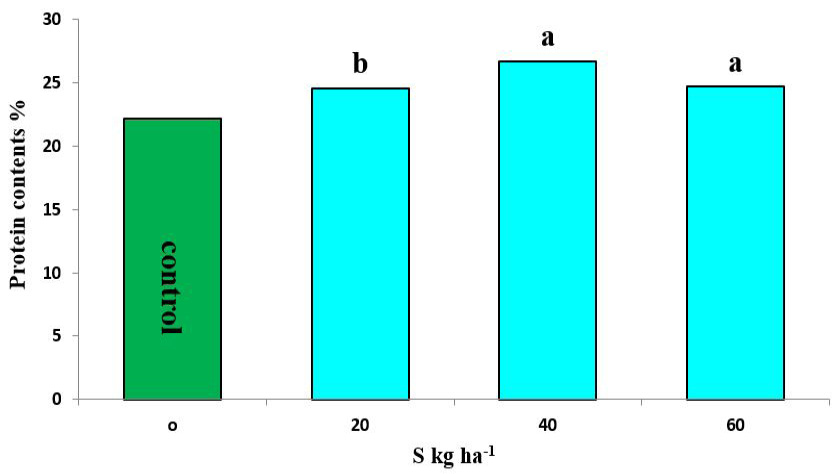
Protein contents (%) as affected by different S levels. Different letters over the vertical bars represent means significant difference within each category.

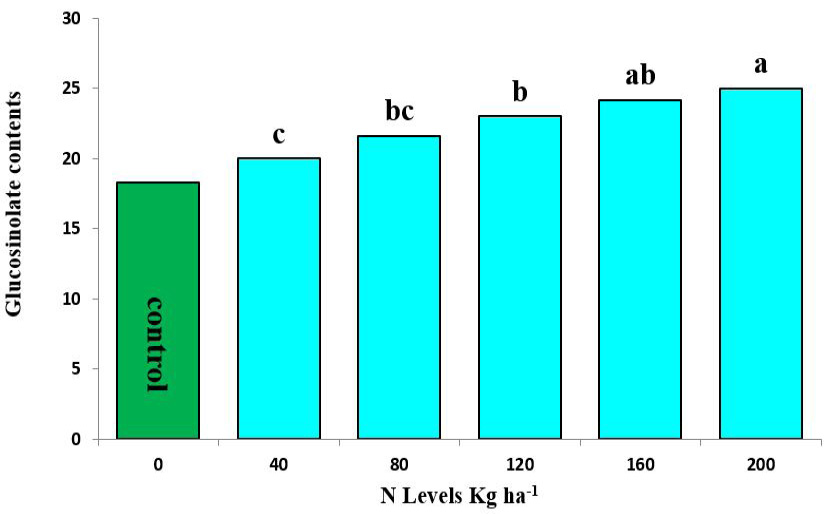
Glucosinolate content (μ mol g-1) as affected by different N levels. Different letters over the vertical bars represent means significant difference within each category.
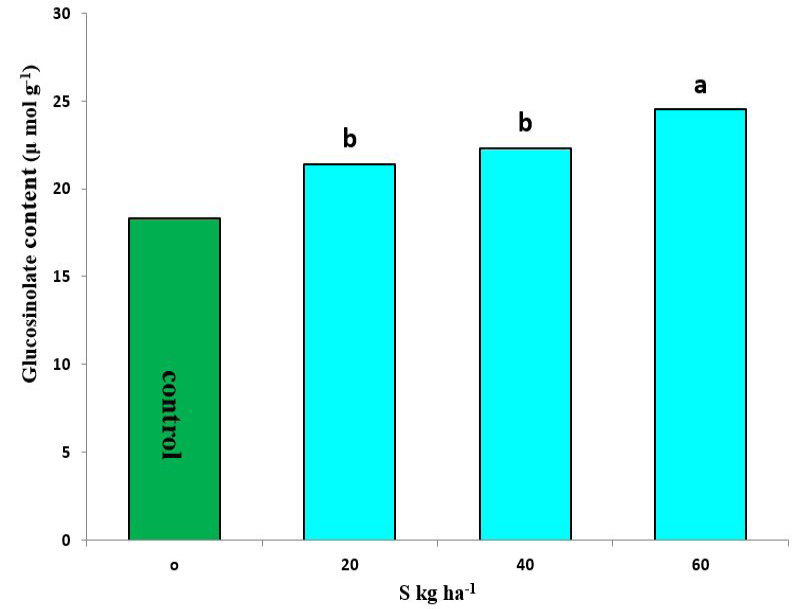
Glucosinolate content (μ mol g-1) as affected by different S levels. Different letters over the vertical bars represent means significant difference within each category.
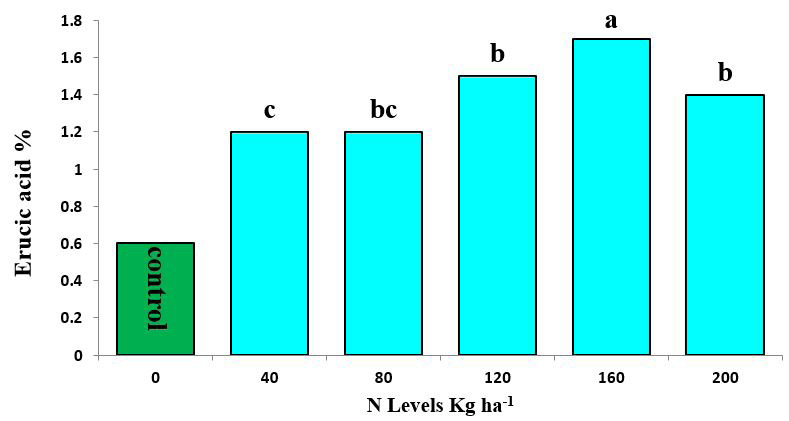
Erucic acid (%) as affected by different N levels. Different letters over the vertical bars represent means significant difference within each category.
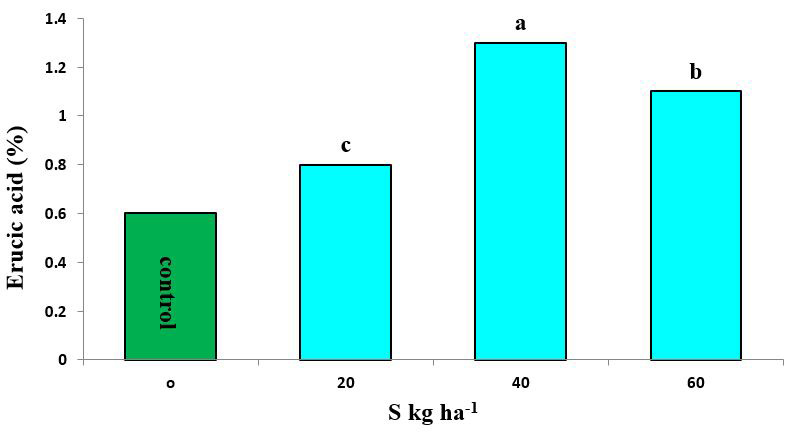
Erucic acid (%) as affected by different S levels. Different letters over the vertical bars represent means significant difference within each category.

