
Examination of Morphological, Behavioral and Histopathological Effects on Oreochromis niloticus after Acute Exposure to Methylmercury

Examination of Morphological, Behavioral and Histopathological Effects on Oreochromis niloticus after Acute Exposure to Methylmercury
Aqsa Pervaiz1*, Rukhshanda Afridi1, Zahra Pervaiz1, Rabia Masood1 and Hira Pervaiz2
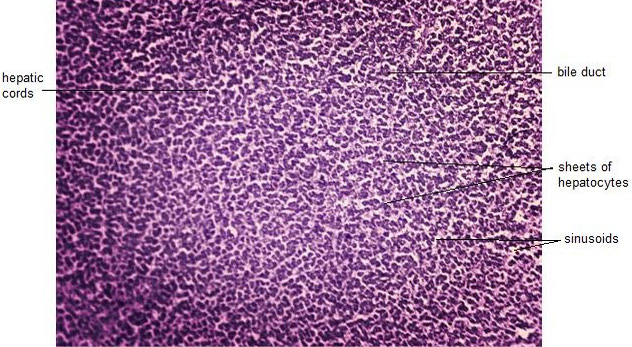
Photomicrograph of T.S. of liver of group A (control group) showing compact hepatocytes, bile duct, hepatic cords and sinusoids, H and E, (40x).
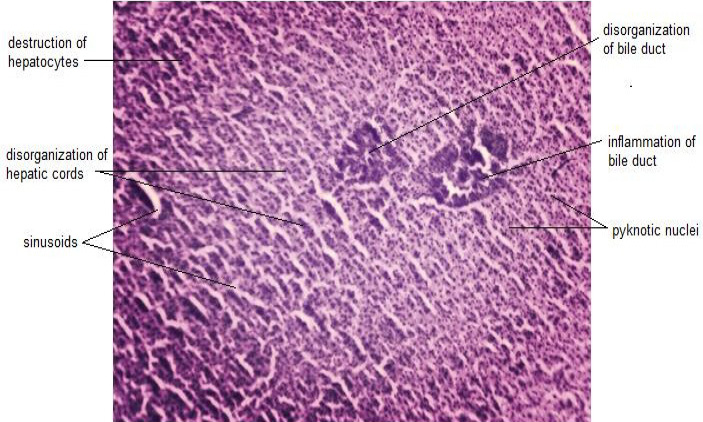
Photomicrograph of T.S. of liver of group-B (experimental) after 48 hours, showing pyknotic nuclei, disorganization of hepatic cords, inflammation of bile duct, disorganization of bile duct, destruction of hepatocytes and sinusoids, H and E, (40x).
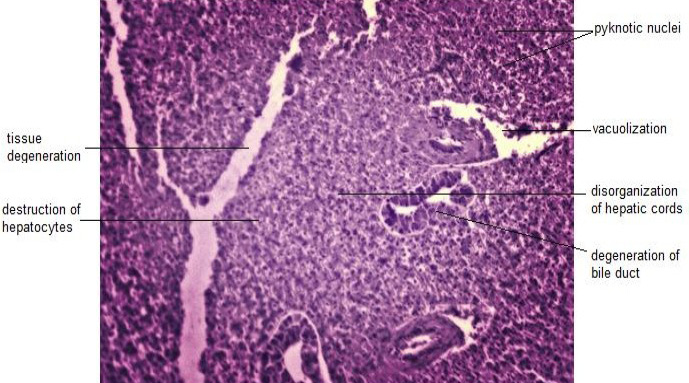
Photomicrograph of T.S. of liver of group-C (experimental) after 48 hours, showing pyknotic nuclei, tissue degeneration, disorganization of hepatic vessel, degeneration of bile duct and vacuolization, H and E, (40x).
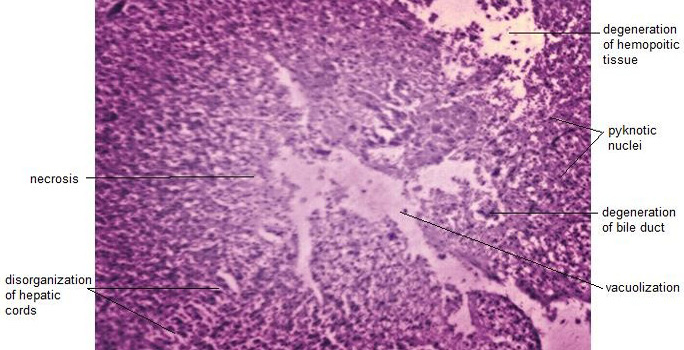
Photomicrograph of T.S. of liver of group-D (experimental) after 48 hours, showing necrosis, pyknotic nuclei, degeneration of hemopoietic tissue, degeneration of bile duct, disorganization of hepatic cords and vacuolization, H and E, (40x).

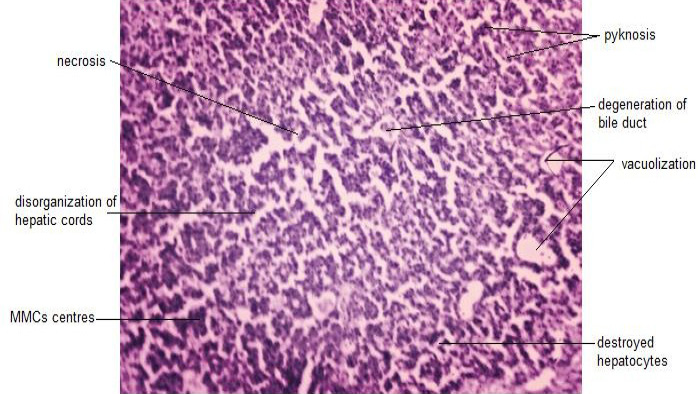
Photomicrograph of T.S. of liver of group-B (experimental) after 96 hours, showing necrosis, pyknosis, destroyed hepatocytes, degeneration of bile duct, MMCs, disorganization of hepatic cords and vacuolization, H and E, (40x).

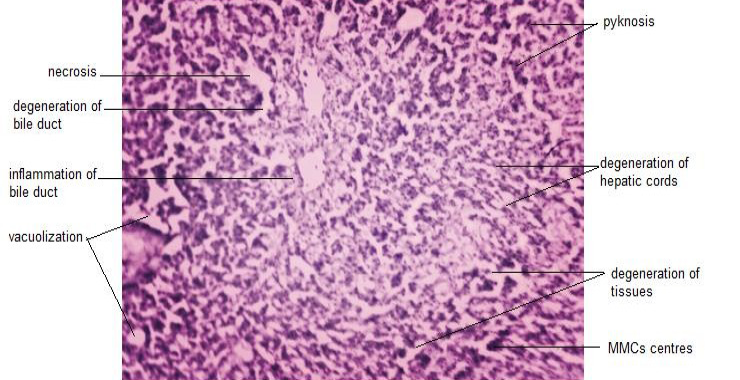
Photomicrograph of T.S. of liver of group-C (experimental) after 96 hours, showing necrosis, pyknosis, degeneration of tissue, degeneration of bile duct, degeneration of hepatic cords, inflammation of bile duct and vacuolization, H and E, (40x).
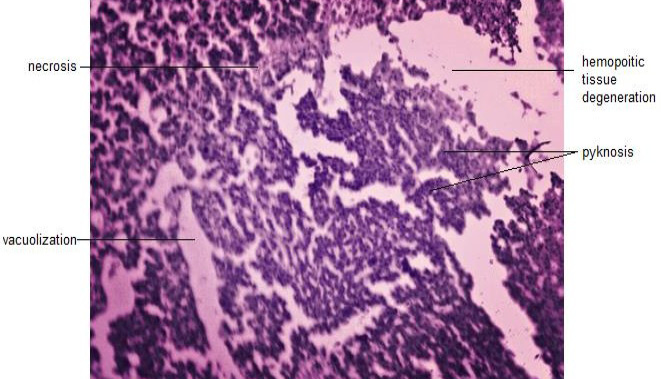
Photomicrograph of T.S. of liver of group-D (experimental) after 96 hours, showing necrosis, pyknosis, hemopoietic tissue degeneration and vacuolization, H and E, (40x).
