

Identification and Characterization of a Novel Type of Cartilage Stem/ Progenitor Cells from Tibetan Mastiff


Identification and Characterization of a Novel Type of Cartilage Stem/ Progenitor Cells from Tibetan Mastiff
Caiyun Ma1, Hebao Wen1, Lu Li2, Gaofeng Liu1, Chunjing Wang1, Yu Guo1, Shiji Fang1, Hongyu Wang1* and Changqing Liu1*
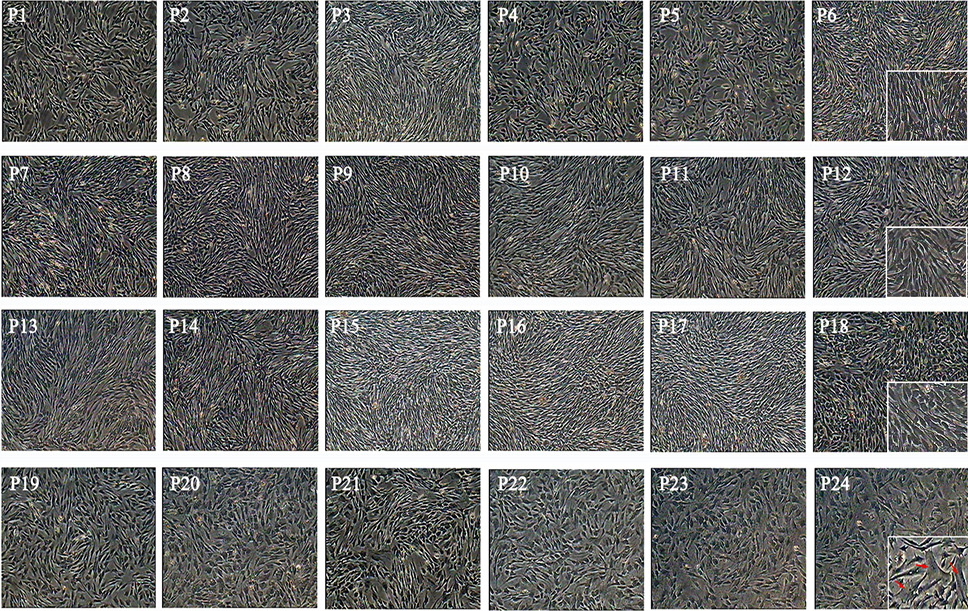
Cell morphology of CSPCs at passage 1 to passage 24 cultured in vitro. After passage 20, CSPCs appeared senescent.

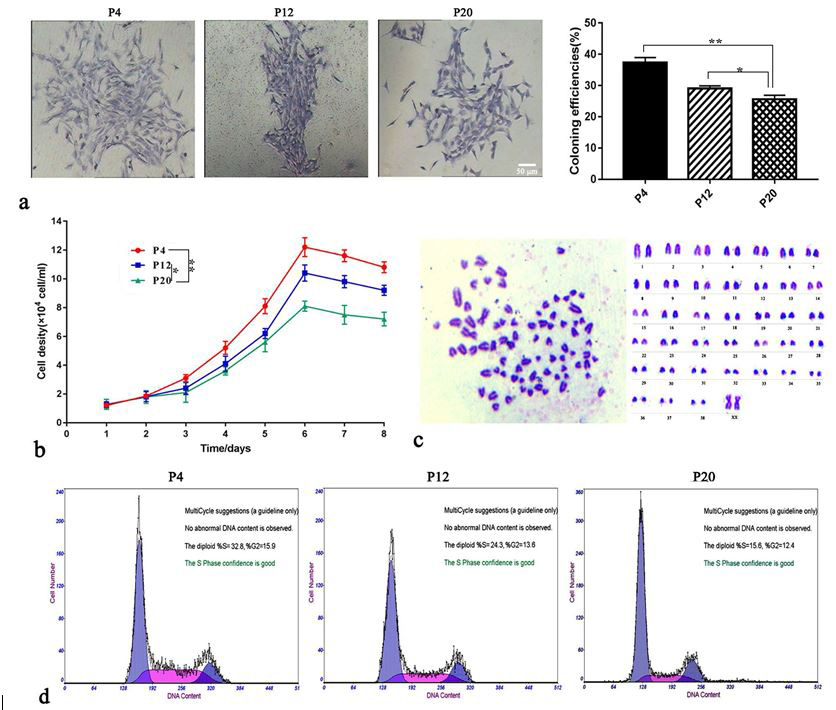
Karyotype and cell cycle analysis of proliferating CSPCs. (a) Colonies and morphology of CSPCs by Gimesa staining at P4, P12 and P20 (bar, 50 μm). Bar chart shows that colony forming efficiency of different passages; (b) Sigmoidal growth curves of CSPCs at different passages (P4/P12/P20); (c) Karyotype analysis of CSPCs (2n = 78); (d) Cell cycle analysis of P4, P12 and P20.

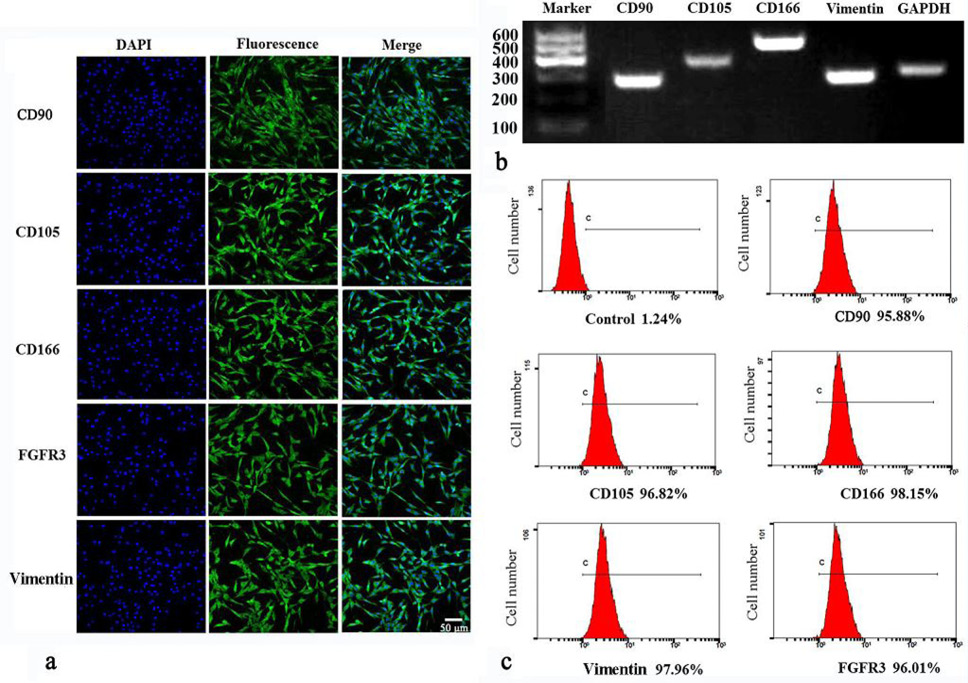
Characterization of biomarkers on CSPCs. (a) The expression of biomarkers CD90/105/166, Vimentin, and FGFR3 on CSPCs were analyzed by immunofluorescence (bar, 50 μm); (b) RT-PCR was used to detect mRNA expression levels of cell surface antigens of CSPCs; (c) CSPCs were colabeled with biomarkers and analyzed by flow cytometry, and the positive rates of surface antigens of CSPCs were all above 95%.
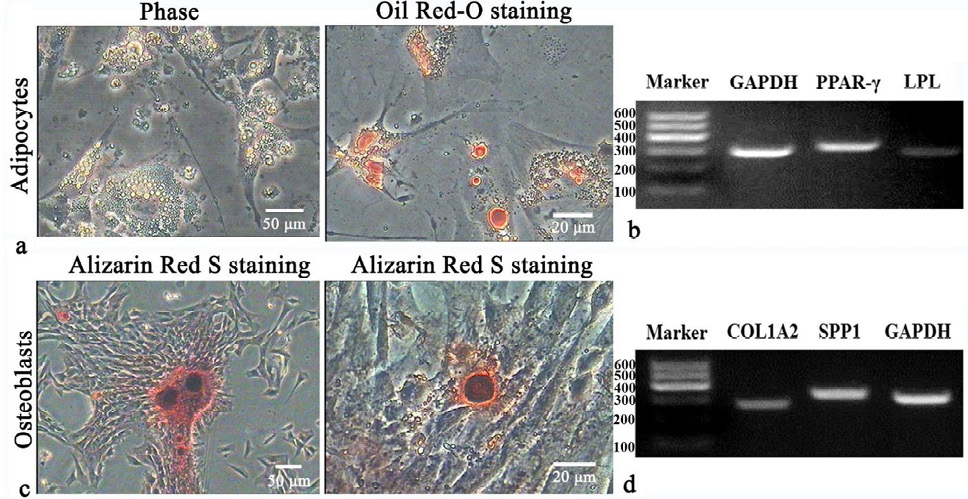
Differentiation multipotency characteristics of cartilage-derived CSPCs. (a) Intracellular lipid droplets of adipocytes accumulated in cytoplasm (bar, 50 μm) and were positive for Oil Red-O staining (bar, 20 μm); (b) Adipogenic gene expression of PPAR-γ and LPL was analyzed by RT-PCR. (c) Calcium deposits (bar, 50 μm) within induced osteoblasts were positive for Alizarin Red S staining (bar, 20 μm); (d) Osteogenic gene expression of COL1A2 and SPP1 was analyzed by RT-PCR.

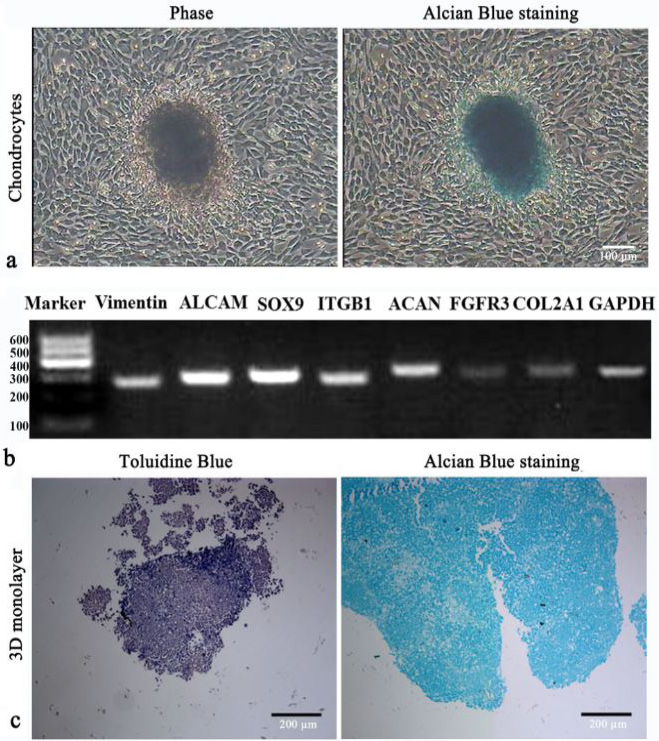
Chondrogenesis derived from CSPCs by 2D and 3D culture. (a) Chondrocytes induced from CSPCs formed primmorphs, and were positive for alcian blue staining (bar, 100 μm); (b) Chondrogenic gene expression of Vimentin, ALCAM, SOX9, ITGB1, ACAN, FGFR3, and COL2A1 were analyzed by RT-PCR, respectively. (c) Chondrogenic differentiation of CSPCs in 3D monolayer culture was stained positive with toluidine blue and alcian blue staining, which depicted the presence of glycosminoglycans (bar, 200 μm).

