
Identifying Stable Bread Wheat Derived Lines across Environments Through GGE Biplot Analysis


Identifying Stable Bread Wheat Derived Lines across Environments Through GGE Biplot Analysis
Sajid Muhammad* and Fida Mohammad
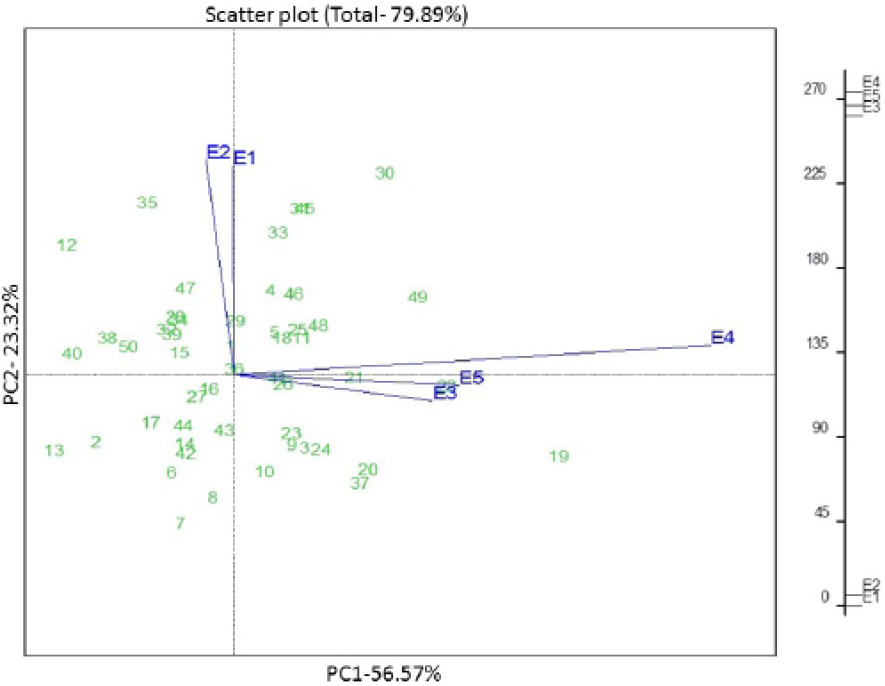
GGE bipot based on mean yield of 50 genotypes of wheat across five environments, 2011/12 and 2012/13. The vectors and rug-plot indicate the relationship among test environments.
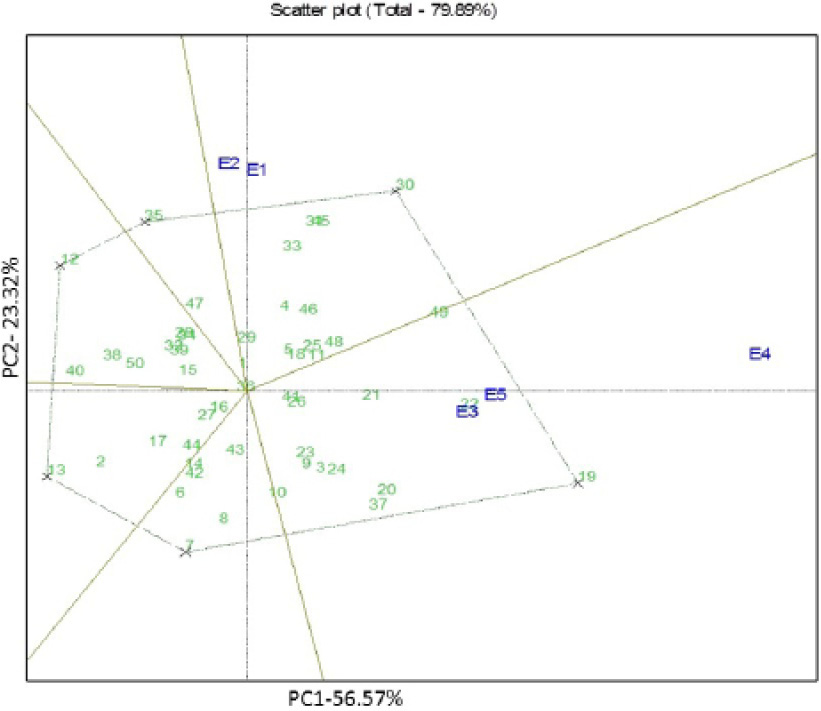
“Which-won-where” pattern of GGE biplot based on mean yield of 50 wheat genotypes evaluated across five environments, 2011/12 and 2012/13 .
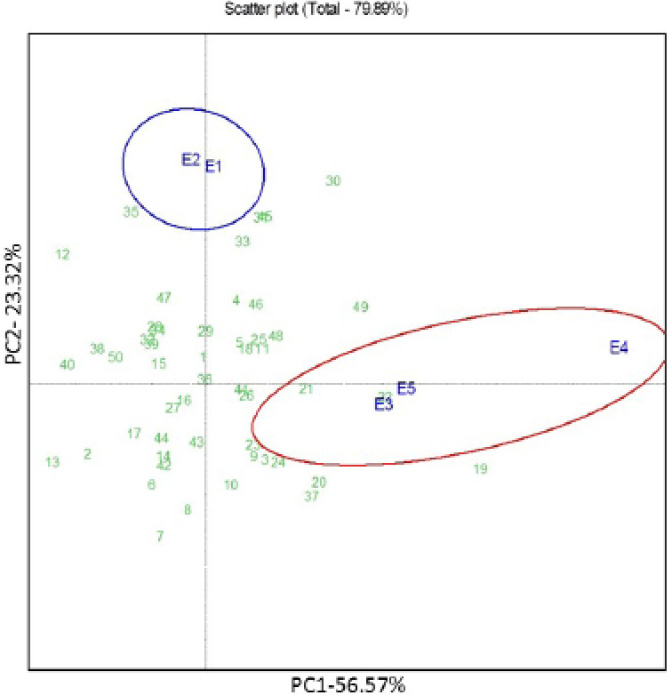
GGE biplot showing mega-environment based on mean yield of 50 wheat genotypes evaluated across five environments, 2011/12 and 2012/13. The oval and circles represent mega-environments

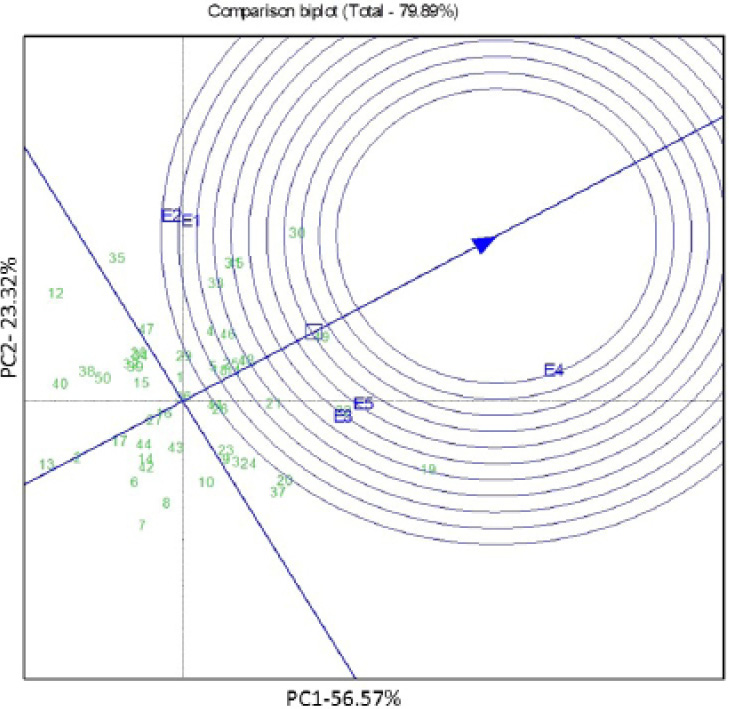
Ideal environment of GGE biplot based on mean yield of 50 wheat genotypes evaluated across five environments, 2011/12 and 2012/13.
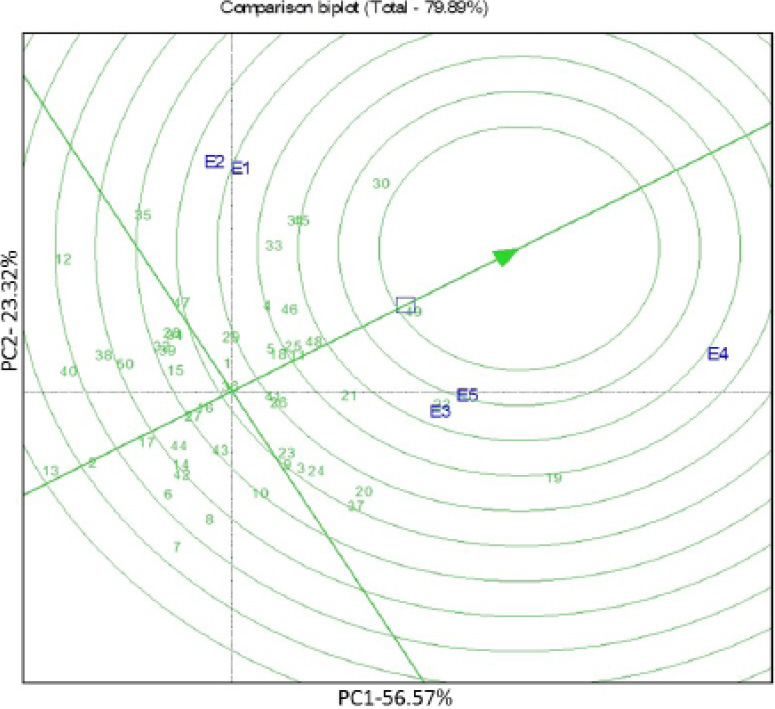
GGE biplot showing location of “Ideotype” based on mean yield of 50 wheat genotypes evaluated across five environments, 2011/12 and 2012/13.


