

Impact of Weather Changes and Human Visitation on the Behavior and Activity Level of Captive Humboldt Penguins


Impact of Weather Changes and Human Visitation on the Behavior and Activity Level of Captive Humboldt Penguins
Jiawei Zhang1,2, Thomas Quirke1, Shibao Wu2*, Shaoshan Li2 and Fidelma Butler1

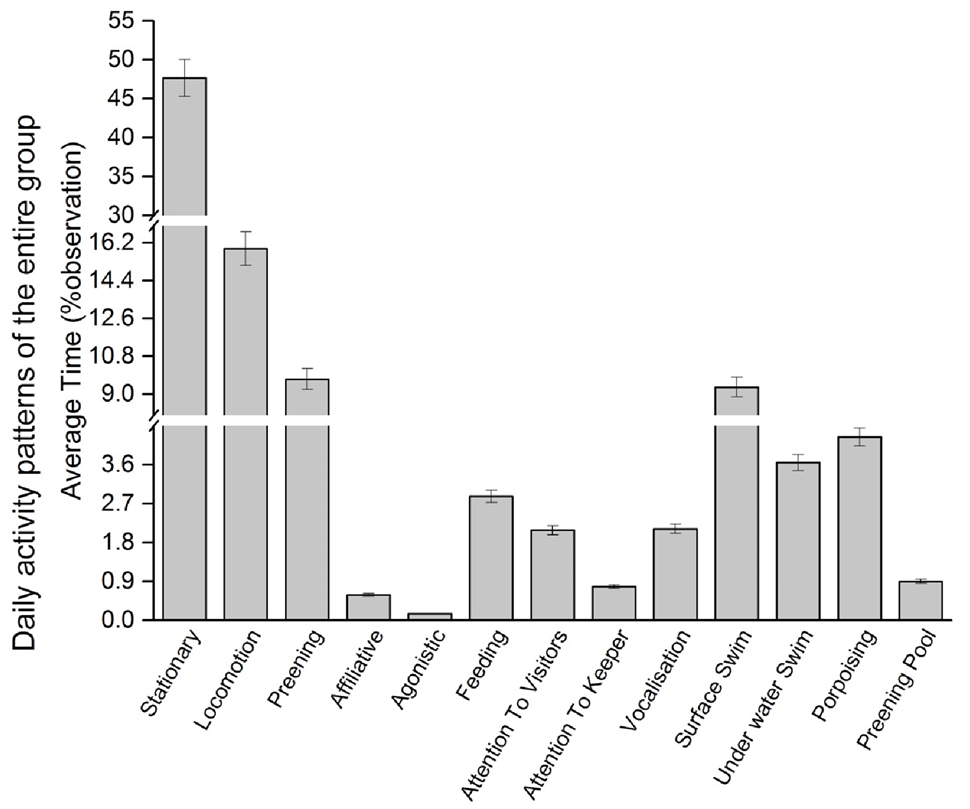
Daily activity patterns of the entire group of Humboldt Penguins calculated as percentage of time spent observing the behavior of Humboldt penguin during scan sampling over the entire study period at the Fota Wildlife Park. (Mean ± Standard Error).
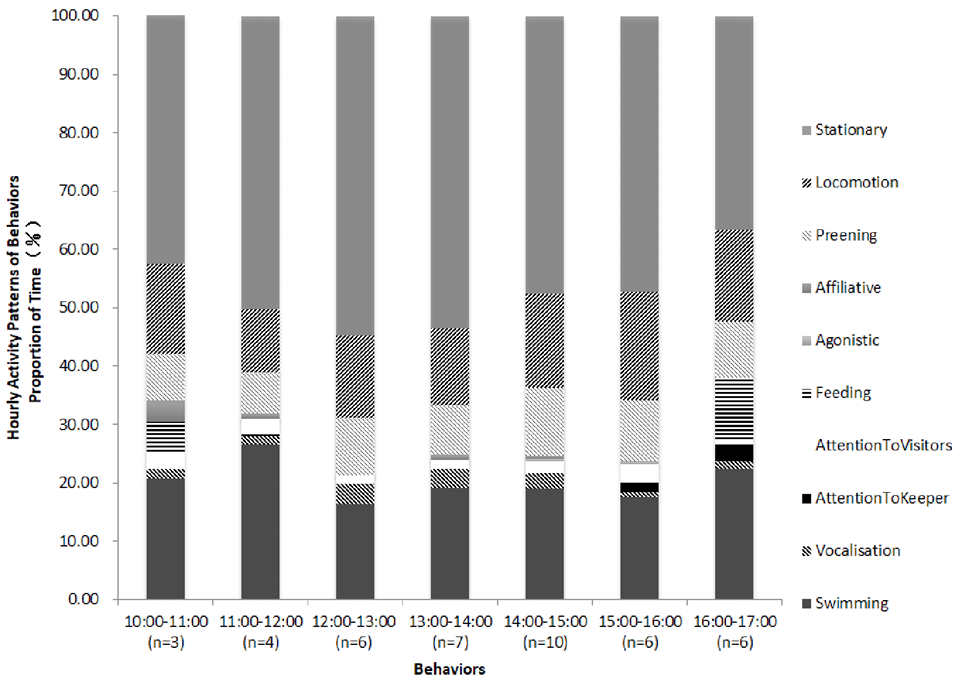
Hourly activity patterns of penguin behaviors between 10:00 and 17:00 from scan data. Descriptive time budget (n = 44).

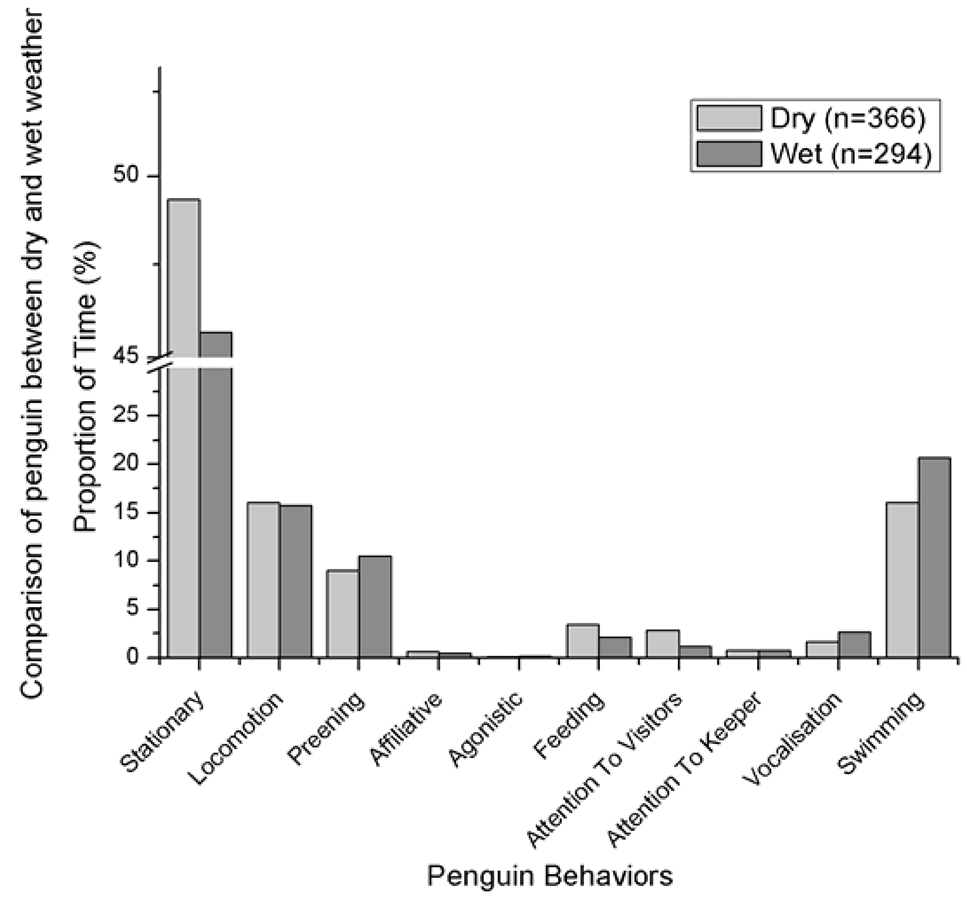
The effect of weather on the behavior of penguins as a group in Fota Wildlife Park; comparison of behaviors observed during wet (n= 294) and dry (n= 366) weather conditions.

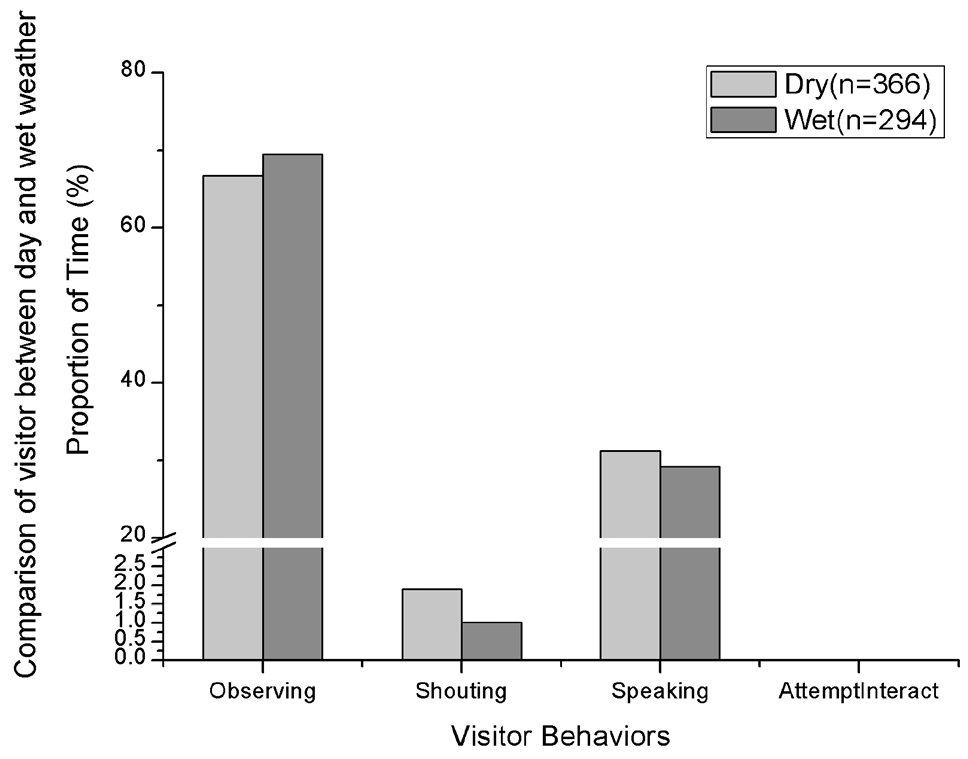
The effect of weather on the behavior of visitors in Fota Wildlife Park: comparison of human behavioral patterns during wet (n= 294) and dry (n= 366) weather conditions.
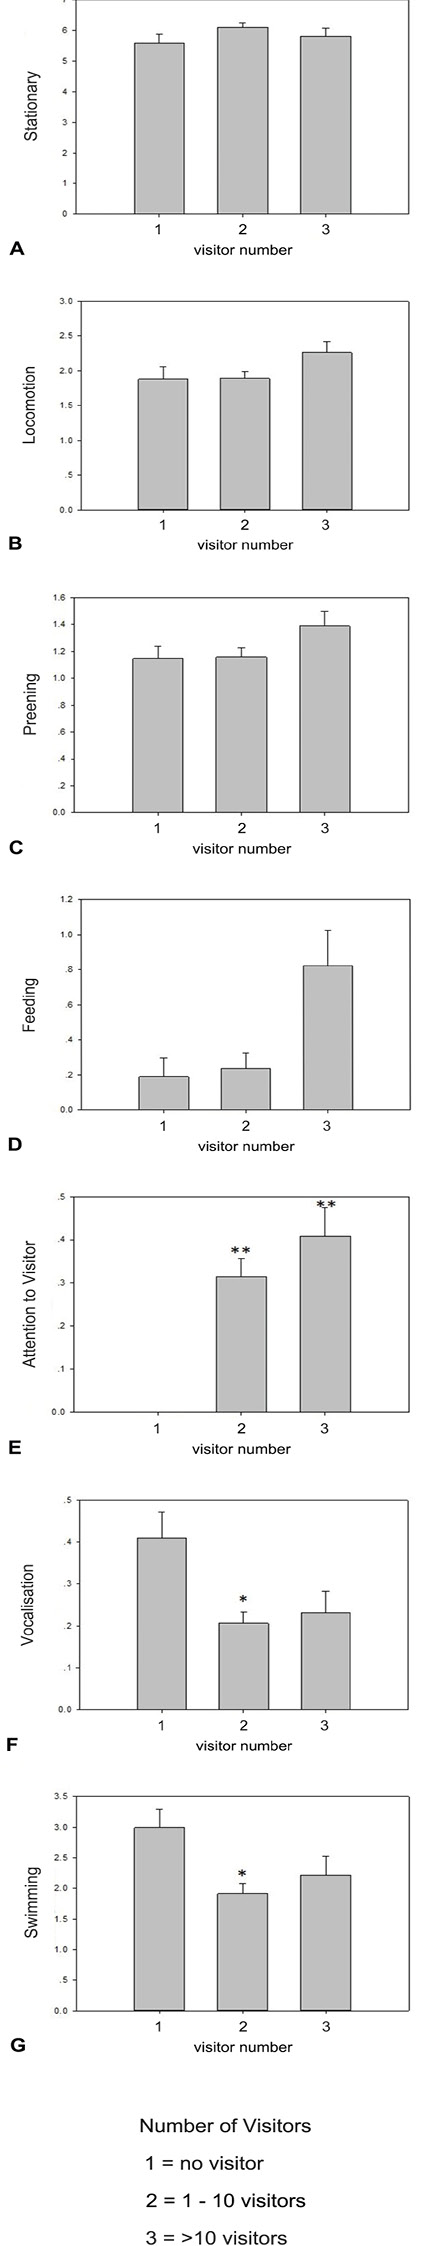
Effect of number of visitors on the behavior of penguins as a group in Fota Wildlife Park: a comparison of penguin behavior in the presence of no visitors (n = 164), 1–10 visitors (n = 349), and >10 visitors (n = 147). Mean behavior is based on data from each scan. * indicates a significant correlation (p < 0.05); ** indicates a highly significant correlation (p < 0.01).
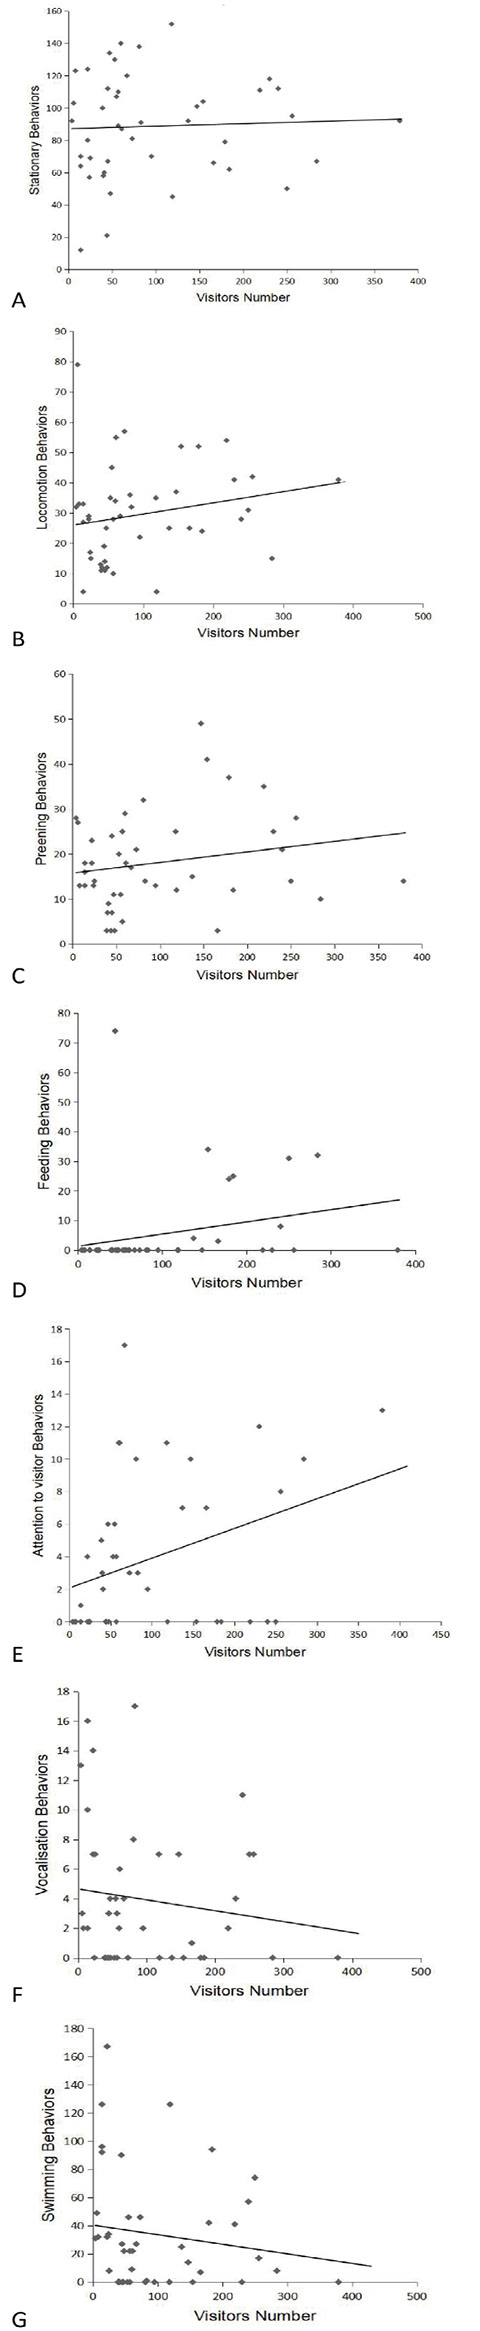
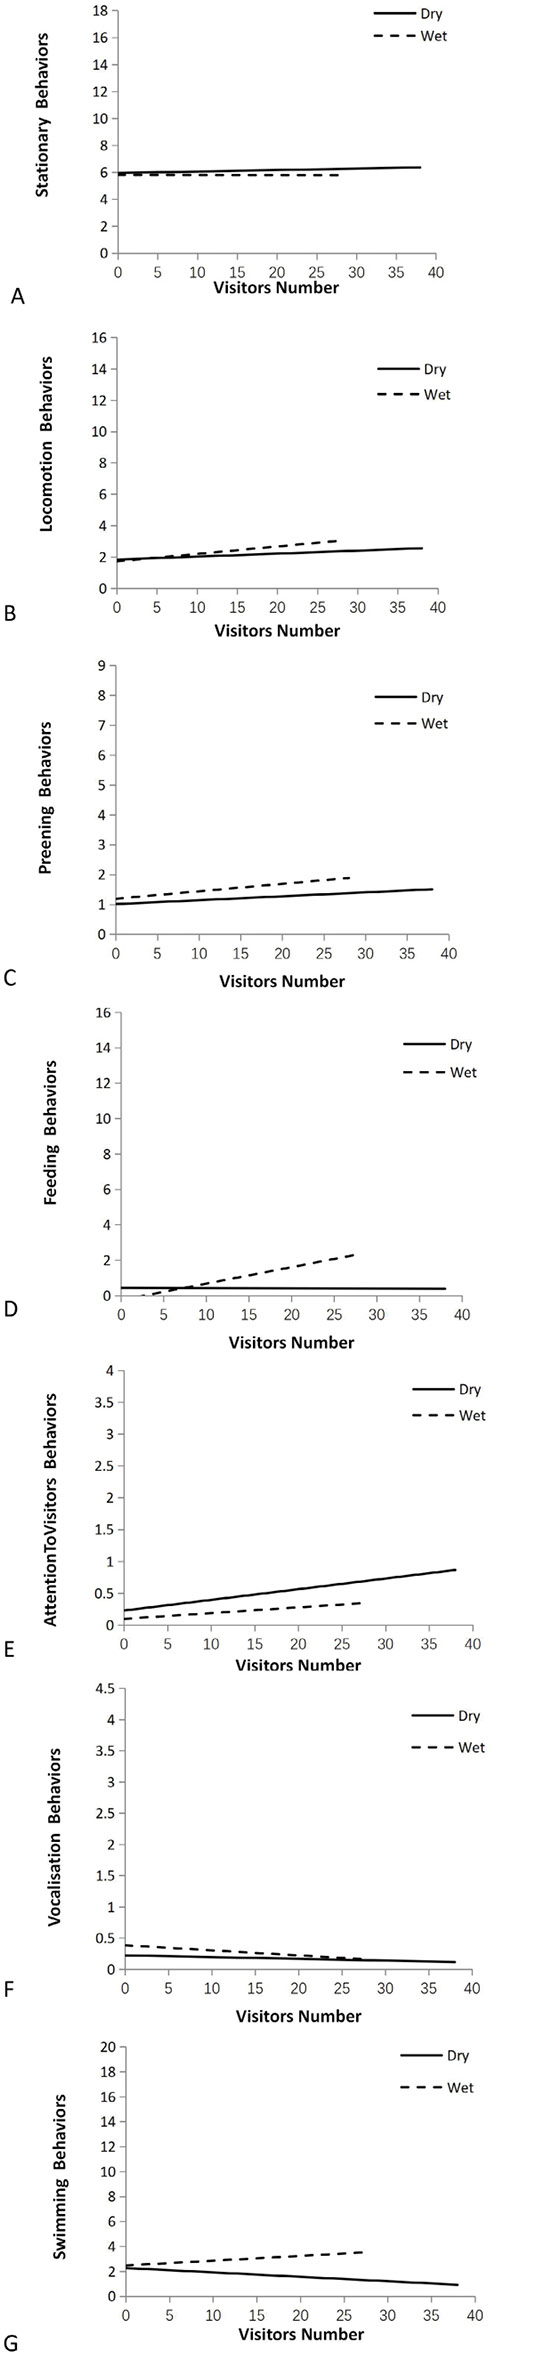
Scatterplots of effect of visitor numbers on penguin behavior. The x-coordinate of each point is the number of visitors in a given hour, and the y-coordinate is the incidence of a given behavior in the same hour. The mean behavior values are based on scan data from each hour (n= 44h).

Comparison of regression equations for the effect of visitors on penguin behavior in wet and dry weather. The mean behavior values are based on data from each scan (dry = 366 wet = 294).


