Integrating Machine Learning Models for Linear and Exponential Regression to Predict Wheat Area, Productivity and Population


Research Article
Integrating Machine Learning Models for Linear and Exponential Regression to Predict Wheat Area, Productivity and Population
Muhammad Islam1,4*, Farrukh Shehzad1, Muhammad Omar2, Abdul Qayyum3 and Rabia Siddiqui4
1Department of Statistics, The Islamia University of Bahawalpur, Punjab, Pakistan; 2Department of Computer Science, The Islamia University of Bahawalpur, Pakistan; 3Director of Agriculture, Crop Reporting Service, Government of the Punjab, Pakistan; 4Crop Reporting Service, Government of the Punjab, Pakistan.
Abstract | The true prediction of food crop with exact estimation of population growth can play a crucial role for evolving effective agricultural policy decisions for food concerns. This study integrated the efficacies of supervised machine learning (ML) algorithms using compound growth exponential regression models (CGREM) with linear regression models (LRM) to predict the wheat area, yield and population explosion. The historical data are collected from 1950 to 2020 and ML models are deployed using the 80% train and 20% test datasets. Various combinations of train test split have been applied to check the precisions of data partitions subset on the deployed models. ML model predict that the wheat area will rise up to 15%, 51.7%, wheat yield will grow up to 28%, 109.7% and population will rise up to 34.2%, 140.6%, respectively for the year 2030 and 2050. Population will upturn about 88.9% and 30.9% more than from wheat area and wheat yield up to 2050 and it might explode the food critiques in the region. It is concluded that wheat productivity must be raise to ensure the food demands. The results of this study demonstrated that the CGREM found to be superior comparing with benchmark LRM.
Received | June 15, 2021; Accepted | March 02, 2022; Published | July 05, 2022
*Correspondence | Muhammad Islam, Department of Statistics, The Islamia University of Bahawalpur, Punjab, Pakistan; Email: mislam6667@gmail.com
Citation | Islam, M., F. Shehzad, M. Omar, A. Qayyum and R. Siddiqui. 2022. Integrating machine learning models for linear and exponential regression to predict wheat area, productivity and population. Sarhad Journal of Agriculture, 38(3): 894-901.
DOI | https://dx.doi.org/10.17582/journal.sja/2022/38.3.894.901
Keywords | Exponential regression, Machine learning, Population explosion, Prediction, Wheat area and productivity
Copyright: 2022 by the authors. Licensee ResearchersLinks Ltd, England, UK.
This article is an open access article distributed under the terms and conditions of the Creative Commons Attribution (CC BY) license (https://creativecommons.org/licenses/by/4.0/).
Introductions
The complementary statistics issued by the food and agriculture organization (FAO) based on food insecurity experience scale (FIES) revealed that about 10% of the world’s population is suffering from food insecurity (Pocketbook, 2015). It is hypothesized by various policy makers, researchers and FAO that high growing population pressure especially in South-Asian countries may blowup the food conflicts. Agriculture being a staple benefactor in economy performing its fundamental role in product contributions (Surya and Aroquiaraj, 2018). For evolving effective agricultural strategies, accurate crop productivity prediction at local, national as well as international level has become a crucial task for any economy to attain the sustainability in agriculture needs and precision agriculture (PA). There is essential prerequisite demand of time is to predict the accurate and precise crop productivity to evoke to handle the uncertainty prevail in food concerns (Jeong et al., 2016). The wheat crop being a 3rd largest food crop in the world and 2nd important food crop in the developing world playing its significant role both in terms of cultivation and food supply in the world economy (Enghiad, 2015; Giraldo et al., 2019; Kiss, 2011; Ramesh, 2009). Agriculture sector got key significance in the midst of food insecurity situation for the world and the core focus of the world think-tank economies has been diverted towards the improvement and exact prediction of food crops productivity to meet the challenge of food security (Zia-ur-Rehman, 2017). Inayatullah (2019) reported, Agriculture is the important sector of Pakistan’s economy are contributing 18.5% in GDP, 38.5% of country’s labor force and it is expected that population of Pakistan will reached to 262.59 (millions) up to 2030 from current status of 216.57 (millions). In Pakistan the population growth rate (GR) is very high while it is low in neighbor countries like Bangladesh, Bhutan, India, Maldives, Nepal, Srilanka about 1.7%, 1.4%, 1.5%, 1.9, 2.0% and 0.5% respectively (Islam, 2015). It is alarming that population growth rate (GR) in Pakistan is now reaching to 2.40% from 2.05% while the agriculture GR of Pakistan has reached its low level at 0.85% in 2018-19 from 3.9% in 2017-18 (ESP, 2019-20). With the present population GR, it is projected that in 2050 Pakistan will attain the 4th position in term of population in the world instead of the current status of 6th (Ahmad and Farooq, 2010). In Pakistan, wheat crop production in 2013-14 was grown at GR 7.3% but due to decreases in productivity and area under wheat crop the GR in 2018-19 was reached to 0.5% and it was reported negative at -6.0% in 2017-18 (ESP, 2019-20). Population GR in Pakistan is high while the wheat crop production is still low and this situation may explode the food conflicts in Pakistan. The precise as well as accurate wheat crop prediction is significantly required to check out the future demand of wheat for the country and to handle the expected threat of food availability in the world. According to Jeong et al. (2016), statistical models gives predictions based on reliable and sufficient dataset for model training within the restrictions of training dataset while the machine learning (ML) used process based algorithms techniques and gives alternatives to traditional statistical model. Machine learning (ML) algorithms are evolved as evolutionary extension of statistical field and capable of dealing the enormous datasets by adding the methods from computer science to the repertoire of statistics (Cielen et al., 2016). According to Nelli (2015), ML are advanced tools of data science based algorithms which are identified the patterns, clusters, trends and then extract suitable facts from inside the data. ML algorithms has been categories as advanced tools applied for prediction of agriculture production (Alagurajan and Vijayakumaran, 2020; Elavarasan et al., 2018; González Sánchez et al., 2014; Mishra et al., 2016; Yadav, 2020). ML did not made assumptions about the data structure of model and it is applied in complex prediction issues such as function form for crop yield prediction (Priya et al., 2018). Arthur Samuel (1901–1990), pioneer in artificial intelligence was the first who coined the term machine learning in the year 1959. He defined machine learning as “Field of study that gives computers the capability to learn without being explicitly programmed” (Dangeti, 2017; McCarthy and Feigenbaum, 1990). Figure 1 shows the flowchart process of ML algorithms.
The prime objective of this study is to explore the precise and accurate statistical model based on machine learning algorithms for the prediction of wheat crop area, productivity along with the projection of population in Pakistan which could help the government to set their goal to attain the sustainability in agriculture to assure to measure the demand and supply gap and to emphasized the food secure region in the world.
Materials and Methods
Seventy one years historical data of wheat crop area, yield, and population from 1950-2020 was obtained from the Pakistan bureau of statistics (PBS), Punjab agriculture marketing information service department (AMIS), crop reporting service (CRS) agriculture department Punjab and from the economic surveys of Pakistan. These organizations are responsible for valid, reliable, precise and accurate data collection agencies and have sound mechanisms and authentic data sources for various research made decisions. The datasets measuring scales are wheat area in thousand acres, yield in munds per acre and population in millions. Here we performed investigation/experiments using popular Python’s machine learning library called Scikit learn by jupyter notebook. Data preprocessing (DP) techniques have a significant role for generalized performance of ML algorithm (Alexandropoulos et al., 2019; Kotsiantis et al., 2006). DP is a way to improve the data set quality by discording or by filling the missing data set based on data cleaning, integration, transformation and reduction of datasets (Han et al., 2011; Rahman, 2019). The present historical secondary dataset are collected from objective based statistical organizations are complete, valid and free from noisy data set.
Supervised Machine learning algorithms
The machine learning linear and exponential regression models are applied on training data set and used to test the results on the testing/validation data sets. The collected data for the wheat crop area, yield and population is used to predict the future trends. Datasets is further preprocessed into training data and testing datasets. The training datasets are using in three ways as 80%, 75% and 70% with testing datasets as 20%, 25% and 30%. The performance of the supervised machine learning models as linear and non-linear is evaluated based on training and testing/validations data sets using evaluation metrics. Regression analysis being a subset of ML algorithms permit us to predict the continuous response variable (y) based on feature “x” identifies by the function y = g(x) + є under the well said assumption of linear relationship between the response and feature. The prediction models in vector form
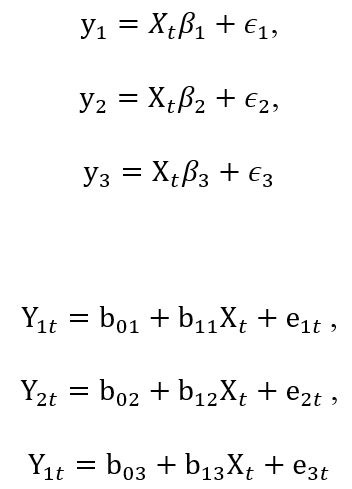
y1= wheat area, y2= wheat yield, y3 = population, xt= predictor time period, e3i=1 = error term
The regression parameters b0i and b1i, depicts intercept and slope learned through ML method. Further exponential growth models are proposed as regression analysis known as compound growth exponential regression models (CGREM) to predict the wheat crop area, productivity along with population. The compound growth rates (CGR) is measured by following model (Dhakre and Sharma, 2010; Kondal, 2014).

“yt” depicts the wheat area/yield /population, “t” time period, “0” initial period, “r” indicates compound growth rate. The slope measures the relative change in response variable for the absolute change accrue in feature and it measure the instantaneous rate of growth
Ln[yt] = Ln[y0]+t[Ln{1+r}], Ln[yt] = Y, Ln[y0]= a, Ln [1 + r]=b
[1 + r] = Expb, r =[expb – 1]×100
To predict the parameter the following equation are applied as
yp = [yc(1+b)n]
Yp= value of response variable at projected time, yc = actual/collected value of response at time “t”, b = regression coefficients, n = total no. of year project i.e. tp - tc
Evaluation metrics
To test the performance of model on the training and testing dataset the smallest value of mean square error (MSE), mean absolute error (MAE) and root mean square error (RMSE) with highest coefficient of determination (R2) will leads to select the best model
 ,
, 
Results and Discussion
Comparing machine learning techniques LRM and CGREM
Data partitions is carried using 80% dataset as training
Table 1: Comparison LRM and CGREM model for wheat area, yield and population explosion.
|
Parameters |
Partition Datasets |
LRM |
CGREM |
||||||
|
R2 |
MSE |
MAE |
RMSE |
R2 |
MSE |
MAE |
RMSE |
||
|
Area |
Train 80% (1950-2005) |
0.96 |
491808 |
573.8 |
701.2 |
0.94 |
0.003 |
0.04 |
0.05 |
|
Test 20% (2006-2020) |
-- |
4121217 |
1796.3 |
2030.1 |
-- |
0.03 |
0.16 |
0.17 |
|
|
Yield |
Train 80% (1950-2005) |
0.94 |
1.83 |
0.975 |
1.353 |
0.94 |
0.0106 |
0.075 |
0.103 |
|
Test 20% (2006-2020) |
-- |
1.87 |
1.05 |
1.36 |
-- |
0.029 |
0.15 |
0.17 |
|
|
Population |
Train 80% (1950-2005) |
0.97 |
30.90 |
4.80 |
5.55 |
0.99 |
0.0010 |
0.028 |
0.0320 |
|
Test 20% (2006-2030) |
-- |
535.2 |
21.85 |
23.13 |
-- |
0.019 |
0.136 |
0.141 |
|
datasets for the years 1950-2005 and 20% dataset as testing dataset for the years 2006-2020. The supervised ML algorithms are applied to test the model performance for the prediction of wheat area, yield and population in Pakistan and the scope of this research is to use the machine learning regression tools up to future concerns for 2030 and 2050. ML regression models are constructed using compound growth exponential regression model (CGREM) with benchmark linear regression model (LRM) based on 80%, 20% train test split criterion. From Table 1, the LRM and CGERM showed 96% and 94%, 94% and 94%, 97% and 99% model performance scores for wheat area, yield and population, respectively. Evaluation matrices approaches for wheat area depicts that MAE and RMSE for LRM training dataset is 573.8 and 701.2 and for testing data set is 1796.3 and 2030.1 while for CGREM these are 0.04, 0.05 and 0.16, 0.17, respectively for training and testing dataset.
For the wheat yield the MAE is 0.975 and RMSE is 1.353 for train datasets and these are reported as 1.05 and 1.36 for testing phase in response of LRM. The CGREM for wheat yield model, the train datasets values of MAE and RMSE are found as 0.075 and 0.103 and these are reported as 0.15 and 0.17 for test datasets. For the prediction model of population the MAE and RMSE are 4.80 and 5.55 for training phase and 21.85 and 23.13 for testing phase for LRM and for CGREM these are found as 0.028 and 0.032 for train model and 0.136, 0.141 for test model. The analysis depicted that for all the parameters determinists, the low value of MAE and RMSE reported from CGREM both for training and testing phase with good model performance score. It is critiqued here that the CGREM performed better fitted model comparing with benchmark LRM as all the error values found low in CGREM (RMSECGREM <RMSELRM and MAECGREM <MAELRM). The results of this study demonstrated that machine learning approach using the CGREM enhanced the prediction capability for all the models.
CGREM model evaluation matrices for different data sets partitions
As the CGREM found better fitted model with 80% and 20% train test split. In Table 2, the CGREM model evaluation is further exercised to check the variation characteristics of the model by changing the train test split to 75%, 25% and 70%, 30% partitions. For the wheat area at 80%, 75% and 70% training phase shows MAE and RMSE as 0.04 and 0.05, 0.037 and 0.049, 0.032 and 0.041 with performance training score as 0.94, 0.95 and 0.96 while for testing phase the MAE and RMSE values are found as 0.16 and 0.17, 0.189 and 0.198, 0.21 and 0.22.The values of MAE and RMSE for wheat yield reported as 0.075 and 0.103, 0.077 and 0.105, 0.078 and 0.108 with performance score 0.94, 0.93 and 0.92 respectively for 80%, 75% and 70% train datasets while for test data these are reported as 0.15 and 0.17, 0.147 and 0.168, 0.139 and 0.163. For the population, the MAE characterize as 0.028, 0.027, 0.0209 respectively for 80%, 75% and 70% trains split while these are reported as 0.136, 0.142 and 0.149 for testing datasets. The RMSE for population train data found 0.0320, 0.032, 0.0243 for 80%, 75% and 70% trains split and theses are reported as 0.141, 0.149, and 0.159 for testing datasets. The Table 2 depicts that by decreasing the train split from 80% to 70% the values of MAE and RMSE is decreasing while for testing dataset these values are increasing for area and population shows over fitting in the model and it is vice versa for the yield. Figure 2, 3 and 4, depicts the model evaluation for different time test split partitions for the determinists. For the area (Figure 2), it is exhibits that at starting phase 1st partition (80%, 20%) to 3rd phase partitions (70%, 30%), training error slighting reduced from 0.05 to 0.041 while testing error increase from 0.17 to 0.22 which indicates rising characteristics
Table 2: Comparison of different partition of train test split for wheat area, yield and population explosion.
|
CGRM |
Evaluation matrices |
Train (80%) 1950-2005 |
Test (20%) (2006-2020) |
Train (75%) 1950-2001 |
Test (25%) (2002-2020) |
Train (70%) (1950-1998) |
Test (30%) (1999-2020) |
|
Area |
R2 |
0.94 |
-- |
0.95 |
-- |
0.96 |
-- |
|
MSE |
0.003 |
0.03 |
0.0024 |
0.039 |
0.0017 |
0.049 |
|
|
MAE |
0.04 |
0.16 |
0.037 |
0.189 |
0.032 |
0.21 |
|
|
RMSE |
0.05 |
0.17 |
0.049 |
0.198 |
0.041 |
0.22 |
|
|
Yield |
R2 |
0.94 |
-- |
0.93 |
-- |
0.92 |
-- |
|
MSE |
0.0106 |
0.029 |
0.011 |
0.028 |
0.0117 |
0.026 |
|
|
MAE |
0.075 |
0.15 |
0.077 |
0.147 |
0.078 |
0.139 |
|
|
RMSE |
0.103 |
0.17 |
0.105 |
0.168 |
0.108 |
0.163 |
|
|
Population |
R2 |
0.99 |
-- |
0.99 |
-- |
0.99 |
-- |
|
MSE |
0.0010 |
0.019 |
0.0010 |
0.022 |
0.0005 |
0.025 |
|
|
MAE |
0.028 |
0.136 |
0.027 |
0.142 |
0.0209 |
0.149 |
|
|
RMSE |
0.0320 |
0.141 |
0.032 |
0.149 |
0.0243 |
0.159 |
Table 3: Wheat area, yield and population explosion prediction based on CGREM.
|
Parameters |
Slope (β) |
CGR (r) |
Response at time “tc” |
Predicted 2030 |
Predicted 2050 |
|
Area |
0.014** |
1.409% |
21750.62 |
24994.8 (15%) |
33007.3 (51.7%) |
|
Yield |
0.025** |
2.531% |
29.02 |
37.15 (28%) |
60.87 (109.7% |
|
Population |
0.0297** |
3.014% |
215.25 |
288.84 (34.2%) |
517.92(140.6% |
“**” indicate significance of the determinants, values in parenthesis showing the %age increase over response at time “tc”
of over fitting and loss of model performance for testing phase. The training error for yield (Figure 3) slightly rises for the increase of train test split which show performance loss of the model for training phase. In Figure 4, for the population modeling training error reduces but the testing error rises indicates the loss of performance measure for the testing phase. It is noted that slight changes observed in training and testing phase for both the determinants of prediction and on the whole at 80% and 20% train test split model performance is better comparing with validation matrices to avoid over-fitting. It is predicted (Figure 5) from model that the wheat area will rise up to 15% and 51.7%, wheat yield will grow up to 28% and 109.7% and population will rise up to 34.2% and 140.6% up to 2030 and 2050. It is predicted by model that wheat area will rise 15% and touch to 24994.8(“000” acre) up to 2030 and it will rise about 51.7% and will touch to 33007.3 (“000”acre) up to 2050. Wheat productivity predicted as 37.15 (munds/acre) for 2030 and 60.87 (munds/acre) for 2050 and it is estimated to increase about 28% and 109.7%, respectively for 2030 and 2050. The population predicted as 288.84 (millions) in 2030 and 517.92 (millions) in 2050 shows the rise of 34.2% and 140.6%. It is relatively estimated that up to 2030 and 2050 the wheat area gap reported as 19.2% and 88.9% and yield gap reported as 6.2% and 30.9% comparing with population and this situation might depress the Pakistan due to the shortage of food concerns. The increase in area of wheat crop may definitely decrease the area of other competitive crop. To overcome the food demand and to attain the sustainable agriculture, it is needed to increase the wheat yield to major extent by using the intensive agriculture farming and by using the precision agriculture. From ML model, highest growth rate reported for population about 3.014% while for area and yield it is reported 1.409% and 2.531%. The food supply system in the world is in severe stress due to high population growth rate and due to changes in climate and economic system (Kamir et al., 2020). There is continuous rise in the world population along with food consumption have become the major cause for the epidemic of food shortage in the world and the major concept behind the food security is to ensure and increase the food availability (Tripathi et al., 2019). FAO, UNO and many other organizations reported that high growing population trend especially in south Asian countries may explode the food conflicts in the region (Abdulrahaman, 2013; Nelson et al., 2010). The current analysis revealed that population of Pakistan will rise about double and half (140.6%) up to 2050 and the increase in the wheat productivity in not enough to meet the food demand which may explode the food conflict and many other socio-economic issues. It is foremost need of the time is to take the strong and practical policy decisions to take down the population growth rate and to raise the wheat productivity to get the sustainability in food concerns.
Conclusions and Recommendations
This study evaluated the efficacy of machine learning models using compound growth exponential regression with benchmark linear regression models based on 80%, 20% train test split criterion to predict the wheat area, yield and population explosion in Pakistan.
It is demonstrated that CGREM provides superior performance with performance score 0.94, 0.94 and 0.99 for area, yield and population explosion. Model evaluation matrices reported low values of MAE and RMSE for CGREM both for training and testing phase comparing with LRM (RMSECGREM <RMSELRM, MAECGREM <MAELRM). High growth rate reported from population about 3.014% comparing with area 1.409% and yield 2.531%. CGREM predicted for 2050, the wheat area will rise up to 51.7%, yield will grow up to 109.7% and population will boost to 140.6%. It noted that population will upturn 88.9% and 30.9% more than from wheat area and yield. Train test split 75%, 25% and 70%, 30% are also applied and 80%, 20% found superior to avoid over-fitting. It is depicted that population of Pakistan will be about double and half up to 2050 and this may explode the food conflict and many other socio-economic issues. It is needed to enhance the wheat productivity by using the intensive agriculture and by using the precision agriculture to ensure the food sustainability. The results of this study concluded that machine learning CGREM are precise model for the prediction of wheat crop area, productivity and population of Pakistan and this technique could help the government to ascertain their goal to attain food sustainability.
Acknowledgements
The authors would like to thanks to all the respected teachers department of statistics, the Islamia University of Bahawalpur and all team of CRS Agriculture Department, Punjab, Pakistan.
Novelty Statement
Prediction capability of models increased through machine learning exponential regression approaches using the big datasets. This technique proceed the government to set their goals to attain sustainable agriculture and to ascertain their policies for food security.
Author’s Contribution
Muhammad Islam: Original draft preparations, methodologies, data analysis and conclusion.
Farrukh Shehzad: Data collection, supervision, data analysis, descriptions.
Muhammad Omar: Software analysis machine learning methodologies.
Abdul Qayyum: Statistical data analysis, data handling scaling, descriptions.
Rabia Siddiqui: Description, manuscripts text reading and analysis.
Conflict of interest
The authors declared no conflict of interest.
References
Abdulrahaman, S. 2013. Population growth and food security in Nigeria (2010-2012). Nigerian Chapter of Arabian J. Bus. Manage. Rev., 62(1087): 1-13. https://doi.org/10.12816/0003624
Ahmad, M. and Farooq, U. 2010. The state of food security in Pakistan: Future challenges and coping strategies. Pak. Dev. Rev., 903-923. https://doi.org/10.30541/v49i4IIpp.903-923
Alagurajan, M. and Vijayakumaran, C. 2020. ML Methods for Crop Yield Prediction and Estimation: An Exploration. https://doi.org/10.35940/ijeat.C5775.029320
Alexandropoulos, S.A.N., Kotsiantis, S.B. and Vrahatis, M.N. 2019. Data preprocessing in predictive data mining. Knowledge Eng. Rev., 34. https://doi.org/10.1017/S026988891800036X
Cielen, D., Meysman, A. and Ali, M. 2016. Introducing data science: big data, machine learning, and more, using Python tools: Manning Publications Co.
Dangeti, P. 2017. Statistics for machine learning: Packt Publishing Ltd.
Dhakre, D. and Sharma, A. 2010. Growth analysis of area, production and productivity of maize in Nagaland. Agric. Sci. Digest, 30(2): 142-144. https://doi.org/10.1097/01.aoa.0000386813.07687.68
Elavarasan, D., Vincent, D.R., Sharma, V., Zomaya, A.Y. and Srinivasan, K. 2018. Forecasting yield by integrating agrarian factors and machine learning models: A survey. Comput. Electron. Agricu., 155: 257-282. https://doi.org/10.1016/j.compag.2018.10.024
Enghiad, A. 2015. Examining the response of world wheat prices to climatic and market dynamics. Colorado State University. Libraries.
ESP. 2019-20. Economic survey of pakistan. Ministry of Finanace, Pakistan, http://www.finance.gov.pk/
Giraldo, P., Benavente, E., Manzano-Agugliaro, F. and Gimenez, E. 2019. Worldwide research trends on wheat and barley: A bibliometric comparative analysis. Agronomy, 9(7): 352. https://doi.org/10.3390/agronomy9070352
González Sánchez, A., Frausto Solís, J. and Ojeda Bustamante, W. 2014. Predictive ability of machine learning methods for massive crop yield prediction. https://doi.org/10.5424/sjar/2014122-4439
Han, J., Kamber, M. and Pei, J. 2011. Data mining concepts and techniques third edition. The Morgan Kaufmann Series in Data Manage. Syst., 5(4): 83-124. https://doi.org/10.1016/B978-0-12-381479-1.00003-4
Inayatullah, J. 2019. Rainwater harvesting : Viable solution for water security in rural & mountainous areas of Pakistan The Kaleidoscope that is Pakistan https://ipripak.org/wp-content/uploads/2020/07/MD-Kaleidoscope-Nov2019-WEB.pdf (Section 12: Rainwater harvesting).
Islam, M. 2015. Factors affecting major food crops production, a case study of district Bahawalpur. M.Phil theis, Department of Stististics, The islamia university of Bahawalpur.
Jeong, J.H., Resop, J.P., Mueller, N.D., Fleisher, D.H., Yun, K., Butler, E.E. and Reddy, V. R. 2016. Random forests for global and regional crop yield predictions. PLoS One, 11(6): e0156571. https://doi.org/10.1371/journal.pone.0156571
Kamir, E., Waldner, F. and Hochman, Z. 2020. Estimating wheat yields in Australia using climate records, satellite image time series and machine learning methods. ISPRS J. Photogrammetry Remote Sensing, 160: 124-135. https://doi.org/10.1016/j.isprsjprs.2019.11.008
Kiss, I. 2011. Significance of wheat production in world economy and position of hungary in it. Apstract: Appl. Stud. Agribus. Commerce, 5(1033-2016-84132): 115-120. https://doi.org/10.19041/APSTRACT/2011/1-2/14
Kondal, K. 2014. Growth rate of area, production and productivity of onion crop in Andhra Pradesh. Indian J. Appl. Res., 4(3): 4-6. https://doi.org/10.15373/2249555X/MAR2014/2
Kotsiantis, S.B., Kanellopoulos, D. and Pintelas, P.E. 2006. Data preprocessing for supervised leaning. Int. J. Comput. Sci., 1(2): 111-117.
McCarthy, J. and Feigenbaum, E.A. 1990. In memoriam: Arthur samuel: Pioneer in machine learning. AI Magazine, 11(3): 10-10.
Mishra, S., Mishra, D. and Santra, G. H. 2016. Applications of machine learning techniques in agricultural crop production: a review paper. Indian J. Sci. Technol., 9(38): 1-14. https://doi.org/10.17485/ijst/2016/v9i38/95032
Nelli, F. 2015. Python Data Analytics: Data Analysis and Science Using Pandas. Matplotlib, and the Python Programming Language.
Nelson, G.C., Rosegrant, M.W., Palazzo, A., Gray, I., Ingersoll, C., Robertson, R. and Ringler, C. 2010. Food security, farming, and climate change to 2050: scenarios, results, policy options (Vol. 172): Intl Food Policy Res Inst.
Pocketbook, F.S. 2015. World food and agriculture. Food and Agriculture Organization: Rome, Italy.
Priya, P., Muthaiah, U. and Balamurugan, M. 2018. Predicting yield of the crop using machine learning algorithm. Int. J. Eng. Sci. Res. Technol., 7(1): 1-7.
Rahman, A. 2019. Statistics-based data preprocessing methods and machine learning algorithms for big data analysis. Int. J. Artif. Intell., 17(2): 44-65.
Ramesh, C. 2009. Challenges to ensuring food security through wheat. CAB reviews: Perspectives in agriculture, veterinary science, nutrition and natural resources, 4(065): 1-13. https://doi.org/10.1079/PAVSNNR20094065
Surya, P. and Aroquiaraj, I.L. 2018. Crop Yield Prediction in Agriculture using Data Mining Predictive Analytic Techniques. Int. J. Res. Anal. Rev., 5(4): 783-787.
Tripathi, A.D., Mishra, R., Maurya, K.K., Singh, R.B. and Wilson, D.W. 2019. Estimates for world population and global food availability for global health The role of functional food security in global health (pp. 3-24): Elsevier. https://doi.org/10.1016/B978-0-12-813148-0.00001-3
Yadav, N. 2020. Machine learning in agriculture: techniques and applications. https://doi.org/10.33564/IJEAST.2020.v05i07.018
Zia-ur-Rehman. 2017. Statistical analysis to determine the response of major wheat varieties under identical conditions: a case study of district Bahawalpur. M.Phil theis, Department of Stististics, The islamia university of Bahawalpur.
To share on other social networks, click on any share button. What are these?