

Intravenous Administration of Arecoline Induces Biphasic Modulations in Blood Pressure in Anaesthetized Rats


Intravenous Administration of Arecoline Induces Biphasic Modulations in Blood Pressure in Anaesthetized Rats
Meiping Deng1, Xiaowen Ye1, Jiashan Wu1, Lijuan Chen1, Xiaoxia Jiang1, Changzheng Zhang1, Peiling Zhou1* and Yi Luo2*

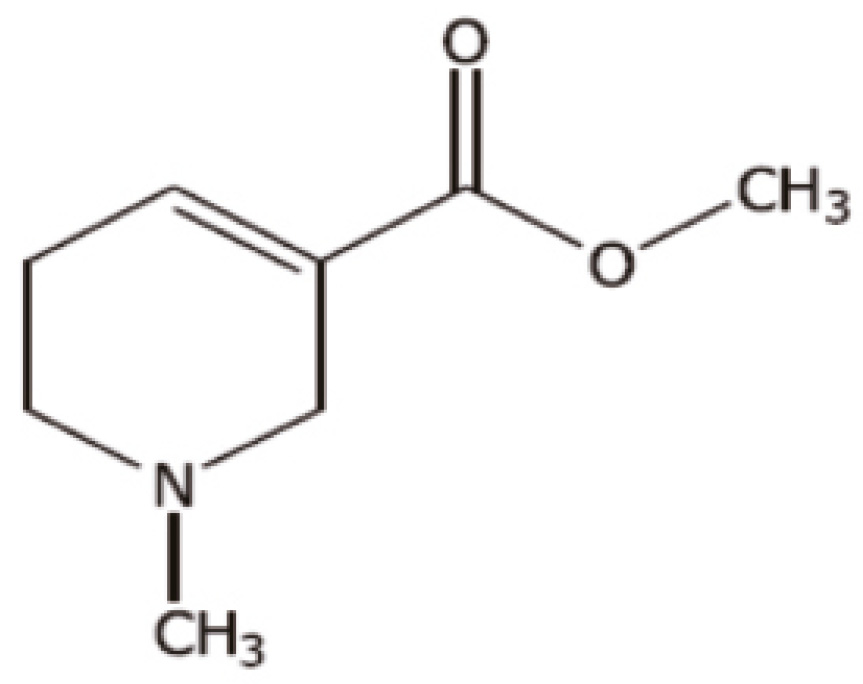
The molecular formula of arecoline.
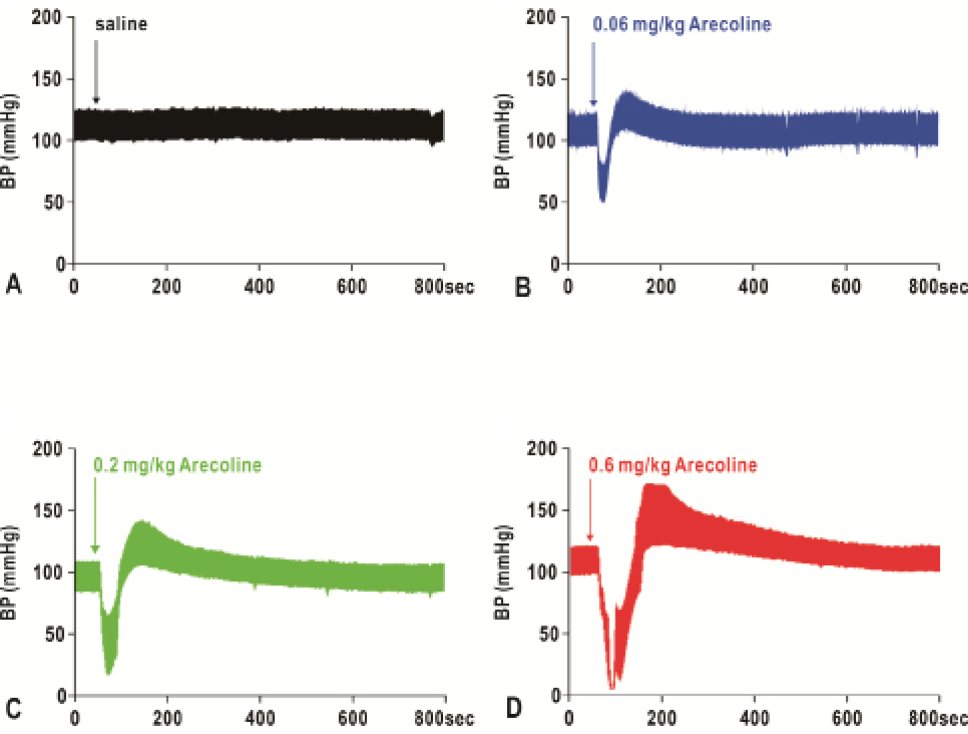
Representative recordings of blood pressure (BP) changes after intravenous injections of arecoline. (A) saline; (B-D) 0.06, 0.2 and 0.6 mg/kg arecoline, respectively, in which the BP exhibited biphasic regulations: an initial downregulation followed by a subsequent upregulation. Arrow: time of injection. iv: intravenous injection.
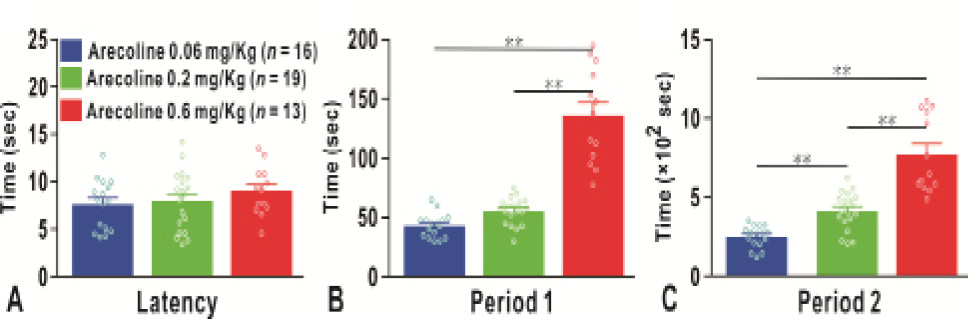
The reaction time for BP changes after intravenous injection of arecoline. (A) The latency of BP changes; (B) the duration of BP downregulation in Period 1; (C) the duration of BP upregulation in Period 2. The circles denote raw data; numbers presented in parentheses denote the number of measurements. **P < 0.01.
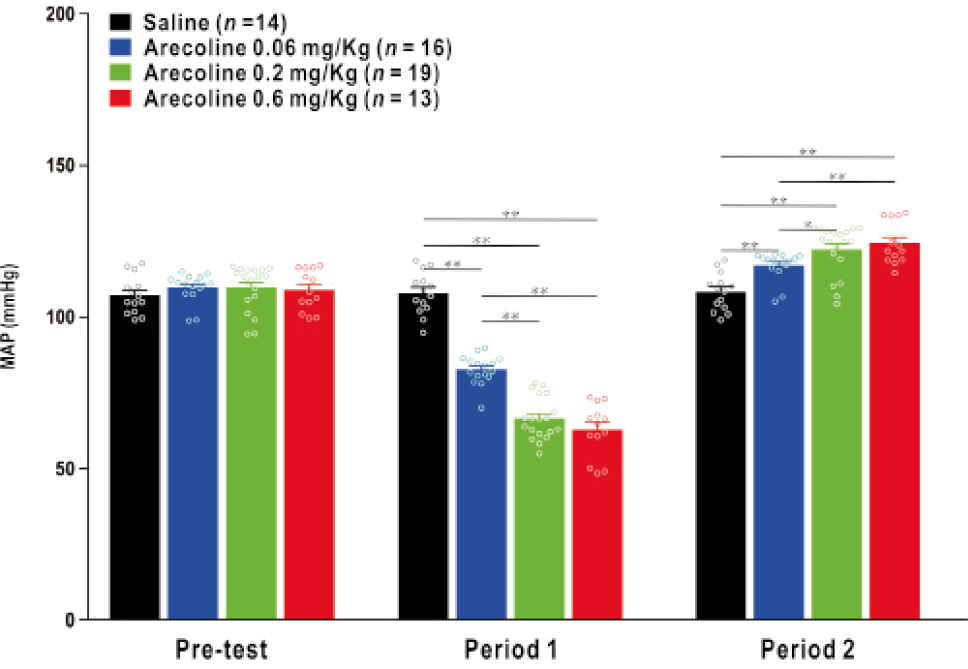
Mean arterial pressure (MAP) changes after intravenous injection of arecoline. No significant differences were observed among groups (0.06, 0.2 and 0.6 mg/kg of arecoline) in the pre-test, but a remarkable decrease was observed in Period 1 followed by a marked increase in Period 2, after intravenous arecoline treatments. *P < 0.05; **P < 0.01.

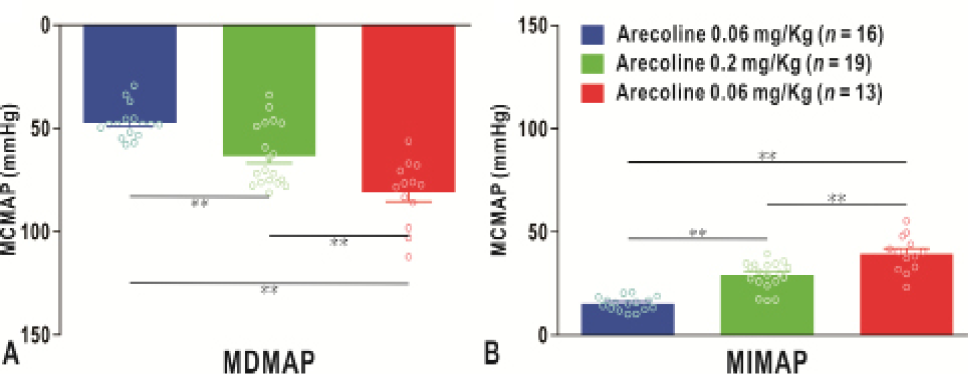
The maximum changes in MAP after intravenous injection of arecoline. (A) Dose-dependent increases in MDMAP; (B) dose-dependent increases in MIMAP. MDMAP: maximum decreased MAP; MIMAP: maximum increased MAP. **P < 0.01.

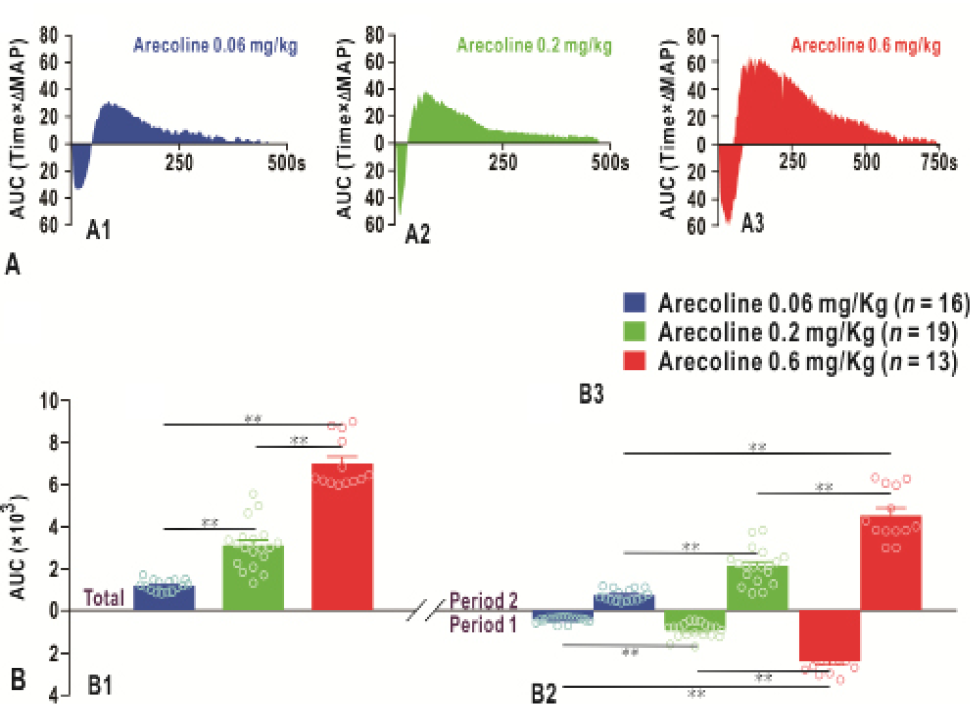
The area under curve (AUC, MAP change relative to the reaction time) after intravenous injections of arecoline. (A) Representative AUCs of different treatment groups (0.06, 0.2 and 0.6 mg/kg of arecoline). (B) Histograms of the AUCs among groups; B1, the total AUC; B2, AUC in Period 1; B3, AUC in Period 2. *P < 0.05; **P < 0.01.


