Submit or Track your Manuscript LOG-IN

Land Suitability Assessment and Soil Organic Carbon Stocks as Two Keys for Achieving Sustainability of Oil Palm (Elaeis guineensis Jacq.)

Land Suitability Assessment and Soil Organic Carbon Stocks as Two Keys for Achieving Sustainability of Oil Palm (Elaeis guineensis Jacq.)

Didiek Hadjar Goenadi1,2*, Roy Hendroko Setyobudi3,4, Erkata Yandri3,4, Kiman Siregar5,6, Aris Winaya7, Damat Damat7, Wahyu Widodo7, Ahmad Wahyudi7, Praptiningsih Gamawati Adinurani4,8
Maizirwan Mel9, Ivar Zekker10, Muhammad Zul Mazwan7, Devi Dwi Siskawardani7
Endang Dwi Purbajanti11 and Ida Ekawati12

1Indonesian Research Institute for Biotechnology and Bioindustry, Bogor 16128, West Java, Indonesia; 2Indonesian Inventor Association, Special Capital Region of Jakarta 12520, Indonesia; 3Renewable Energy Graduate School, Darma Persada University. Jakarta 13450, Indonesia; 4Indonesian Association of BioEnergy Scientists and Technologists (IABEST), Jakarta 10340, Indonesia; 5Faculty of Agriculture, Syah Kuala University, Banda Aceh 23111, Indonesia; 6Indonesian Life Cycle Assessment Network (ILCAN), Serpong Tangerang, 15314, West Java, Indonesia; 7Faculty of Agriculture, University of Muhammadiyah Malang, Malang 65145, East Java, Indonesia; 8Faculty of Agriculture, Merdeka University of Madiun, Madiun 63133, East Java, Indonesia; 9Faculty of Engineering – Biotechnology, International Islamic University Malaysia 50728 Kuala Lumpur, Malaysia; 10Institute of Chemistry, University of Tartu, 50411 Tartu, Estonia; 11Faculty of Animal and Agricultural Sciences, Diponegoro University, Semarang 50275, Central Java, Indonesia; 12Faculty of Agriculture, Wiraraja University, Sumenep 69451, East Java, Indonesia.

*Correspondence | Didiek Hadjar Goenadi, Indonesian Research Institute for Biotechnology and Bioindustry, Bogor 16128, Indonesia; Email: dhg_rpn@yahoo.com

Figure 1:

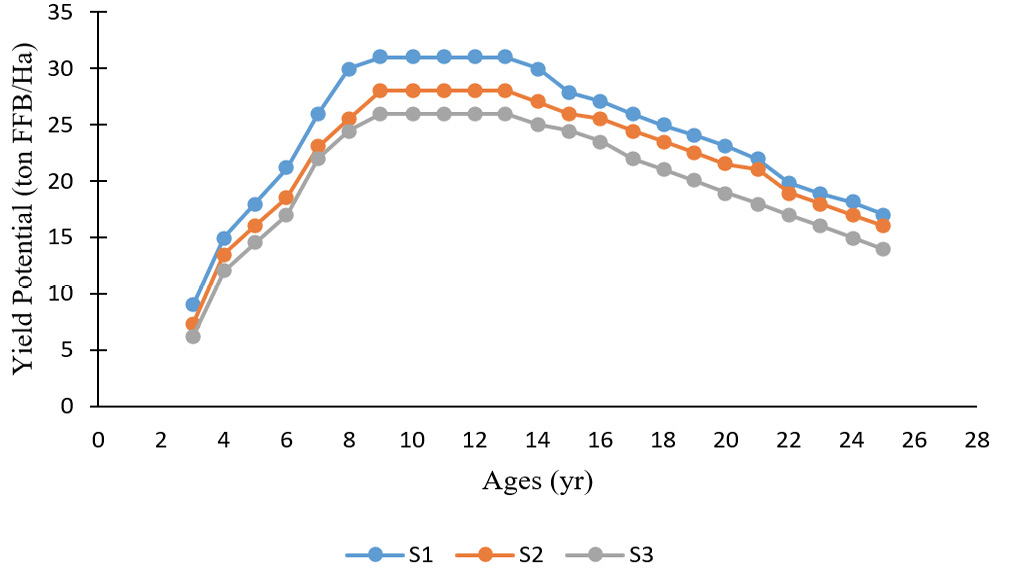
Yield patterns of oil palm on different land suitability classes for oil palm (PPKS, 2010).

Figure 2:

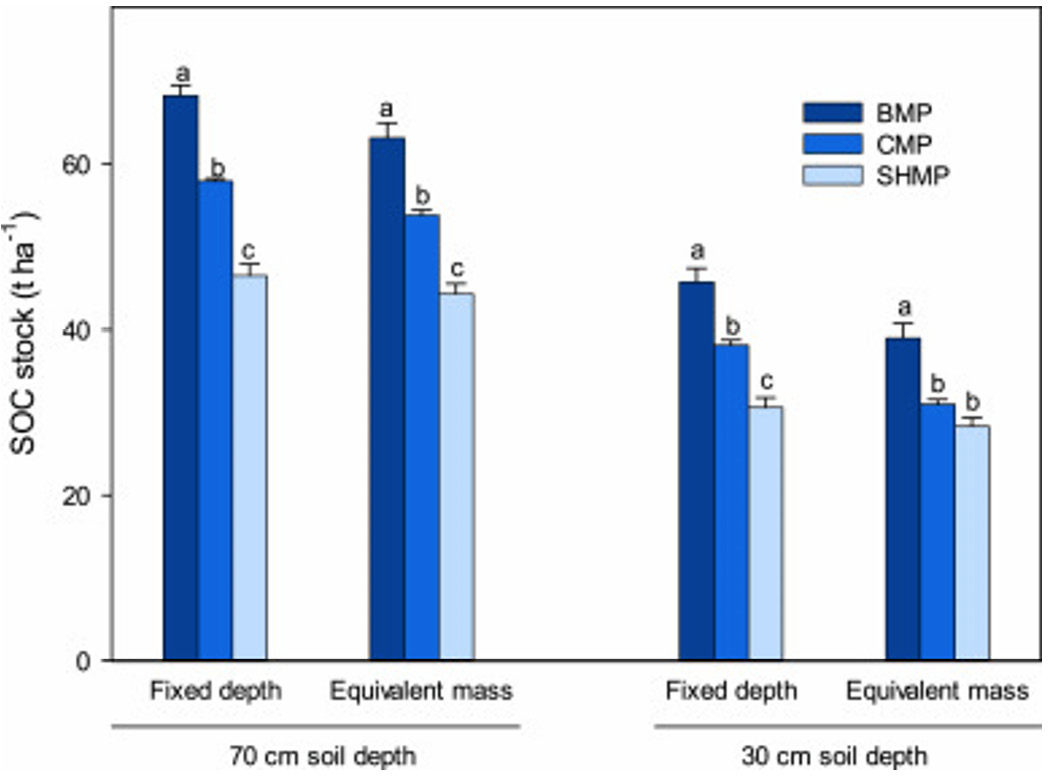
Total SOC stock patterns of upper 70 cm and upper 30 cm soils under three management systems, calculated using fixed-depth and equivalent soil mass approaches regarding relative areas of four management zones. Different letters denote significant differences among management systems (P < 0.05) (Rahman et al., 2021).

Figure 3:

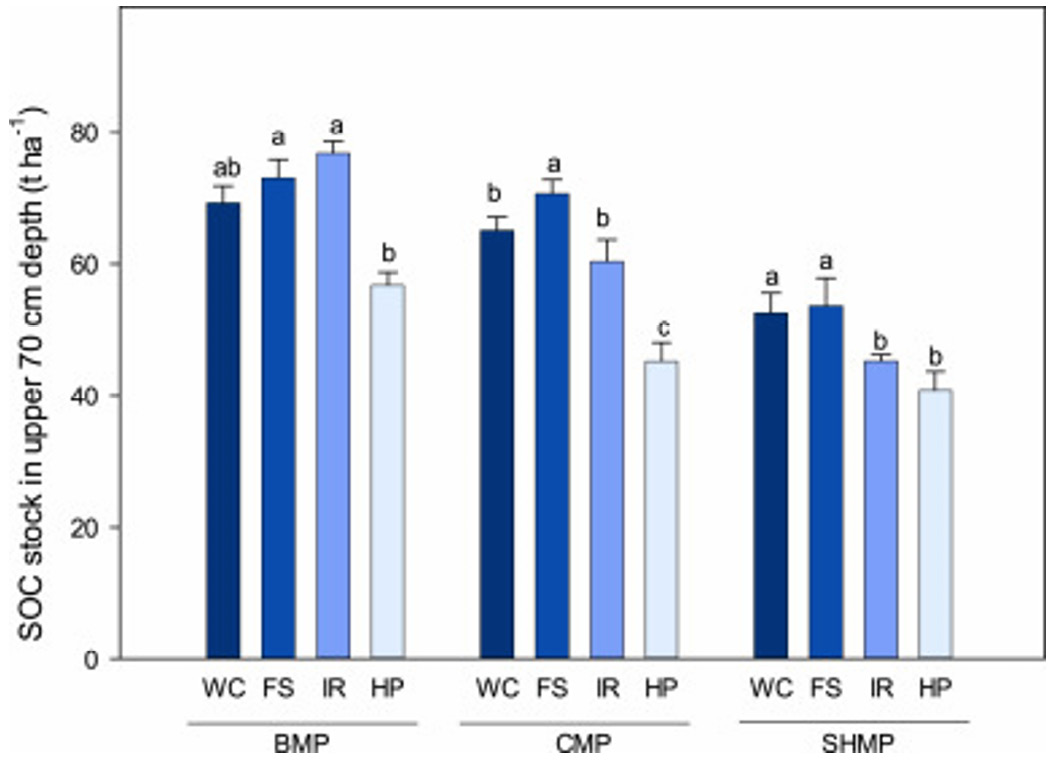
SOC stock patterns in four management zones at different depths under three management systems (WC = weeded circle, FS = frond stack, IR = interrow, and HP = harvesting path). Different letters indicate SOC stock significance (P < 0.05) of upper 70 cm in different management zones per management system (Rahman et al., 2021).

Figure 4:

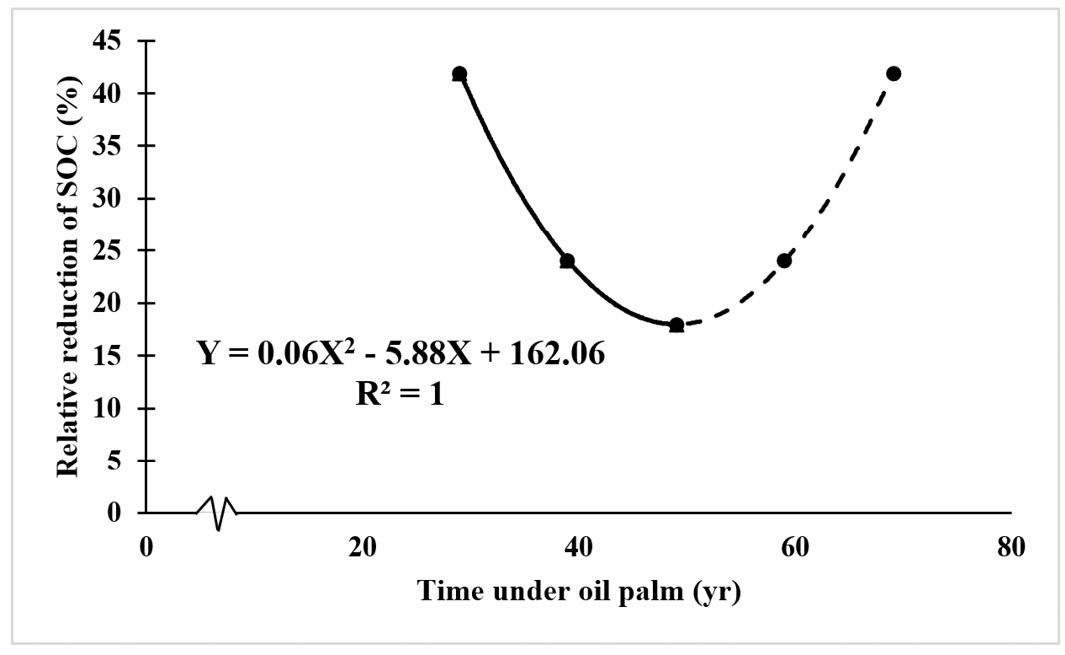
Pattern of SOC reduction and presumed recovery during oil palm planting cycles (data extrapolated from (Rahman et al., 2021).

Sarhad Journal of Agriculture

March

Sarhad Journal of Agriculture, Vol.40, Iss. 1, Pages 01-262

Featuring

Click here for more

Subscribe Today

Receive free updates on new articles, opportunities and benefits


Subscribe Unsubscribe