
Maize Productivity as Influenced by Potassium under Reduced Irrigation Regimes


Maize Productivity as Influenced by Potassium under Reduced Irrigation Regimes
Salman Ali*, Inamullah, Muhammad Arif, Mehran Ali, Muhammad Owais Iqbal, Fazal Munsif and Arsalan Khan

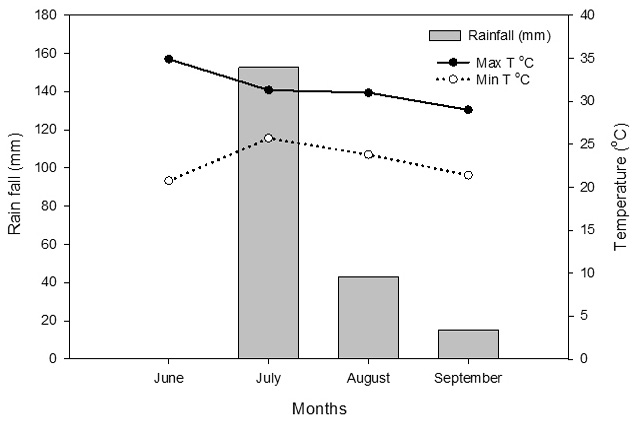
Meteorological data of the experimental site during the crop growth period.
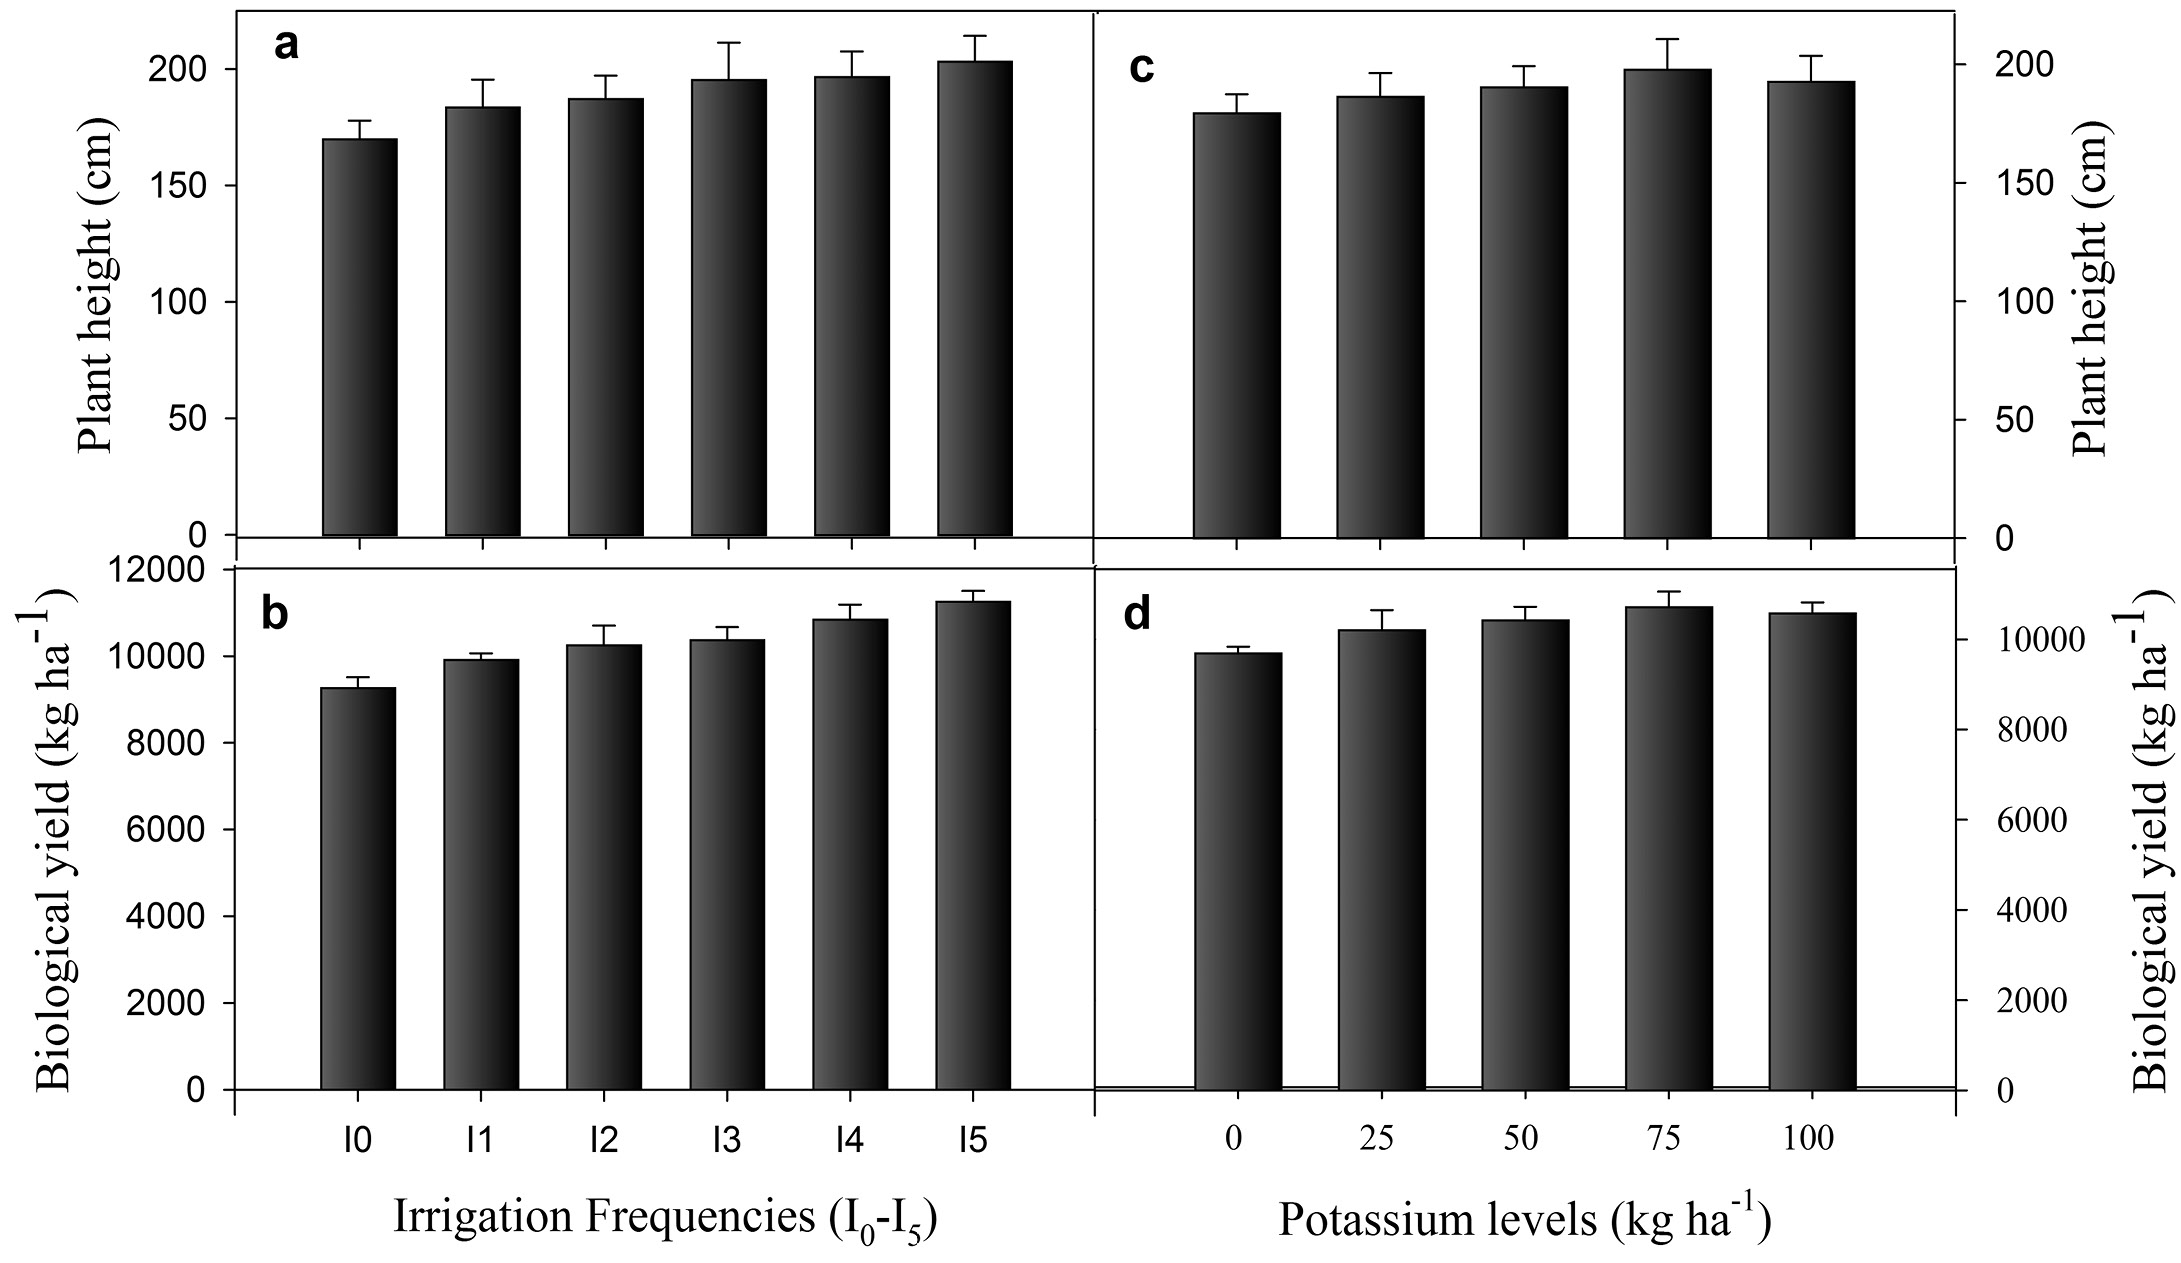
Plant height and biological yield of maize as affected by irrigation frequencies and K fertilization. Data presented in each bar are the means of three replicates while Error bars are standard errors of replicated data. I0 (zero or control irrigation), I1 (irrigation at V1 stage), I2 (two irrigations; each at V1 and V7 stage), I3 (three irrigations; each at V1, V7 and VT stage), I4 (four irrigations; each at V1, V7, RT and R2 stage) and I5 (five irrigations; each at V1, V7, RT, R2 and R4 stage).
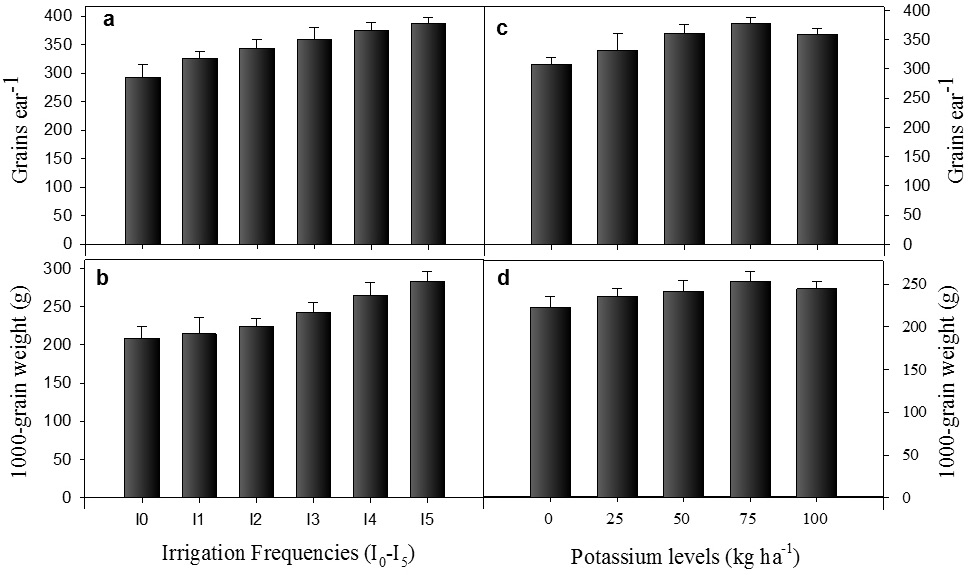
Grains ear-1 and 1000-grain weight (g) of maize as affected by irrigation frequencies and K fertilization. Data presented in each bar are the means of three replicates while Error bars are standard errors of replicated data. I0 (zero or control irrigation), I1 (irrigation at V1 stage), I2 (two irrigations; each at V1 and V7 stage), I3 (three irrigations; each at V1, V7 and VT stage), I4 (four irrigations; each at V1, V7, RT and R2 stage) and I5 (five irrigations; each at V1, V7, RT, R2 and R4 stage).

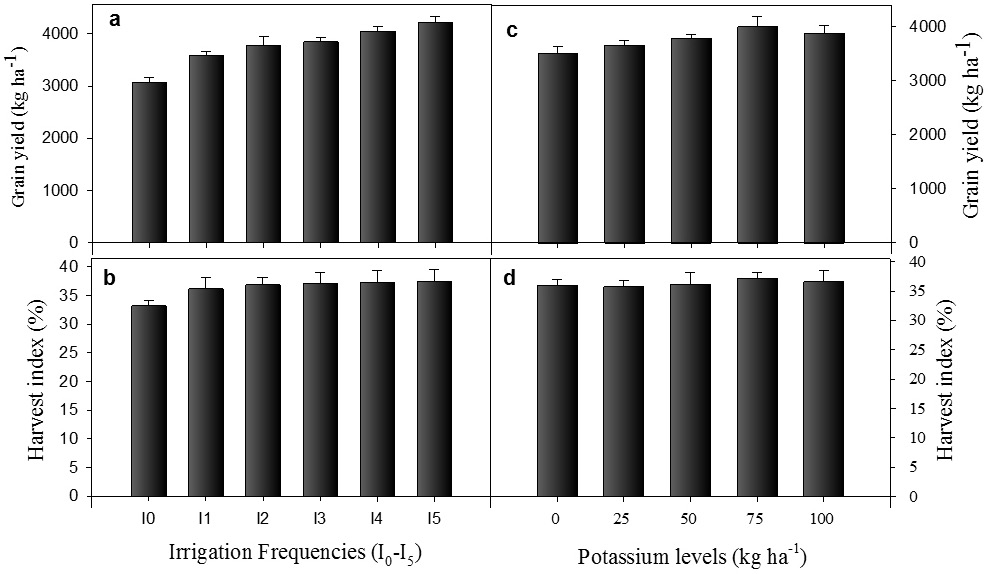
Grain yield (kg ha-1) and harvest index (%) of maize as affected by irrigation frequencies and K fertilization. Data presented in each bar are the means of three replicates while Error bars are standard errors of replicated data. I0 (zero or control irrigation), I1 (irrigation at V1 stage), I2 (two irrigations; each at V1 and V7 stage), I3 (three irrigations; each at V1, V7 and VT stage), I4 (four irrigations; each at V1, V7, RT and R2 stage) and I5 (five irrigations; each at V1, V7, RT, R2 and R4 stage).
Interaction of irrigation frequencies and K fertilization for a) grains ear-1 and b) 1000-grain weight (g) of maize. Data presented in each bar are the means of three replicates while Error bars are standard errors of replicated data. I0 (zero or control irrigation), I1 (irrigation at V1 stage), I2 (two irrigations; each at V1 and V7 stage), I3 (three irrigations; each at V1, V7 and VT stage), I4 (four irrigations; each at V1, V7, RT and R2 stage) and I5 (five irrigations; each at V1, V7, RT, R2 and R4 stage).

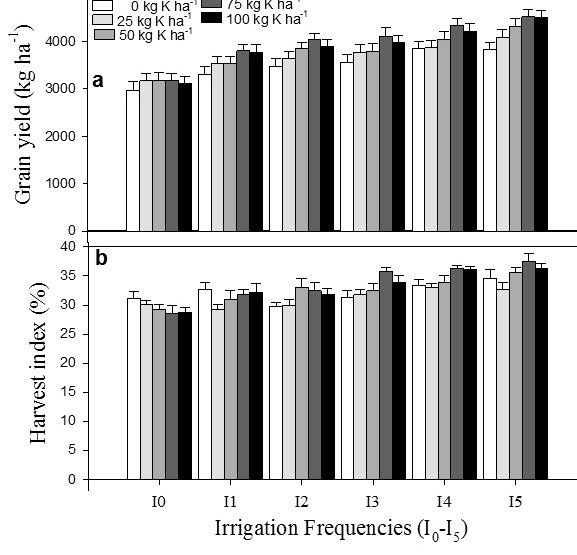
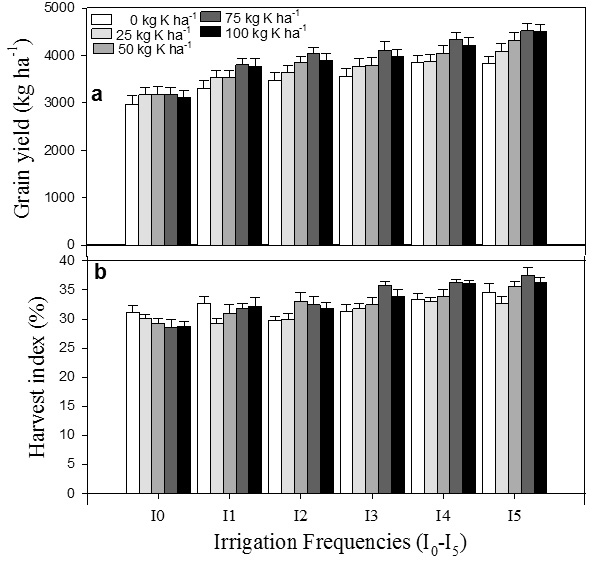
Interaction of irrigation frequencies and K fertilization for a) grain yield (kg ha-1) and b) harvest index (%) of maize. Data presented in each bar are the means of three replicates, while Error bars are standard errors of replicated data. I0 (zero or control irrigation), I1 (irrigation at V1 stage), I2 (two irrigations; each at V1 and V7 stage), I3 (three irrigations; each at V1, V7 and VT stage), I4 (four irrigations; each at V1, V7, RT and R2 stage) and I5 (five irrigations; each at V1, V7, RT, R2 and R4 stage).


