

Mining the SNPs of Human Low Density Lipoprotein (LDL) related Gene APOB through in silico Approaches


Mining the SNPs of Human Low Density Lipoprotein (LDL) related Gene APOB through in silico Approaches
Muneeza Zafar1,2,3, Fazli Rabbi Awan2,*, Munazza Raza Mirza3,*, Sumaira Nishat2,4, Sajid Ali Rajput5 and Imran Riaz Malik1,*

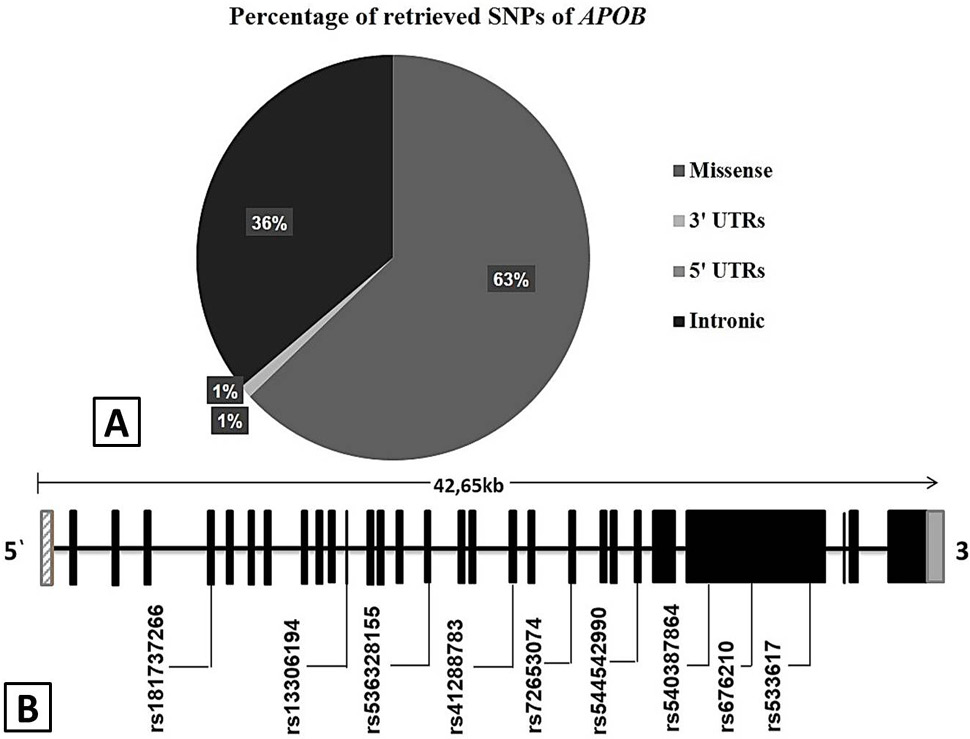
A, Pie chart of retrieved validated SNPs of APOB from NCBI and Ensembl data bases. It includes 295 (62%) missense, 170 (36%) intronic, 4 (1%) 3′ UTR and 5 (1%) 5′-UTR. B, Convergent deleterious and functionally important SNPs are located in distinct exonic region of APOB gene. The 3’ and 5’ un-translated regions are represented by hatched bars and the exons are represented by filled bars. The APOB amino acid position is relative to Gene Bank Accession number NC_000002. 12.
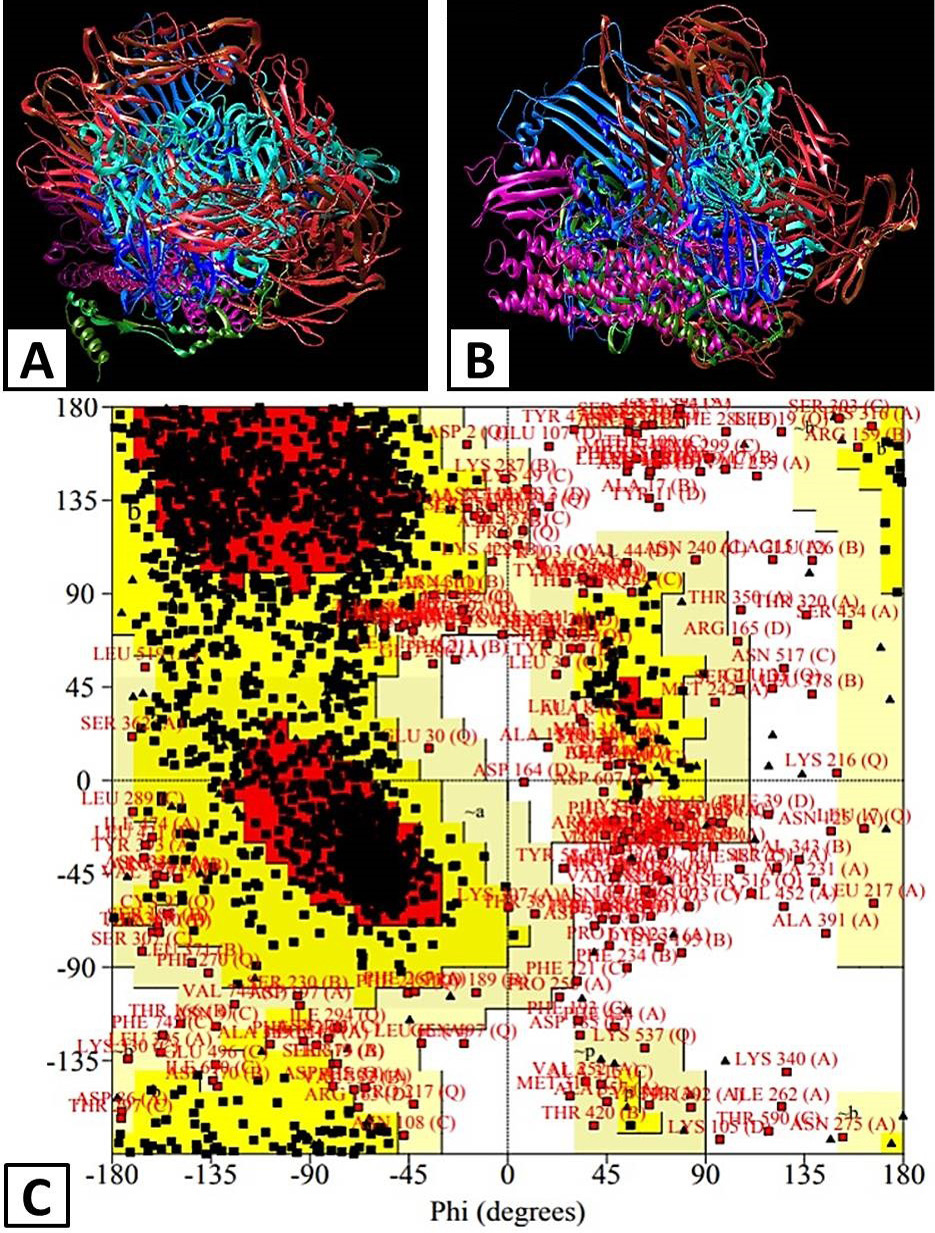
Predicted Model of APOB protein by using UCSF Chimera. a) Front view of the predicted model. B) Lateral view of the predicted model. C) Ramachandran plot of predicted APOB model by using PROCHECH. Region of A, B and L were considered core regions. a, b, l and p showed allowed region, ~a, ~b, ~l and ~p represents additional allowed region and XX for disallowed region.
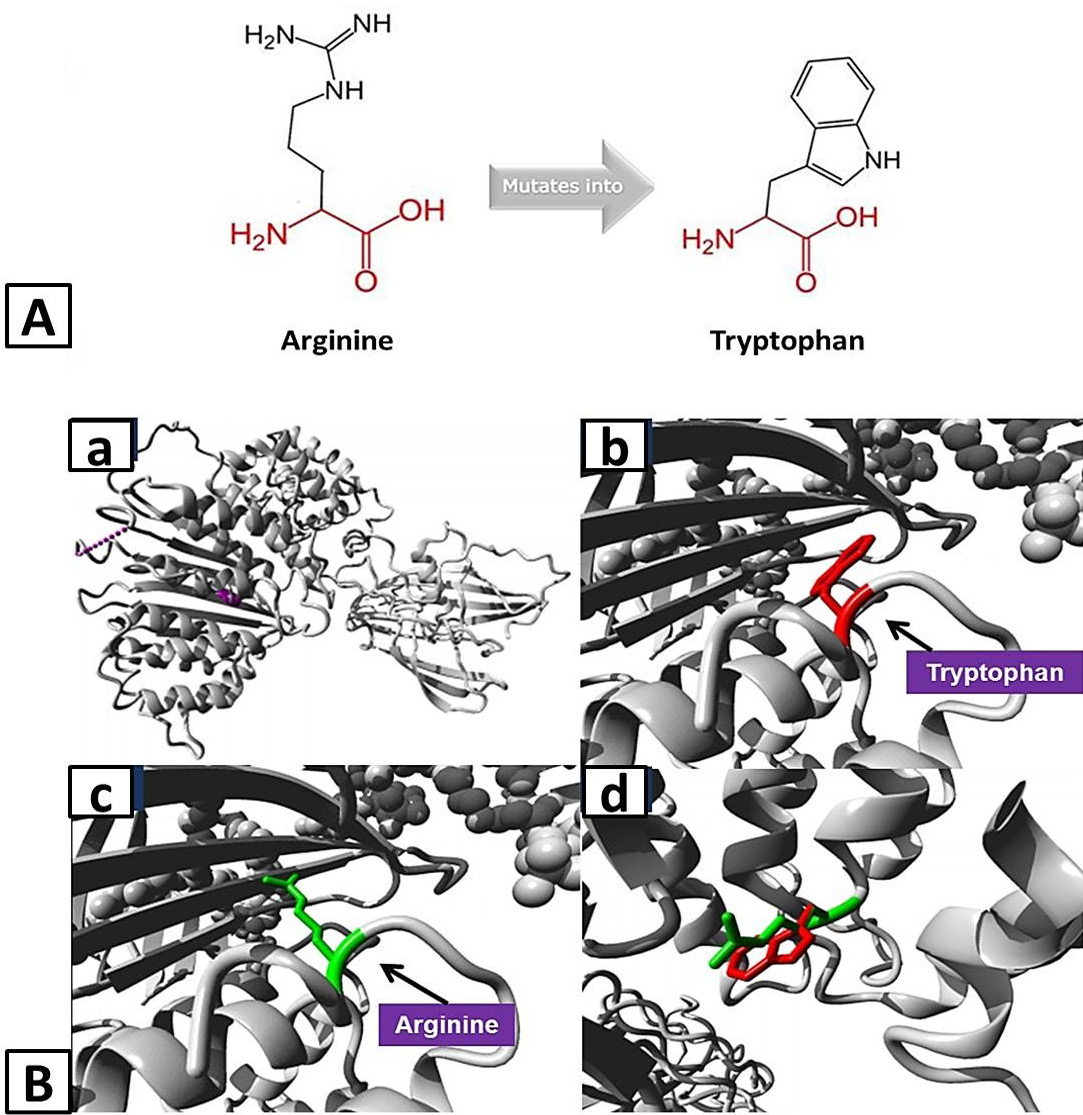
A, Schematic structures of the original (left) Arginine and the mutant (right) amino acid tryptophan for variant Arg532Trp of APOB created by HOPE tool. The backbone, which is the same for each amino acid, is colored red and the side chain, unique for each amino acid, is colored black. B, Homology models of ApoB representing structural impact of variant Arg532Trp: a, Overview of the protein in ribbon-presentation with protein is colored grey, and the side chain of the mutated residue is colored magenta shown as small balls; b, Close-up of the mutation with protein is colored grey and red represent side chain of mutant residue; c, Close-up of the mutation with protein is colored grey and green represent side chain of wild-type residue; d, Close-up of the mutation with both wild-type and mutant residues side chain on the protein.


