

Optimization of Tannase Production from Raoultella ornithinolytica using Corn (Zea mays) Leaves in Solid State Fermentation


Optimization of Tannase Production from Raoultella ornithinolytica using Corn (Zea mays) Leaves in Solid State Fermentation
Hafiz Abdullah Shakir1*, Iqra Javed1, Muhammad Irfan2*, Shaukat Ali3, Muhammad Khan1, Farah Rauf Shakoori1, Javed Iqbal Qazi1 and Muhammad Abrar Yousaf1

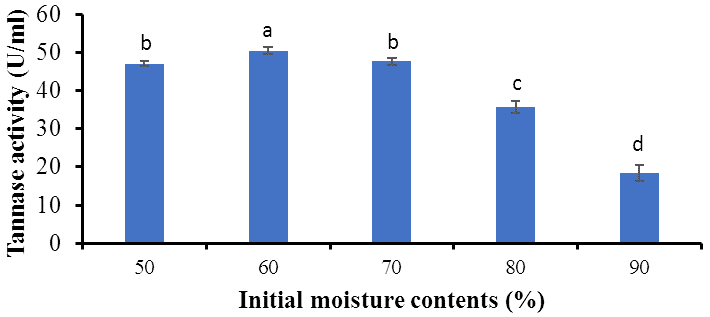
Fig. 1.
Tannase production from R. ornithinolytica in SSF using different initial moisture contents of substrate. Different alphabet on Means±SD (bars) showed significant difference (Tukey’s test, P<0.001).
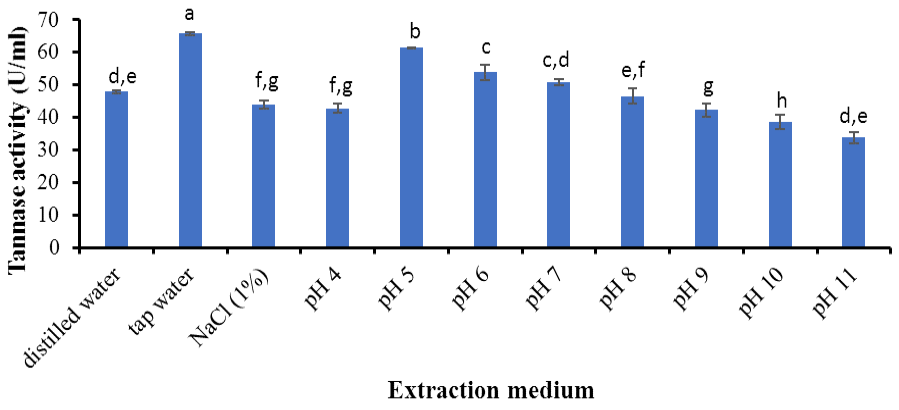
Fig. 2.
Tannase production from R. ornithinolytica in SSF using different extraction media.
For details of statistical analysis, see Figure 1.

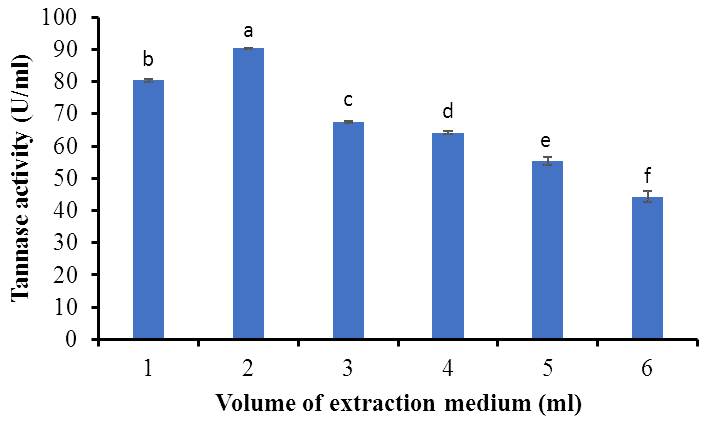
Fig. 3.
Tannase production from R. ornithinolytica in SSF using different volumes (ml) of extraction medium.
For details of statistical analysis, see Figure 1.

Fig. 4.
Tannase production from R. ornithinolytica in SSF in different physico-chemical conditions.
For details of statistical analysis, see Figure 1.

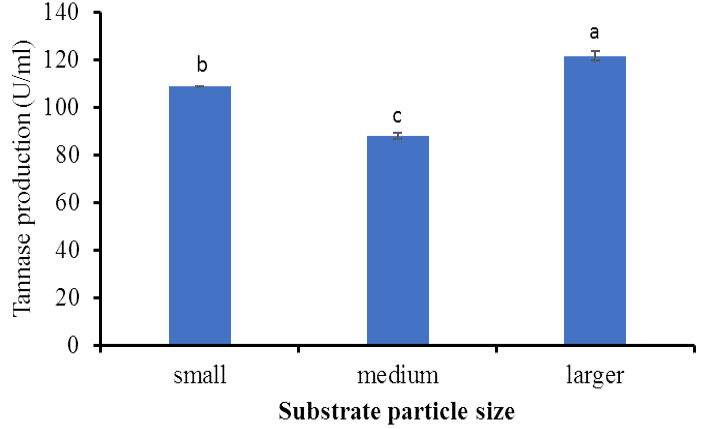
Fig. 5.
Tannase production from R. ornithinolytica in SSF using different substrate particle size (small, 2.8 mm; medium, 3.4 mm; large, 4.0 mm).
For details of statistical analysis, see Figure 1.

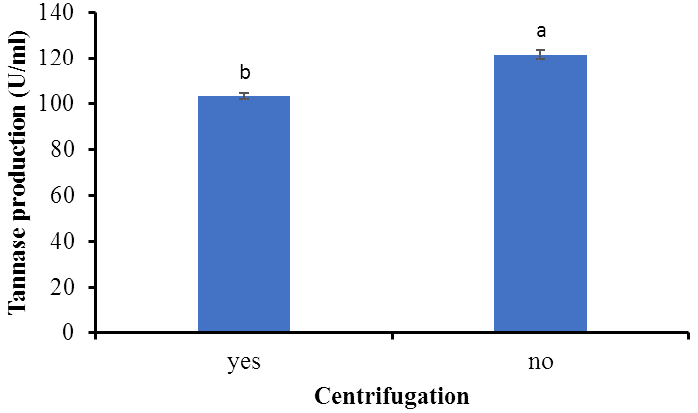
Fig. 6.
Tannase production from R. ornithinolytica in SSF with and without centrifugation.
For details of statistical analysis, see Figure 1.
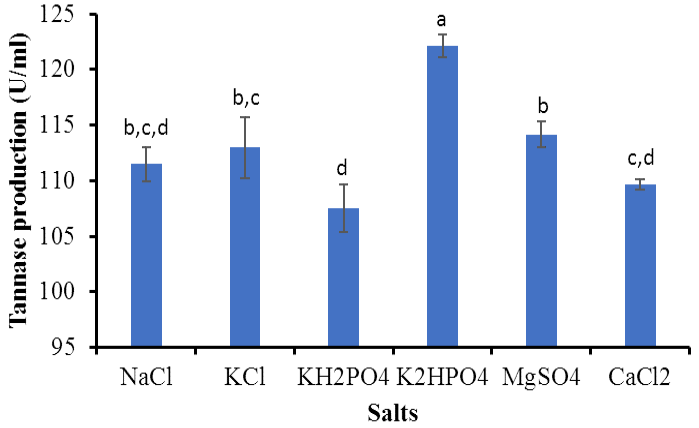
Fig. 7.
Tannase production from R. ornithinolytica in SSF using different salts.
For details of statistical analysis, see Figure 1.

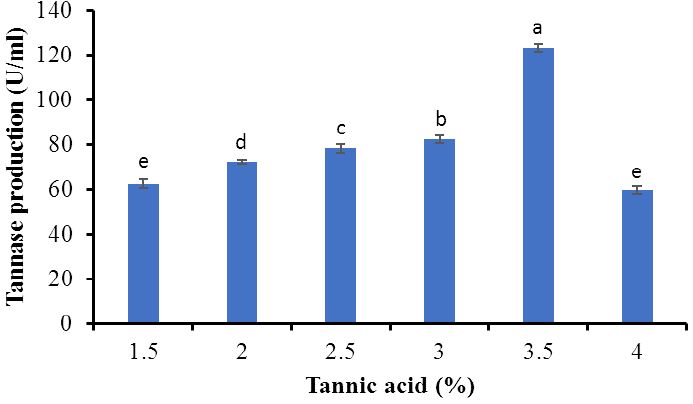
Fig. 8.
Tannase production from R. ornithinolytica in SSF using different tannic acid concentrations (%).
For details of statistical analysis, see Figure 1.

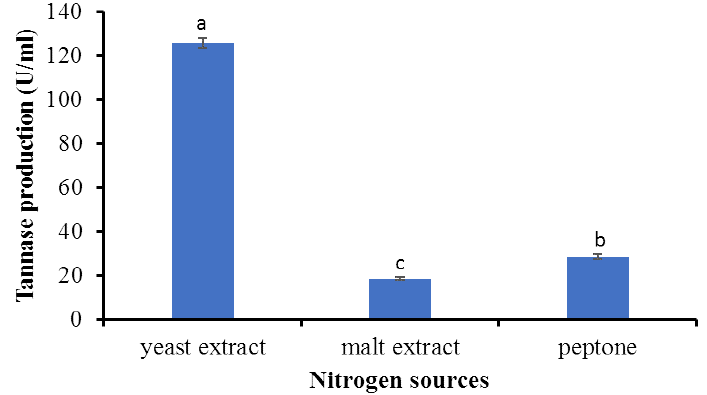
Fig. 9.
Tannase production from R. ornithinolytica in SSF using different organic nitrogen sources.
For details of statistical analysis, see Figure 1.

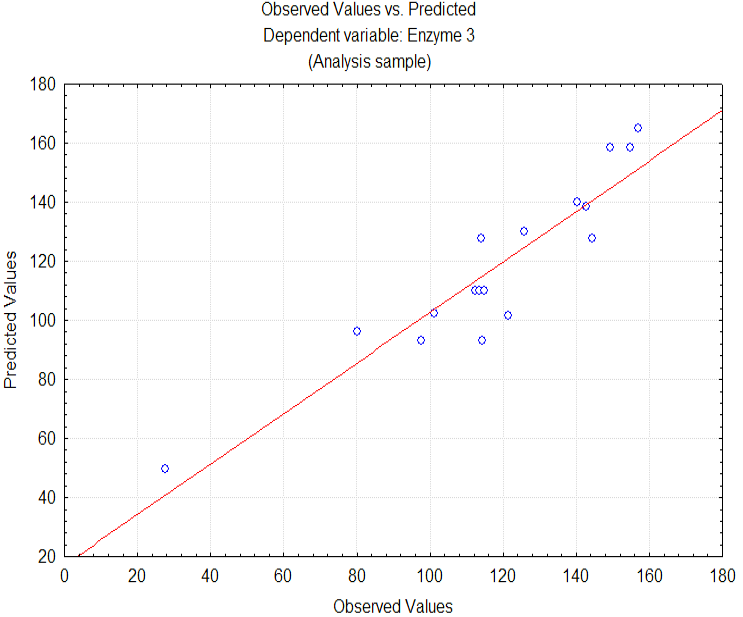
Fig. 10.
The residual plot of experimental and predicted response for tannase production.

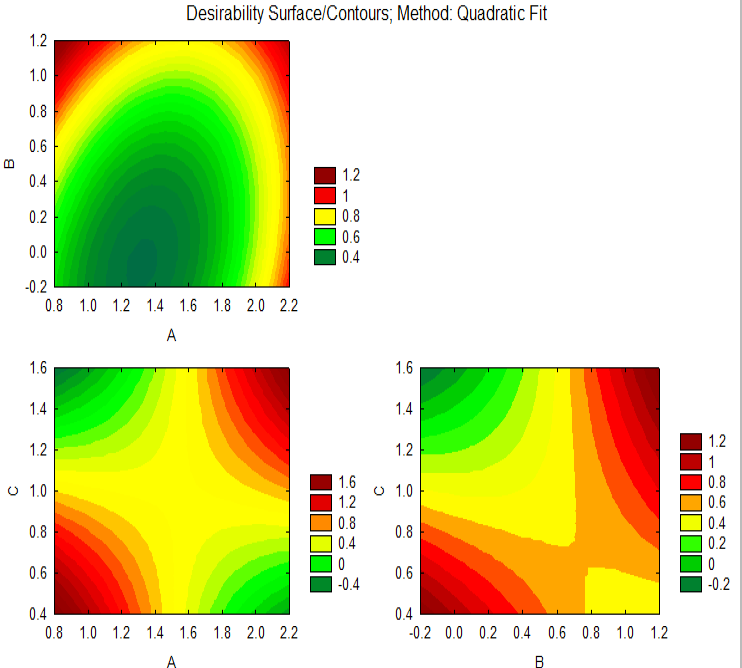
Fig. 11.
Contour plots of tannase production from R. ornithinolytica showing the interaction of tannic acid (A), K2HPO4 (B) and yeast extract (C) concentrations.
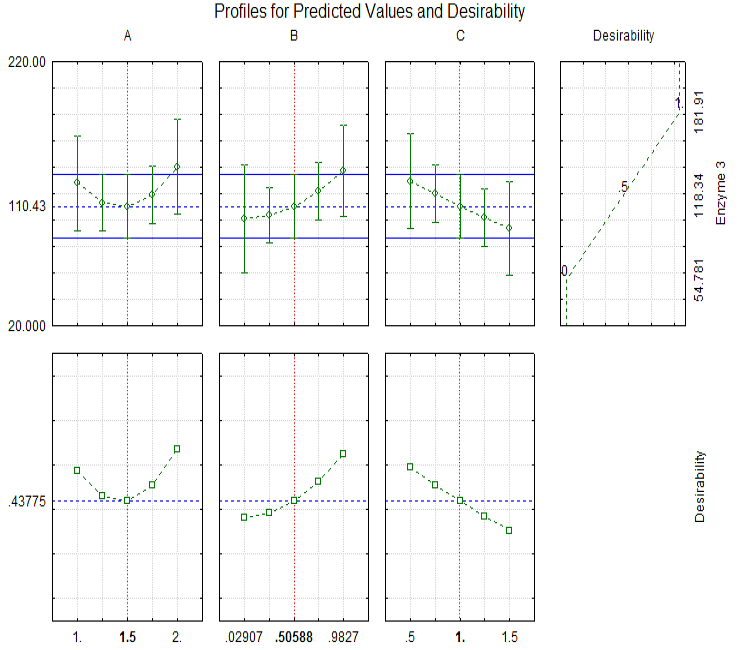
Fig. 12.
Desirability chart for tannase production by R. ornithinolytica in SSF using RSM.
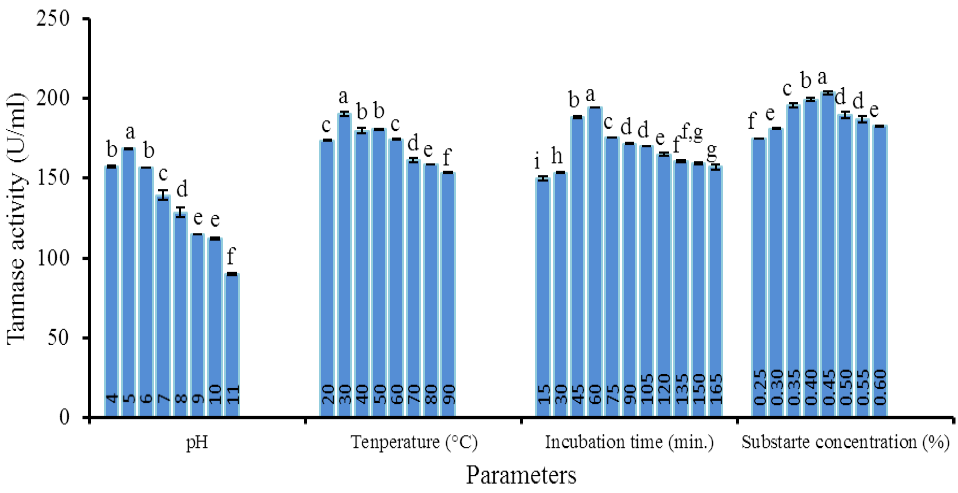
Fig. 13.
Tannase activity in different physico-chemical conditions.
For details of statistical analysis, see Figure 1.
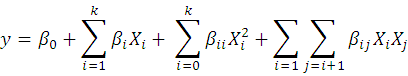
Equation 1
June 2023
Vol. 55, Iss. 3, Pages 1003-1500

