

Performance Evaluation of Beekeeping Farms: A Case Study from Gümüşhane, Turkey


Performance Evaluation of Beekeeping Farms: A Case Study from Gümüşhane, Turkey
Nilgun Dogan1,* and Hakan Adanacioglu2
1Aydın Doğan Vocational School, Gümüşhane University, 29000, Gumushane, Turkey
2Department of Agricultural Economics, Faculty of Agriculture, Ege University, 35100, Izmir, Turkey
ABSTRACT
The main purpose of this study is to determine the economic performance of the beekeeping farms. For this purpose, a survey was done in Kelkit County, in northeastern Turkey. The performances of the beekeeping farms were evaluated by cost, profitability and efficiency analysis. The cost of a unit of honey was US$3.16 and the average price paid to the beekeepers was US$6.78. The absolute and relative profits were calculated as US$3.62 and US$2.14, respectively. The efficiency of the beekeeping farms was measured using Data Envelopment Analysis. The results of output- and input-oriented constant return-to-scale (CRS) analysis indicated an average efficiency value of 59.34%. The output- and input-oriented variable return-to-scale (VRS) analysis showed average efficiencies of 75.42% and 78.95%, respectively. The efficiency of the beekeeping farms and the beekeeping experience were positively correlated. Both the output- and input-oriented VRS analysis showed that a significant part of the beekeeping farms would approach full effectiveness with a potential improvement of at least 10% both in gross production value, number of hives and variable costs. Improvement suggestions for outputs and inputs are directed towards reduction of all variables except gross production value.
Article Information
Received 17 December 2021
Revised 14 January 2021
Accepted 03 February 2021
Available online 23 July 2021
Authors’ Contribution
ND and HA conceived, designed the study and wrote the paper. ND conducted survey research and collected data. HA analysed the data.
Key words
Beekeeping, Performance of beekeeping farms, Economic performance, Efficiency of beekeeping farms, Efficiency analysis, Constant return-to-scale, Variable return-to-scale, Costs analysis, Gross margin.
DOI: https://dx.doi.org/10.17582/journal.pjz/20201217151232
* Corresponding author: nilgun_stu@hotmail.com
0030-9923/2021/0005-1837 $ 9.00/0
Copyright 2021 Zoological Society of Pakistan
Introduction
Many studies have included honey, which is a direct source of natural energy in human nutrition, as a commodity that indirectly increases the saleable products that can be obtained from agricultural plant production (Potts et al., 2010; Makri et al., 2015; Breeze et al., 2017; Musinguzi et al., 2018; Alropy et al., 2019; Gratzer et al., 2019; Sari et al., 2020; Thomas and Tounkara, 2020). In the world; the history of beekeeping dates back to ancient civilisations in South America (Ricalde et al., 2006), in Europe (Potts et al., 2010), in North America (Colla and MacIvor, 2017), in Asia (Kohsaka et al., 2017), in the Arabian Peninsula (Al-Ghamdi et al., 2017) in Africa (Rasa, 2019), as well as in Anatolia (Akkaya and Alkan, 2007). Small beekeeping activities were traditionally carried out with natural hives in the past, but honey production today has increased in importance in many countries’ agricultural economies. Beekeeping now ranks among the priority occupations in the economies of agriculture-based countries, and is especially important in rural development. Increasing the number and quality of bee products to meet international standards depends on strong economic performance of beekeeping enterprises.
According to FAOs data India has the world’s largest number of bee colonies, at 12.25 million, followed by China mainland (9.08 million), Turkey (8.13 million), Iran (7.52 million), and Ethiopia (6.22 million). China is first in the world in terms of honey production (444 thousand tons), followed by Turkey (109 thousand tons), Canada (80 thousand tons), Argentina (78 thousand tons), and Iran (75 thousand tons) (FAOSTAT, 2019). Although Turkey is one of the largest honey-producing countries in the world, the value of its exports remains relatively low in comparison to other countries.
China ranks first in honey production export value, at 235.31 million U.S. dollars, followed by New Zealand at 230.18 million U.S. dollars and Argentina at 142.09 million U.S. dollars (FAOSTAT, 2019). Notably, Argentina is third place in the world in exports, with 2.98 million colonies and an annual honey production of 78 thousand tons. By contrast, Turkey, with its 24.58 million U.S. dollars export value, ranks 21st in the world despite its large number of hives and substantial honey production. Clearly, Turkey is not effective in the global market in terms of its honey production. This result suggests that the techniques used and the economics of beekeeping in Turkey should be examined.
Maximising the beekeeping potential and enabling producers to realise a more profitable production requires more research on the effectiveness of Turkey’s beekeeping enterprises. Therefore, measuring the technical efficiency of beekeeping (Alropy et al., 2019), which can be done with a small capital investment, can guide an increase in honey production with the available resources at hand. The main purpose of the present study is to characterise the economic performance and effectiveness of beekeeping enterprises. For this purpose, a survey was performed in Kelkit County, in Gümüşhane province in northeastern Turkey. The main reason for choosing Gümüşhane is that no studies have yet been conducted on the economic performance of beekeepers in this region. Beekeeping (Beula and Anandhy, 2020), by providing employment and profitable production, makes an appreciable contribution to the provincial economy of Gümüşhane.
Materials and methods
The main material for this study was obtained from a survey conducted with beekeeping enterprises in July–August, 2018. Secondary sources of the study were obtained from previous national and international studies. Kelkit County, in Gümüşhane province, was chosen as the research area for the survey. The county attracts foreign beekeepers (migratory) from the surrounding provinces due to the climate, geographic location and flora of the county. In 2018, Gümüşhane had about 41 thousand hives and produced approximately 615 tons of honey (Anonymous, 2018). Analysis of the number of hives and honey production in the province based on its districts identified Kelkit District as having the largest production share, with approximately 17 thousand hives and 441 tons of honey production (Table I).
The sample according to the known or predicted ratio (p) of the population size N is given below (Newbold, 1995).
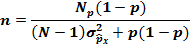
Where, n is sample size, N is number of beekeepers in the Kelkit district, p is proportion of beekeepers on an adequate level (0.50 for maximum sample volume), and σ2ṕx is variance of rate.
The Kelkit district has 110 registered beekeepers in the Bee Registration System (BRS) of the Ministry of Agriculture and Forestry. The beekeepers in the Beekeepers’ Association, producers who were not BRS members, beekeepers with fewer than 30 hives and beekeepers who came to Kelkit as foreign beekeepers were also included in the study, to give a population size of 190 producers. According to the proportional sampling method, the sample size was calculated as 60 with a 90% confidence interval and a 10.5% error rate.
Cost analysis
The costs consisted of six major components: total feed ($/hive), medicine expenses ($/hive), total labour costs ($/hive), other variable costs ($/hive) and fixed costs. The total feed cost included cake and sugar. The fixed cost consisted of depreciations, interest on hives, tools and equipment. The other variable costs covered operating costs, such as wax foundation, fuel and transportation of hives, packaging of the honey (jars/frames/tins), location rental fees, and repairs and maintenance.
While calculating the honey production cost, after summing up the variable costs, a provision for interest representing the opportunity cost was calculated for these costs. This was taken as half of the annual agricultural loan interest rate (7%) applied for beekeeping during the production period. When calculating interest, the Ziraat Bank real interest was applied. The reason for taking half of the interest rate is that the beekeeping season in the Kelkit region where the research was carried out lasts only 6 months. Fixed costs consist of the depreciation of tools-machines, and hives, interest provisions and management provisions. Administrative costs were estimated at 3% of total variable cost. The amortisation ratio for the calculation of tools and equipment was taken as 10%.
Table I.- Colonies, honey production and honey yield by districts in Gümüşhane.
|
District name |
Beekeeper No. |
No. of hives (piece) |
Honey prod.(kg) |
Honey yield (kg/colony) |
|
Kelkit |
110 |
17,395 |
441,570 |
25.38 |
|
Şiran |
43 |
5,002 |
37,065 |
7.41 |
|
Centre |
161 |
11,803 |
72,546 |
6.14 |
|
Köse |
32 |
2,699 |
35,838 |
13.27 |
|
Torul |
39 |
2,232 |
15,435 |
6.91 |
|
Kürtün |
33 |
1,783 |
12,230 |
6.85 |
Source: Anonymous, 2018.
Performance analysis
Efficiency analysis was conducted to reveal the performance of the beekeeping enterprises. For this purpose, Data Envelopment Analysis (DEA), which is one of the most widely used methods in the measurement of effectiveness, was used (Onuç et al., 2018). In DEA, the data were analysed according to constant return-to-scale (CRS) and variable return-to-scale (VRS) models, and estimates were made for both models. The assumptions of both models were used to obtain results of the input- and output-oriented efficiencies. In the input-oriented model approach, target outputs can be achieved with the use of a minimum input. Therefore, this is a savings-tendency approach in terms of resource use. The notations for input-based and constant return-to-scale assumptions are shown below.
min θ, λ θ,
st. –yi +Yλ≥ 0
θxi – Xλ≥ 0
λ≥ 0
Where, θ is a scalar and λ is the vector of N×1 constants. The obtained θ value indicates the degree of efficiency of the ith producer unit. According to the definition of Farrel (1957), this value is between 0 and 1. A value equal to 1 means that the producer unit is above the effective limit. Linear programming solves the problem N times and a θ value, which means the technical efficiency value, is obtained for each unit (Coelli et al., 1998).
The aim of output-oriented analysis is to reach the maximum output level with the present inputs. The notation in the output-based and constant return-to-scale assumption is shown below.
maxΦ, λ Φ,
st. – Φyi+Yλ≥ 0
xi –Xλ≥ 0
λ≥ 0
When the convex constraint N1 ‘λ = 1, a constraint is added to this linear programming problem and a variable return-to-scale and output-based data envelope analysis model is obtained. In this model, the problem of income maximisation is solved as follows:
max λ,yi piyi
st. – yi+Yλ≥ 0
xi –Xλ≥ 0
N1’ λ=1
λ≥ 0,
Where, pi is a vector of input prices for the ith enterprise, and yi is calculated by linear programming. The given output prices (pi) and input levels (xi) show the vector that maximises revenue in output amounts for the ith enterprise (Coelli et al., 2002).
Table II.- Output/input variables in the efficiency analysis of beekeeping farms.
|
Variables used for analysis |
|
Output |
|
Gross Product Value (TRY*) |
|
Inputs |
|
Number of bee hives (number) |
|
Feed costs (TRY) |
|
Medication costs (TRY) |
|
Labour costs (TRY) |
|
Other variable costs (TRY) |
*TRY, Turkish lira.
In this study, the input and output variables were first determined to reveal the effectiveness of the beekeeping enterprises. The determined input-output variables are specified in Table II.
In addition, the potential improvement analyses were conducted from the model estimates for the beekeeping farms. In this analysis, the potential improvement ratios were determined according to the output target values when inefficient beekeeping farms were brought up to the level of the effective reference farms within the cluster.
Table III.- Descriptive statistics of beekeeping farms.
|
Items |
Min. |
Max. |
Mean |
SD |
|
Age of beekeeper (yrs) |
28.00 |
71.00 |
52.03 |
12.04 |
|
Year of education (yrs) |
1.00 |
15.00 |
8.50 |
3.753 |
|
Farming experience (yrs) |
3.00 |
50.00 |
25.00 |
14.68 |
|
Beekeeping experience (yrs) |
1.00 |
50.00 |
19.28 |
12.19 |
|
Household size (person) |
1.00 |
10.00 |
4.30 |
2.036 |
|
Number of family labors (person) |
0.00 |
4.00 |
1.18 |
1.127 |
|
Number of hives (number) |
22.00 |
470.00 |
145.88 |
134.92 |
|
Value of sales of bee products (US$)* |
61.50 |
69322.67 |
13966.28 |
15424.04 |
*The average exchange rates between Turkish Lira (TRY) and the US dollar (USD) for 2018 is $1= 4.813TRY (BÜMKO, 2018).
Results and discussion
Profile of the interviewed beekeeping farms
The profiles of the interviewed beekeeping enterprises are given in Table III. According to the profiles, the mean age of the beekeepers was 52 years, the mean years of education was 8.5 years. Only 16% of the beekeepers were between the ages of 30 and 40 years. When this result was combined with low education levels, this indicated that beekeeping does not attract the young people in the study area. This could lead to difficulty in the development and the application of innovations in the sector. The same findings were found in other beekeeping studies conducted in Turkey (Demen et al., 2015; Özbakır et al., 2016; Çevrimli and Sakarya, 2018; Onuç et al., 2018). Makri et al. (2015) also found similar findings in research conducted in Greece, where the majority of the beekeepers were between 40 and 50 years old and the average years of education were quite low (10 years). Conversely, a similar study (Mbah, 2012) found that the majority (93.3%) of the beekeepers were within the age range of 20–50 years, indicating that the beekeepers were still in their active productive ages, which signified an increase in the output of honey. In one case study (Kinati et al., 2013), the average age was 40.47 years. Based on this finding the researchers concluded that young or middle aged beekeepers were potential groups to consider for developing technical beekeeping activities.
In the present study, the average years of agricultural activities and beekeeping experience were 25 and 19 years, respectively. A similar result (20 years) for the beekeeping experience factor was obtained in the study by Makri et al. (2015). Based on the years of experience in this study, these activities were still continued as an ancestral profession given that, in rural areas where non-agricultural employment opportunities are limited, such as in Kelkit District, agricultural activities constitute the livelihood of most people. Considering the average age and years of experience, promoting beekeeping will clearly be important for the young population, because beekeeping can be performed as a side or hobby profession.
Beekeeping as an additional or main source of income in Turkey may determine the years of experience in beekeeping. Özbakır et al. (2016), Ceyhan and Canan (2017) and Çevrimli and Sakarya (2018) reported in their studies that the vast majority of beekeepers had made beekeeping their main source of income for many years. In this context, if the significant advantages of Turkey in the world honey production market are to reflect on the international market, some policies are needed that allow beekeeping as a side income or hobby. In the present study, the average household size was four persons, indicating that the beekeeping households are very small in the research area. The underlying reason is that beekeeping in the study area has largely been an activity performed by the elderly household head. However, in the study published by Mbah (2012) on the topic of the profitability of honey production, the average size of the household was 12 persons. He also stated that if the household size was large, this would increase the probability of beekeeping, as it is based mainly on family labour. Beekeeping is a type of activity that can be done with family labour, without the need for foreign labour (Oladimeji, 2016). A similar result was obtained (Ceyhan and Canan, 2017) as 1.09 man labour unit.
In the county where the research was conducted, the average number of hives was 146 units. The mean sales value in the production period was calculated as approximately US$13966.
Production costs and profit analysis in the interviewed beekeeping farms
The total costs of the beekeeping farms were determined as fixed and variable costs in this section. The total variable costs per hive were US$69.14 and the total fixed costs were US$6.70 (Table IV), for a total cost of US$75.84 per hive. The ratio of the variable costs within the total production costs during a production period was quite high, at 91.16% of the total costs. Due to these high production costs, the beekeeping farms increased their production capacity to reduce their total and fixed costs. Considering the present honey production in the study area, the beekeepers’ average honey production (24 kg per hive) was higher than Turkey’s average (14.4 kg per hive). Therefore, reducing the highest ratio of inputs in variable expense items, as well as increasing the current average production amounts, would positively affect their operational performance in the current situation.
Table IV.- Honey production costs of the ınterviewed beekeeping farms.
|
Cost Items |
Costs (US$ per hive) |
|
Feed (sugar and cake) costs |
21,65 |
|
Drug (Parasite and disease control) |
0,99 |
|
Wax foundation |
6,95 |
|
Fuel-transport costs |
7,53 |
|
Labor wages |
26,60 |
|
Location rental fees |
1,20 |
|
Jar, tin, frame costs |
1,19 |
|
Repairs and maintenance |
0,70 |
|
Interest on variable costs (2) |
2,33 |
|
Total variable costs (1+2)=3 |
69,14 |
|
The interest on the hive investment** |
0,83 |
|
The interest on the machinery and equipment investment ** |
0,49 |
|
Depreciation for hives |
2,07 |
|
Depreciation for tool and equipment |
1,24 |
|
Administrative costs (%3) |
2,07 |
|
Total fixed costs (4) |
6,70 |
|
Total production costs (3+4)=5 |
75,84 |
*The average exchange rates between Turkish Lira (TRY) and the US dollar (USD) for 2018 is $1= 4.813TRY (BÜMKO, 2018).
Looking at the costs in similar studies, the beekeepers’ operating costs within the total costs were high. However, the ratio of variable costs in total costs obtained in this research was higher. An economic analysis of beekeeping enterprises in the Borno Region in Nigeria showed variable costs that constituted 72.77% of the total costs (Tijani et al., 2011), whereas this ratio was 79.7% in the beekeeping study conducted by Alropy et al. (2019) in Egypt, while Adanacıoğlu et al. (2019) found this ratio to be 89.82% in Edirne province in the Thrace region, and it was 74.81% in the West Guji region of Ethiopia (Rasa, 2019). Total production cost per hive has varied in Turkey. All these findings pointed out the necessity of establishing strategies that reduce the feed and labour costs, which are the most costly items in the operating costs, in order to increase the economic efficiency of the beekeepers’ farms examined in this research. Table V shows the honey yield per hive, the honey cost per kg and the absolute and relative profitability.
While the honey yield was 24 kg in the study area, the average is 14 kg per hive in Turkey. This showed that the beekeepers of Kelkit could achieve the most output amount with certain inputs, but they were not able to use the minimum input rate to reduce the production costs per hive. Therefore, in the next part of this study; the technical efficiency of beekeeping farms was measured to obtain the greatest output with the minimum input of available resources. The honey cost per kg was US$3.16 and the average price paid to beekeepers was US$6.78 (Table V). The absolute profit was US$3.62 and the relative profit was calculated as US$2.14. This showed that the price obtained by the beekeepers in the study area covered their costs. The relative profit is an important indicator that shows whether the price obtained by the beekeepers covers their production costs. It is important in terms of economic performance that the relative profit calculated as the ratio of the price obtained by the producers to the production cost have a value greater than 1.
Table V.- Absolute and relative profit analysis in the interviewed beekeeping farms.
|
Items |
Value |
|
Total production cost per hive (US$) (1) |
75,84 |
|
Honey yield per bee hive (kg) (2) |
24 |
|
Honey cost per kg (US$) (1/2) (3) |
3,16 |
|
Average price paid to beekeepers for honey (US$ per kg) (4) |
6,78 |
|
Absolute profit (US$ per kg) (4-3) |
3,62 |
|
Relative profit (4/3) |
2,14 |
*The average exchange rates between Turkish Lira (TRY) and the US dollar (USD) for 2018 is $1= 4,813TRY (BÜMKO, 2018).
The cost analysis revealed that the production strategies of the related beekeeping farmers were only aimed at making a profit by increasing the production capacity. By contrast, without changing the amount of output, the efficiency could be increased, along with profitability, by using fewer inputs, especially feed and labour.
Technical effectiveness analysis results
The efficiency values of the beekeeping farms are given in Table VI as inputs and outputs. The efficiency scores are classified at 10% intervals in the table, and the number of beekeeping farms in each efficiency class is given. Analysis of the frequency distribution of efficiency ratios for output and input revealed that the number of fully efficient beekeeping farms was around 10 for the CRS and 25 for the VRS assumptions. In other words, the proportion of beekeeping farms that work fully effectively was 16.67% for the CRS assumption, and about 42% for the VRS.
Table VI.- Frequently distribution of output-oriented and input-oriented technical efficiency for interviewed beekeeping farms.
|
Efficiency scores (%) |
Beekeeping farms |
|||
|
CRS |
VRS |
|||
|
TEo |
TEi |
TEo |
TEi |
|
|
0-10 |
2 |
2 |
1 |
0 |
|
11-20 |
9 |
9 |
4 |
1 |
|
21-30 |
3 |
3 |
3 |
3 |
|
31-40 |
5 |
5 |
2 |
2 |
|
41-50 |
6 |
6 |
4 |
4 |
|
51-60 |
5 |
5 |
3 |
6 |
|
61-70 |
5 |
5 |
4 |
6 |
|
71-80 |
7 |
7 |
5 |
3 |
|
81-90 |
4 |
4 |
4 |
4 |
|
91-100 |
4 |
4 |
5 |
5 |
|
Full Efficient |
10 |
10 |
25 |
26 |
|
Mean |
59,34 |
59,34 |
75,42 |
78,95 |
|
Minimum |
1,22 |
1,22 |
2,71 |
17,72 |
|
Maximum |
100,00 |
100,00 |
100,00 |
100,00 |
|
Standard deviation |
30,7210 |
30,7210 |
29,8686 |
25,1721 |
CRS, constant returns to scale; VRS, variable returns to scale; TEo, output oriented technical efficiency; TEi, ınput oriented technical efficiency.
The results of the CRS analysis for output and input showed an average efficiency ratio of 59.34%, whereas the output- and input-oriented analysis had average efficiencies of 75.42% and 78.95%, respectively. There were also those with too low efficiency among the beekeeping farms examined. Indeed, the CRS analysis identified beekeeping farms with a minimum efficiency proportion of 1.22%, while VRS analysis for output and input showed minimum efficiency proportions of 2.71% and 17.72%, respectively. Many studies carried out across the globe have examined the effectiveness of beekeeping farms, and the results of these studies were useful for the evaluation of the efficiency of the beekeeping farms in the present study. An efficiency analysis conducted for beekeeping farms in 15 regions of Greece reported an average technical efficiency rate of 57% with the CRS assumption (Makri et al., 2015), in agreement with the present findings, where the average efficiency score was approximately 59% with the CRS assumption. Similarly, the average technical efficiency of beekeeping farms in Malaysia, calculated by the stochastic production frontier method, was 62.5% on average (Habibullah and Ismail, 1994), which was approximately equal to the efficiency score for the CRS analysis in the present study. A study conducted in Nigeria calculated the effectiveness of beekeeping farms for two different beekeeping farms types by the stochastic production frontier method and found an average efficiency of beekeeping enterprises of 59% for the traditional type of beekeeping farms and 84% for the modern types (Oladimeji et al., 2016). Another study conducted in Nigeria reported an average efficiency score of 81% with the stochastic production frontier method (Akinmulewo et al., 2017). The average efficiency score was 53% in a study on the technical efficiency of beekeeping in Egypt (Alrophy et al., 2019). In Turkey, some studies that have measured the efficiency of beekeeping farms in Canakkale have reported a technical efficiency ratio of 64% for CRS and 89% for VRS (Aydın et al., 2020). The technical efficiency scores for the Çanakkale area were therefore higher than those found for the Gümüşhane region in the present study, but the difference was not large. A study in the Nigde province in Turkey on the technical efficiency of beekeeping reported an average technical efficiency of beekeeping farms of 57%, which was lower than the value found in the present study (Gürer and Akyol, 2018), at 59% for CRS and 75–79% for VRS.
A correlation analysis was also conducted to reveal the relationship between the effectiveness of beekeeping farms and various socioeconomic factors. Age, education, household size, beekeeping experience, non-beekeeping income, number of hives and beekeeping type (fixed/migratory) were the socioeconomic factors. Examination of the relationship between output-oriented efficiency scores and the socio-economic factors according to VRS identified only a relationship between the beekeeping experience and the effectiveness of the farms. A weak and positive (r = 0.259, p = 0.046) relationship was found between the effectiveness of the beekeeping farms and beekeeping experience (Table VII).
This result reveals that increases in beekeeping experience increase the efficiency of beekeeping farms. A similar study (Makri et al., 2015) also reported a close relationship between efficiency and experience. When the relationship was analysed in terms of input-oriented factors, like the efficiency scores and the socio-economic factors in the assumption of VRS, only a relationship between the beekeeping type and the efficiency of beekeeping farms was detected. According to the analysis result; a weak and negative (r = -0.320, p = 0.013) relationship was found between the effectiveness of beekeeping farms and beekeeping type (Table VII) (Beekeeping type was defined as a dummy variable in the correlation analysis). In this context, fixed beekeepers were accepted as 0 and those who conducted migratory beekeeping were accepted as 1. The analysis outcome showed that the efficiency of the farms decreased with the increase in migratory beekeeping. This result, in a sense, means that the migratory beekeepers achieve their current output using more input. Overall, 58.3% of the beekeepers included in this research were migratory beekeepers and the rest were fixed beekeepers.
When calculating labour costs of migratory beekeepers, both temporary and family labour costs were taken into account. The present survey revealed that fixed beekeepers did not have temporary labour costs; therefore, only family labour costs were addressed for fixed beekeepers. The labour cost, which constituted 38.47% of the variable costs, was understood as the most important input that increased the total costs for the migratory beekeepers. In addition, fixed beekeepers did not have transportation costs to carry their hives.
The second largest input cost after the labour cost was the feed cost. During the production period, the average feed cost per hive for the migratory beekeepers was US$24.27. This value was above the average feed cost (US$21.65) that all the beekeepers expended per hive. For this reason, the migratory beekeepers were viewed as using more inputs to increase their production capacity in order to decrease their total costs. This emerged as a reason for the reduced efficiency of the migratory beekeepers.
Table VII.- Results of bivariate correlation analysis between the effectiveness of beekeeping enterprises and socio-economic factors.
|
Age |
Education |
Household size |
Beekeeping experience |
Non-beekeeping income |
No. of hives |
Types of beekeeping |
||
|
Output-oriented VRS |
Pearson Correlation |
,154 |
,065 |
-,056 |
,259* |
,136 |
,099 |
-,143 |
|
Sig. (2-tailed) |
,239 |
,621 |
,673 |
,046 |
,302 |
,453 |
,275 |
|
|
Input-oriented VRS |
Pearson Correlation |
,032 |
-,068 |
-,036 |
,042 |
,136 |
-,153 |
-,320* |
|
Sig. (2-tailed) |
,809 |
,608 |
,784 |
,752 |
,300 |
,242 |
,013 |
|
*Correlation is significant at the 0.05 level (2-tailed).
Table VIII.- Total improvements ratios for the interviewed beekeeping farms.
|
Varibles |
CRS (output-oriented) |
CRS (input-oriented) |
VRS (output-oriented) |
VRS (input-oriented) |
|
Ouput |
||||
|
Gross product value |
72,80 |
0,00 |
70,51 |
14,98 |
|
Inputs |
||||
|
No. of bee hives |
-2,20 |
-17,56 |
-3,57 |
-14,42 |
|
Feed costs |
-10,35 |
-24,37 |
-7,98 |
-19,45 |
|
Medication costs |
-4,17 |
-18,35 |
-6,38 |
-16,84 |
|
Labour costs |
-4,34 |
-19,47 |
-4,96 |
-16,34 |
|
Other variable costs |
-6,15 |
-20,26 |
-6,60 |
-17,97 |
Table IX.- Distribution of the beekeeping farms by ınput/output potential improvement rates in output-oriented VRS model (number of beekeeping farms).
|
Improve-ment rates (%) |
Gross product value |
No. of bee hives |
Feed costs |
Medi-cation costs |
Labour costs |
Other variable costs |
|
0-10 |
30 |
44 |
40 |
47 |
46 |
41 |
|
11-20 |
4 |
5 |
3 |
1 |
2 |
3 |
|
21-30 |
1 |
6 |
2 |
1 |
2 |
2 |
|
31-40 |
4 |
2 |
3 |
2 |
4 |
5 |
|
41-50 |
1 |
3 |
3 |
0 |
1 |
3 |
|
51-60 |
3 |
0 |
1 |
2 |
3 |
3 |
|
61-70 |
0 |
0 |
5 |
1 |
0 |
2 |
|
71-80 |
1 |
0 |
2 |
3 |
2 |
1 |
|
81-90 |
1 |
0 |
1 |
1 |
0 |
0 |
|
91-100 |
2 |
0 |
0 |
2 |
0 |
0 |
The beekeeping farms in the research area could have better levels for their costs for honey production, as indicated by the production values obtained by both CRS and VRS models, and potential improvement values were found (Table VIII). As shown in Table VIII, improvement suggestions for outputs and inputs were in the direction of reduction for all the variables except production value. In particular, greater reductions were needed in the feed costs than in the other inputs. The gross production value needed an increase of 70.51% to ensure the full efficiency of the analysed beekeeping farms in terms of the output-oriented VRS assumption. Further recommendations were that the number of hives should be reduced by 3.57%, feed costs by 7.98%, medication costs by 6.38%, labour costs by 4.96% and other variable costs by 6.60% to ensure full efficiency of the beekeeping farms. The assumption of input-oriented VRS indicated that the gross production value should be increased by 14.98% to ensure its full effectiveness. Furthermore, the number of hives should be reduced by 14.42%, feed costs by 19.45%, medication costs by 16.87%, labour costs by 16.34% and other variable costs by 17.97% for full efficiency.
The distribution of the beekeeping farms that could become fully effective with improvement in the output and inputs is given in Table IX for the output-oriented VRS analysis. A significant portion of the beekeeping farms could be fully effective with a potential improvement of 10% both in gross production value and number of hives and variable costs (Fig. 1). In the radar chart, a significant portion of the enterprises were concentrated in the potential improvement segment between 0 and 10. There were no enterprises suggested for improvement in the classes with high efficiency levels.
The input-oriented VRS analysis showed the distribution of the beekeeping farms that could become fully effective with improvement in the output and inputs (Table X). This distribution required a 10% potential improvement in the output value to become fully efficient for almost all enterprises. In addition, almost half of the beekeeping farms needed a 10% potential improvement in the number of hives and variable costs for full efficiency. The remaining half of the enterprises was recommended to make potential improvements in the number of hives and the variable costs at rates higher than 10% (Fig. 2). Other enterprises also offered improvement in classes with high efficiency levels. These enterprises needed to make potential improvements at high rates, especially in terms of feed costs and other variable costs.
Table X.- Distribution of the beekeeping farms by input/output potential improvement rates in input-oriented VRS model (number of beekeeping farms).
|
Improve-ment rates (%) |
Gross product value |
No. of bee hives |
Feed costs |
Medi-cation costs |
Labour costs |
Other variable costs |
|
0-10 |
57 |
27 |
27 |
30 |
31 |
30 |
|
11-20 |
0 |
5 |
1 |
1 |
1 |
1 |
|
21-30 |
1 |
3 |
3 |
3 |
0 |
1 |
|
31-40 |
0 |
6 |
5 |
4 |
5 |
4 |
|
41-50 |
0 |
5 |
3 |
3 |
7 |
3 |
|
51-60 |
1 |
5 |
1 |
5 |
2 |
3 |
|
61-70 |
0 |
5 |
5 |
5 |
5 |
6 |
|
71-80 |
0 |
3 |
8 |
3 |
5 |
6 |
|
81-90 |
0 |
1 |
5 |
4 |
3 |
4 |
|
91-100 |
0 |
0 |
2 |
2 |
1 |
2 |
Conclusions
The results of this study revealed the importance of evaluating the economic performance of beekeeping farms from different perspectives. In fact, according to the relative profitability analysis, the beekeeping farms had a very good view. The relative profitability value of the beekeeping farms was determined as US$2.14. This showed that the price of honey obtained by the producers overcame the cost. According to the technical efficiency analysis, the efficiency of the enterprises can be considered as high. According to the VRS analysis for output and input-oriented, the average efficiency was determined as 75.42% and 78.95%, respectively.
However, more than 50% of the beekeeping farms are not working at full efficiency level. Both the output and input-oriented VRS analysis revealed that a significant part of the beekeeping farms could approach full effectiveness with a potential improvement of at least 10% in gross production value, number of hives and variable costs. Improvement suggestions for outputs and inputs were in the direction of reduction for all variables except the gross production value. In particular, the costs of feed need to be reduced more than other input ratios.
The output- and input-oriented VRS analysis revealed a positive correlation between the effectiveness of the enterprises and beekeeping experience. In addition, the efficiency of the enterprises decreased with the increase in the migratory beekeepers. This, in a sense, means that the migratory beekeepers achieve their current output using more input. For this reason, the efficiency of beekeeping farms was closely related to the beekeepers’ production experience. Therefore, using agricultural extension studies is important for overcoming the lack of experience by the beekeepers. Agricultural extension studies can transfer marketing information to beekeepers, as well as technical information, to ensure both input- and output-oriented efficiency. Another important finding in this study is that the effectiveness of migratory beekeepers is less than that of fixed beekeepers. In other words, the migratory beekeepers perform poorly in terms of the efficiency of their input. They have more feed expenses than the fixed beekeepers, as well as transporting hives and hiring foreign labour, and this causes the migratory beekeepers to obtain their current honey production at a higher cost. In this context, migratory beekeepers need to better manage their resource utilisation, perhaps through consultancy services, both in private and public.
Beekeeping is one of the most recommended production areas for local people in rural development studies. Many people also demand this branch of production. However, beekeeping should not be seen as a production activity that involves only a few hives. Beekeepers need to use their resources more effectively. The findings in this study show that although the relative profitability of the enterprises has been high, the beekeepers are not fully utilising their resources. For this reason, strategies should be developed to establish farms that can work effectively in an output- and input-oriented fashion in rural development activities.
Acknowledgment
We are grateful for Aydin Dogan Foundation for the payment of the essay.
Statement of conflict of interest
The authors have declared no conflict of interests.
References
Adanacıoğlu, H., Kosoğlu, M., Saner, G., Topal, E. and Yücel, B., 2019. Economic feasibility of package beekeeping application in Turkey: A case study of Edirne province. Kafkas Univ. Vet. Fakul. Derg., 25: 651-658.
Alropy, E.T., Desouki, N.E. and Alnafissa, M.A., 2019. Economics of technical efficiency in White honey production: Using stochastic frontier production function. Saudi J. biol. Sci., 26: 1478-1484. https://doi.org/10.1016/j.sjbs.2019.09.029
Al-Ghamdi, A.A., Adgaba, N., Herab, A.H. and Ansari, M.J., 2017. Comparative analysis of profitability of honey production using traditional and box hives. Saudi J. biol. Sci., 24: 1075-1080. https://doi.org/10.1016/j.sjbs.2017.01.007
Akkaya, H. and Alkan, S., 2007. Beekeeping in Anatolia from the Hittites to the present day. J. Apic. Res., 46: 120-124. https://doi.org/10.1080/00218839.2007.11101378
Akinmulewo, B.O., Oladimeji, Y.U. and Damisa, M.A., 2017. Assessment of technical efficiency of improved apiculture on poverty status of bee farmers in Abuja, Nigeria. Ethiopian J. environ. Stud. Manage., 10: 781-794.
Anonymous, 2018. Beekeeping enterprises in gümüşhane. Gümüşhane Directorate of Provincial Agriculture and Forestry, Turkey. Available at: https://gumushane.tarimorman.gov.tr/# (accessed on 05 December, 2019).
Aydın, B., Aktürk, D. and Arsoy, D., 2020. Economic and efficiency analysis of beekeeping activity in Turkey: Case of Çanakkale Province. Ankara Üniv. Vet. Fakul. Derg., 67: 23-32. https://doi.org/10.33988/auvfd.571371
Breeze, T.D., Dean, R. and Potts, S.G., 2017. The costs of beekeeping for pollination services in the UK- An explorative study. J. Apic. Res., 56: 310-317. https://doi.org/10.1080/00218839.2017.1304518
Beula, K. and Anandhy, A., 2020. Impact of determining the relationship between on Influencing income obtained beekeeping for economic analysis in Vilavancode Valuk in Kanniyakumari District. Stud. Indian Place Names (UGC Care J.), 40: 727-734.
BÜMKO, 2018. Average exchange rates. Ministry of Treasury and Finance of The Republic of Turkey. http://www.bumko.gov.tr/TR,147/ekonomik-gostergeler.html (Accessed June 10, 2020).
Ceyhan, V. and Canan, S., 2017. Economic performance of beekeepers under different colony management system in Turkey. Turkish J. Agric. Nat. Sci., 4: 516-522.
Coelli, T., Rao, D.S.P. and Battese, G.E., 1998. An introduction to efficiency and productivity analysis. Kluwer Academic Publishers, USA, pp. 275.
Coelli, T., Rao, D.S.P. and Battese, G.E., 2002. An introduction to efficiency and productivity analysis. Kluwer Academic Publishers, Sixth Printing, USA, pp. 275. https://doi.org/10.1007/978-1-4615-5493-6
Colla, S.R. and MacIvor, S.J., 2018. Questioning public perception, conservation policy, and recovery actions for honeybees in North America. Conserv. Biol., 31: 1202-1204. https://doi.org/10.1111/cobi.12839
Çevrimli, M.B. and Sakarya, E., 2018. Structural characteristics and problems of beekeeping enterprises in Aegean Region. Eurasian J. Vet. Sci., 34: 83-91.
Çevrimli, M.B. and Sakarya, E., 2019. Economic analysis of beekeeping enterprises in Aegean Region, Turkey. Ankara Üniv. Vet. Fakul. Derg., 66: 109-115. https://doi.org/10.33988/auvfd.547464
Demen, H., Karacaoğlu, M. and Koç, A., 2015. Beekeeping structure and problems in Diyarbakir province. http://dergi.adu.edu.tr//tralleis (accessed October 10, 2018).
Doğan, N., Adanacioğlu, H., Saner, G. and Takma, Ç., 2020. Socio-economic determinants on the profitability of beekeeping enterprises in Turkey: A case study in Kelkit district of Gumushane. Mellifera, 20: 28-40.
Farrel, M.J., 1957. The measurement of productive efficiency. J. R. Statist. Soc. Ser. A, 120: 253-290. https://doi.org/10.2307/2343100
FAOSTAT, 2019. Live animals data. Available at: http://www.fao.org/faostat/en/?#data/QA (accessed 4 Apr. 2021).
Ghamdi, A., Adgaba, N., Herab, A. and Ansari, M., 2017. Comparative analysis of profitability of honey production using traditional and box hives. Saudi J. biol. Sci., 24: 1075-1080. https://doi.org/10.1016/j.sjbs.2017.01.007
Gratzer, K., Susilo, F., Purnomo, D., Fiedler, S. and Brodschneider, R., 2019. Challenges for beekeeping in Indonesia with autochthonous and introduced bees. Bee World, 96: 41-44. https://doi.org/10.1080/0005772X.2019.1571211
Gürer, B. and Akyol, E., 2018. An empirical analysis of technical efficiency determinants in beekeeping farms: Evidence and policy implications from Nigde, Province, Turkey. J. Agric. Environ. Intern. Develop., 112: 343-359.
Habibullah, M.S. and Ismail, M.M., 1994. Production frontier and technical efficiency: The case for beekeeping farms in Malaysia. Bangladesh J. Agric. Econ., 1-2: 31-43.
Kohsaka, R., Park, M.S. and Uchiyama, Y., 2017. Beekeeping and honey production in Japan and South Korea: Past and present. J. Ethnic Foods, 4: 72-79. https://doi.org/10.1016/j.jef.2017.05.002
Kinati, C., Tolemariam, T. and Debele, K., 2013. Assessment of honey production and marketing system in Gomma District, South Western Ethiopia. Greener J. Busin. Manage. Stud., 3: 99-107. https://doi.org/10.15580/GJBMS.2013.3.09071257
Makri, P., Papanagiotou, P. and Papanagiotou, E., 2015. Efficiency and economic analysis of Greek beekeeping farms. Bulg. J. agric. Sci., 21: 479-484
Mbah, S.O., 2012. Profitability of honey production enterprise in Umuahia Agriculture Zone of Abia State Nigeria. J. Agric. Rural Develop., 15: 1268-1274.
Merdan, K., 2017. The economic and social dimensions of apiculture in Gümüşhane province. J. Gümüşhane Univ. Soc. Sci., 8: 184-202. https://doi.org/10.17823/gusb.2497
Musinguzi, P., Skovmand-Bosselmann, A. and Pouliot, M., 2018. Livelihoods-conservation initiatives: Evidence of socio-economic impacts from organic honey production in Mwingi, Eastern Kenya. Forest Policy Econ., 97: 132-145. https://doi.org/10.1016/j.forpol.2018.09.010
Newbold P., 1995. Statistics for business and economics. Prentice Hall Int., Upper Saddle River, New Jersey, USA, pp. 867.
Oladimeji, Y.U., Ajao, A.M., Abdulrahman, S., Suleiman, R. and Bolaji, A.M., 2016. Estimation of efficiency differentials in honey bee enterprises: Implications for higher productivity in Kebbi and Kwara States of Nigeria. Gashua J. Irrig. Desert Stud., 2: 38-49.
Onuç, Z., Yanar, A., Saner, G. and Güler, D., 2018. An analysis on economical aspect of the beekeeping enterprise: A case of Kemalpasa District-Izmir/Turkey. Ege Univ. Agric. Facul. J., 56: 7-14.
Özbakır, G., Doğan, Z. and Öztokmak, A., 2016. Examination of beekeeping activities in Adıyaman Province. Harran Agric. Fd. Sci. J., 20: 119-126. https://doi.org/10.29050/harranziraat.259102
Potts, S.G., Roberts, S.P.M., Dean, R., Marris, G., Brown, A.M., Jones, R., Neumann, P. and Settele, J., 2010. Declines of managed honey bees and beekeepers in Europe. J. Apic. Res., 49: 15-22. https://doi.org/10.3896/IBRA.1.49.1.02
Rakipova, A. and Gillespie, J., 2000. Technical efficiency of beef cattle producers in Louisiana. Louisiana Rural Econ., 62: 99-107.
Rasa, B., 2019. Profitability analysis and adoption of improved box hive technology by small holder beekeepers: The case of Blue Hora Woreda, West Guji Zone of Oromia Regional State, Ethiopia. Int. J. Horticul. Agric. Fd. Sci., 3: 346-357. https://doi.org/10.22161/ijhaf.3.61.5
Ricalde, F.J., Villanueva, R., Gonzalez, C. and Alvarez, G., 2006. Production costs of conventional and organic honey in the Yucatan Peninsula of Mexico. J. Apic. Res., 45: 106-111. https://doi.org/10.1080/00218839.2006.11101327
Sari, F., Kandemir, İ., Ceylan, D.A. and Gül, A., 2020. Using AHP and Promethee multi-criteria decision making methods to define suitable apiary locations. J. Apic. Res., 59: 546-557. https://doi.org/10.1080/00218839.2020.1718341
Sezgin, A. and Kara, M.A., 2011. Research on determining the factors effecting yield increase in beekeeping: The example of TRA2 region. J. Agric. Facul., 15: 31-38.
Thomas, K.A. and Tounkara, S.Y., 2020. Apiculture and poverty reduction Nexus: Evidence from rural households in Sikasso Region of Mali. Bee World, 97: 10-15. https://doi.org/10.1080/0005772X.2019.1692416
Tijani, B.A., Ala, A.L., Maikasuwa, M.A. and Ganawa, N., 2011. Economic analysis of beekeeping in Chibok Local Government area of Borno State Nigeria. Nigerian J. Basic appl. Sci., 19: 285-292.
Yadeta, G.L., 2019. Assessment of potential and constraints of honey production in Godere district, Southwest Ethiopia. Am. J. Life Sci., 7: 120-127. https://doi.org/10.11648/j.ajls.20190706.14
Yildirim, İ. and Ağar, S., 2008. The influence of scale on the profitability of honey beekeeping enterprises in eastern part of Turkey. Asian J. Anim. Vet. Adv., 3: 314-320. https://doi.org/10.3923/ajava.2008.314.320
To share on other social networks, click on any share button. What are these?


