

Purification and Characterization of an Acidic Polygalacturonase from Grapes and its Potential to Improve Juice Quality


Purification and Characterization of an Acidic Polygalacturonase from Grapes and its Potential to Improve Juice Quality
Zahra Nazir1, Saba Ijaz1, Roquyya Gul2 and Mahjabeen Saleem1,*

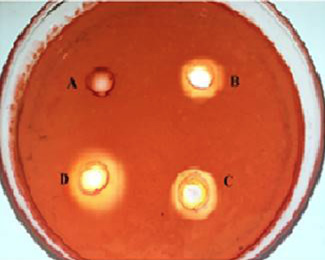
Holes around the wells in a PGA-agar plate. Wells were loaded with different amounts of polygalacturonase and incubated at 40°C for 24 h. The plate was stained with 0.02% Congo red and then destained with 1M NaCl. A, Control; B, 0.1U of polygalacturonase; C, 0.2U of polygalacturonase; D, 0.3U of polygalacturonase.
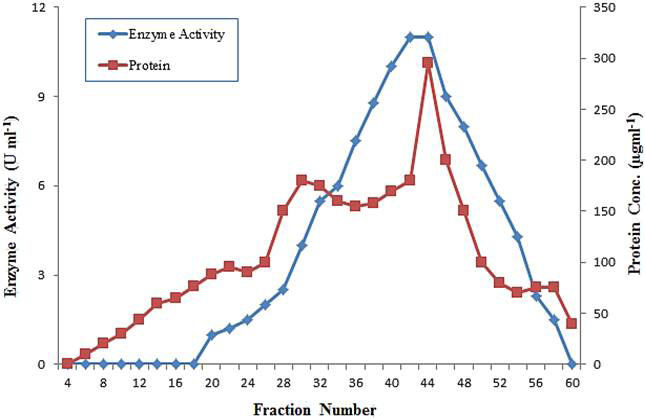
Gel filtration through chromatography on Sephadex G-75 column of polygalacturonase from grapes.
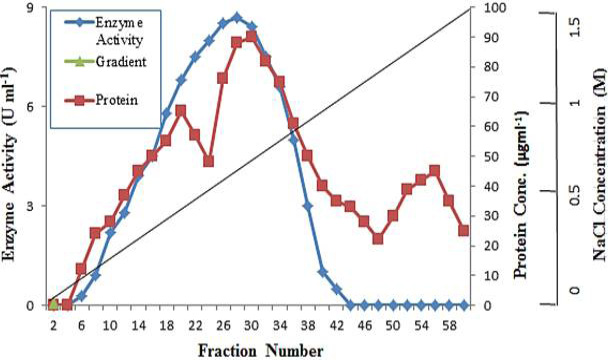
Q-Sepharose chromatography of polygalacturonase after concentration by ultrafiltration.
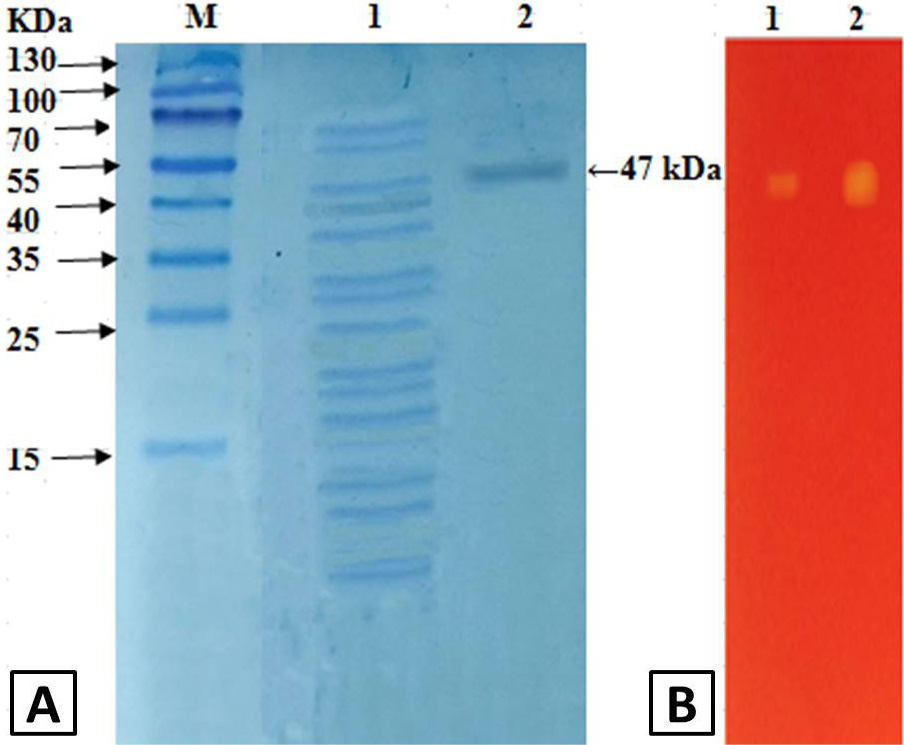
A, SDS-PAGE analysis of polygalacturonase from grapes: Lane M, marker; Lane 1, crude enzyme; Lane 2, after Q-sepharose chromatography. B, zymography analysis of purified polygalacturonase from grapes: Lane 1, 0.5 U; Lane 2, 1.5 U.
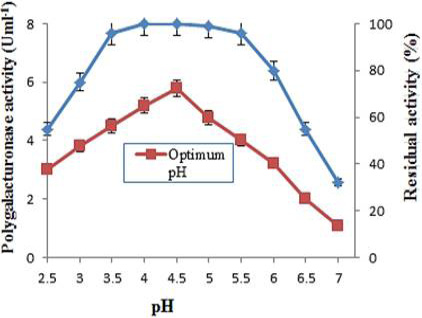
Optimum pH and pH stability of purified polygalacturonase from grapes. The effect of pH on enzyme activity was determined at 40°C using 0.05M of various buffers. For pH stability, the enzyme was diluted with buffers of pH range (2.5-7.0) and incubated at room temperature for 1 h and determined the residual activity at 40°C. The data is representative of mean of three experiments.
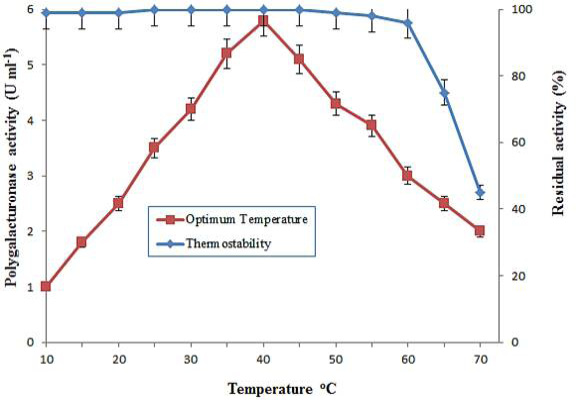
Optimum temperature and thermal stability of purified polygalacturonase from grapes. The optimal temperature was determined at different temperatures by incubating known amount of enzyme activity with 1% PGA. Temperature stability was obtained by preincubating enzyme at various temperatures ranging from 10-70°C for 1 h. The data is representative of mean of three experiments.

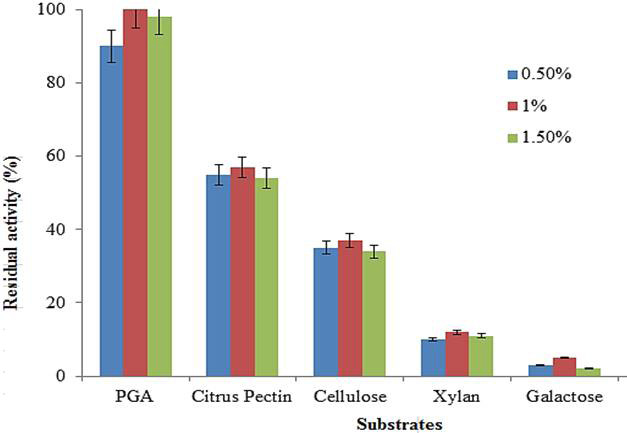
Effect of different substrates on purified polygalacturonase activity. Data are presented as mean of three experiments.
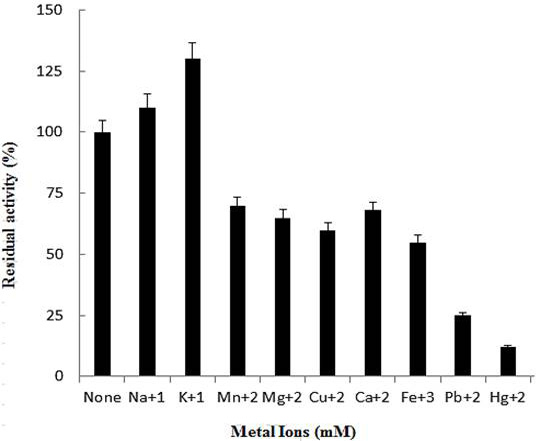
Effect of metal ions on activity of purified polygalacturonase. The data is illustrative of mean of triplicate experiments.

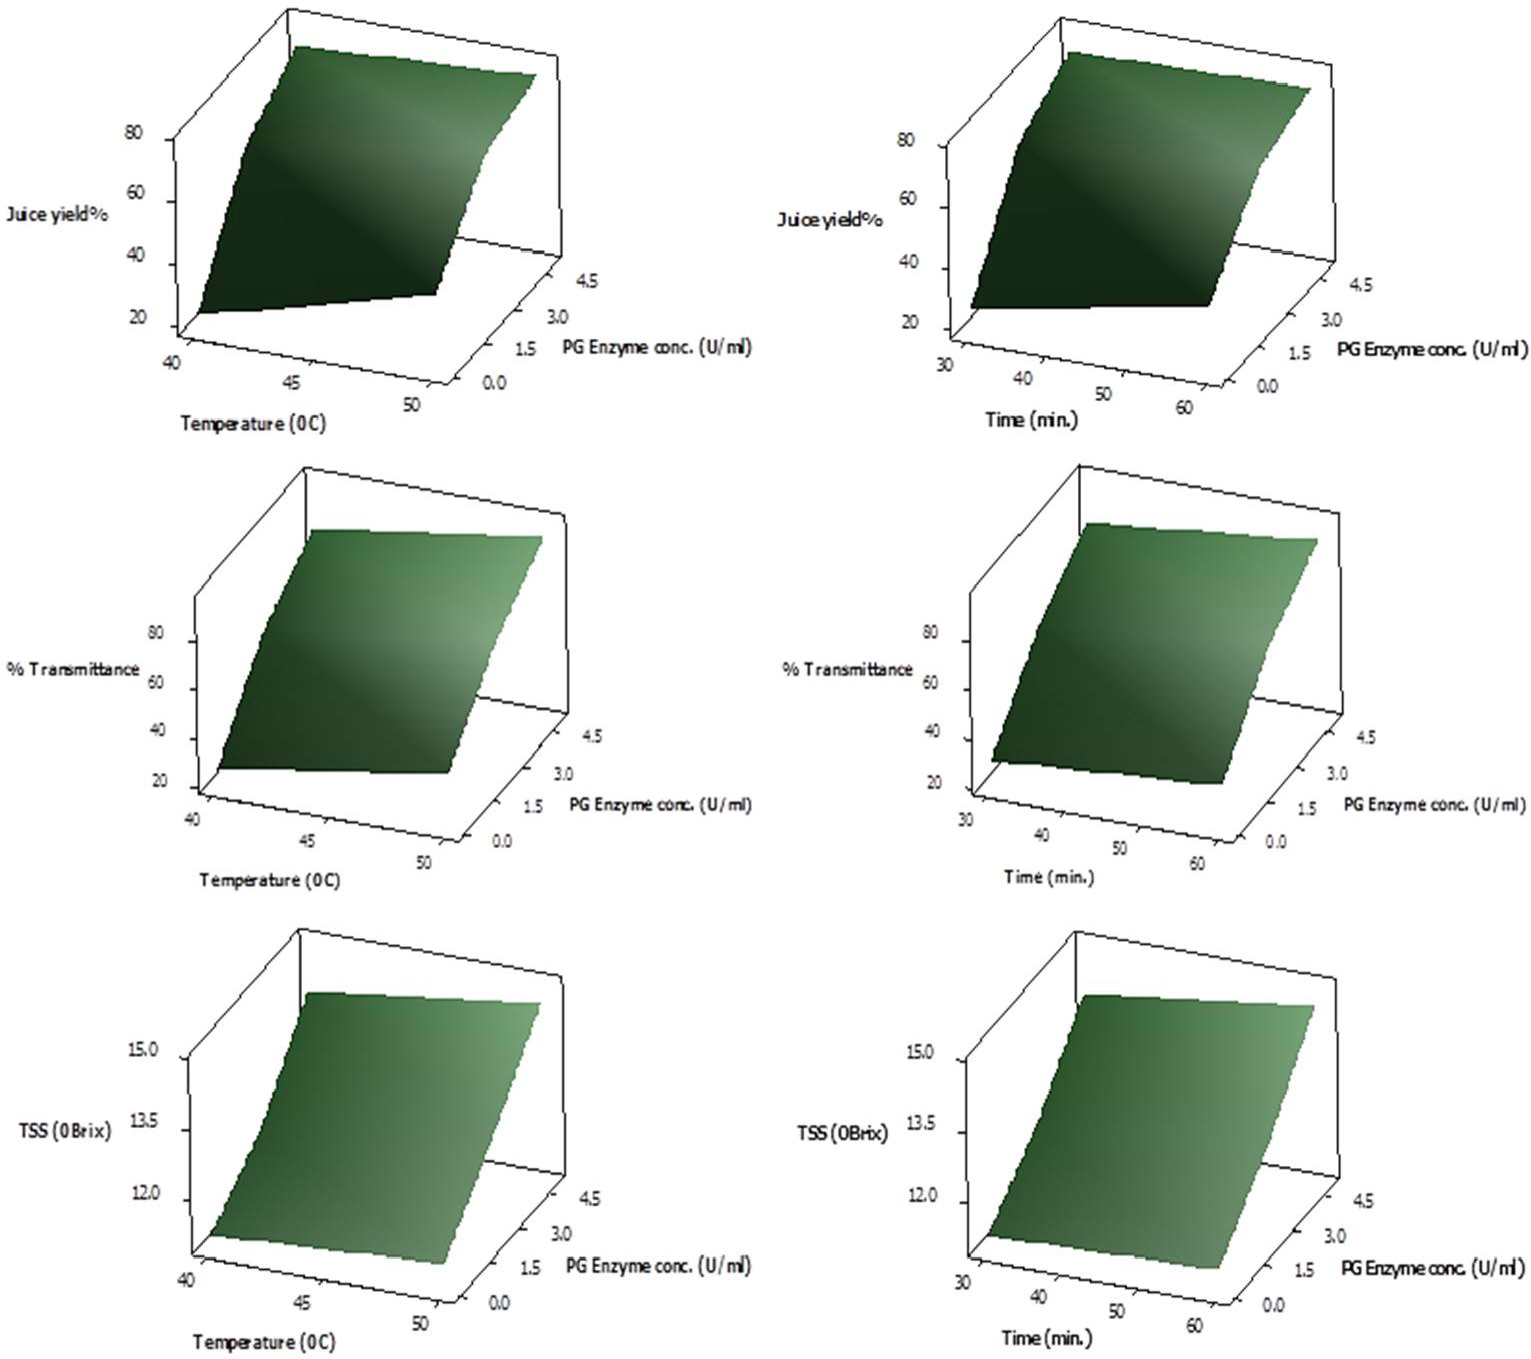
Response Surface plots showing interactive effect of temperature (left panel) and time (right panel) on % yield, % transmittance and total soluble solid content (°Brix) of juice employing various PG enzyme concentrations.
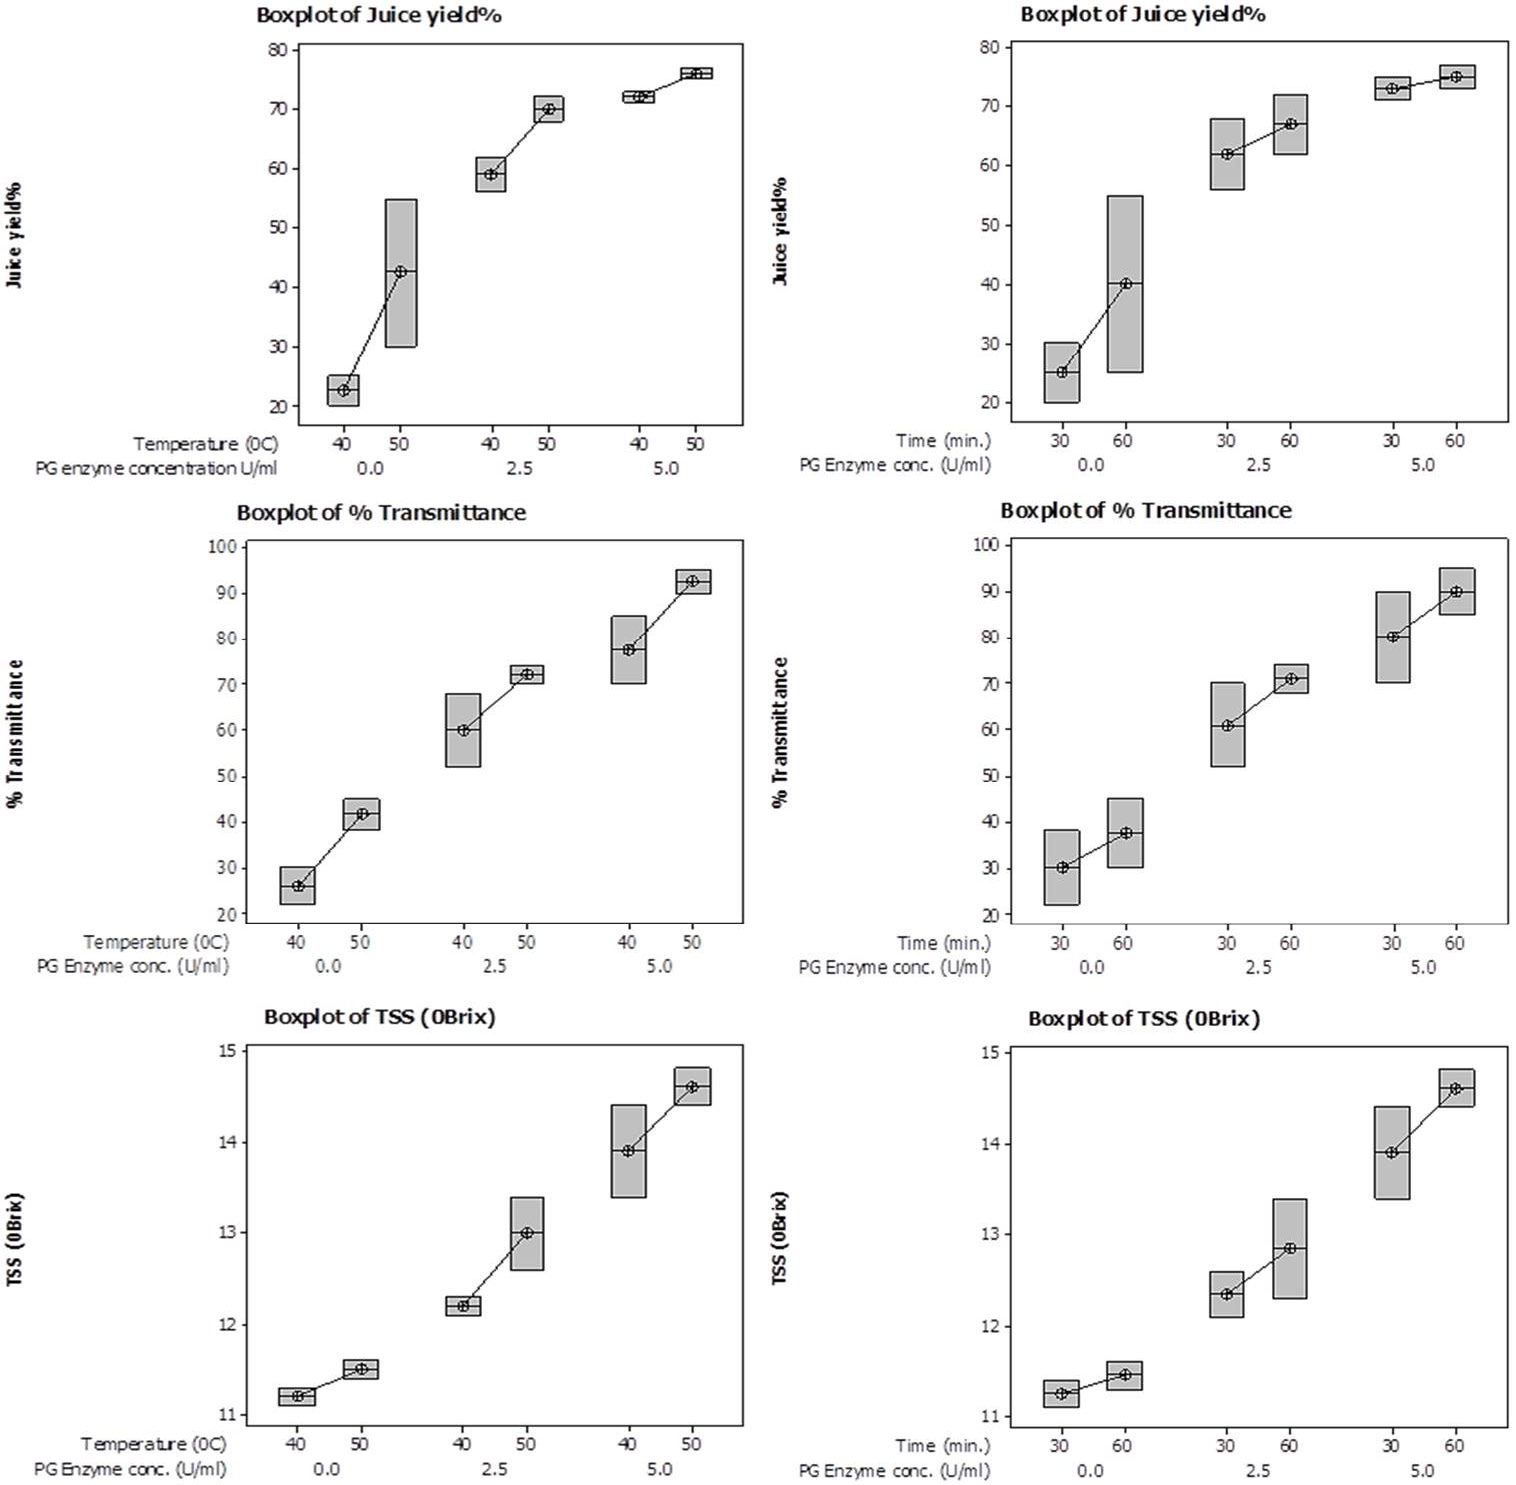
Box plots showing interactive effect of temperature (left panel) and time (right panel) on % yield, % transmittance and total soluble solid content (°Brix) of juice employing various PG enzyme concentrations.
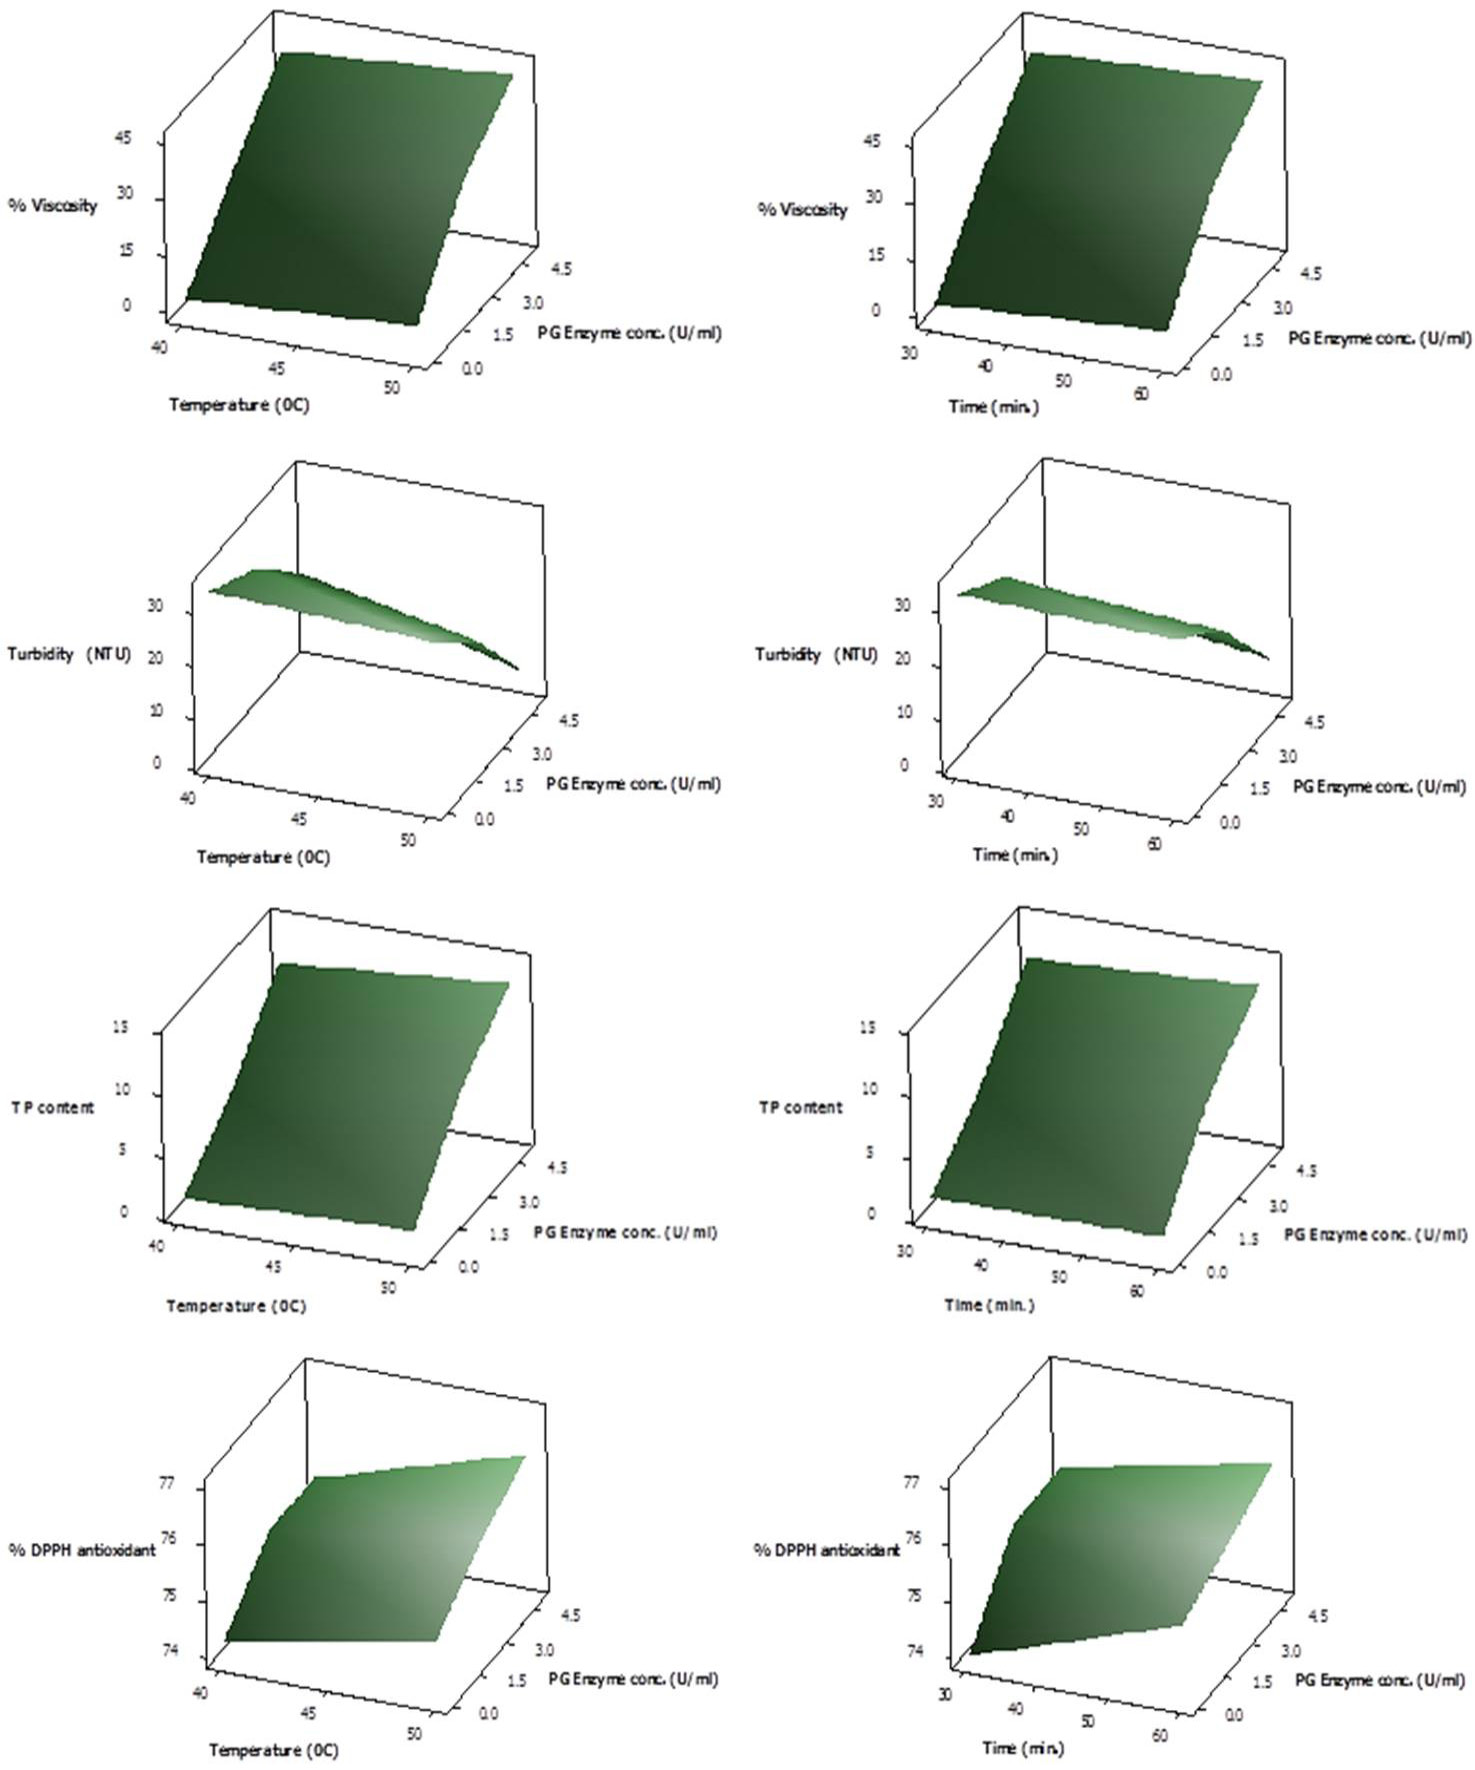
Response Surface plots showing interactive effect of temperature (left panel) and time (right panel) on % viscosity reduction, turbidity, total phenolic content and % DPPH antioxidant activity of juice employing various PG enzyme concentrations.

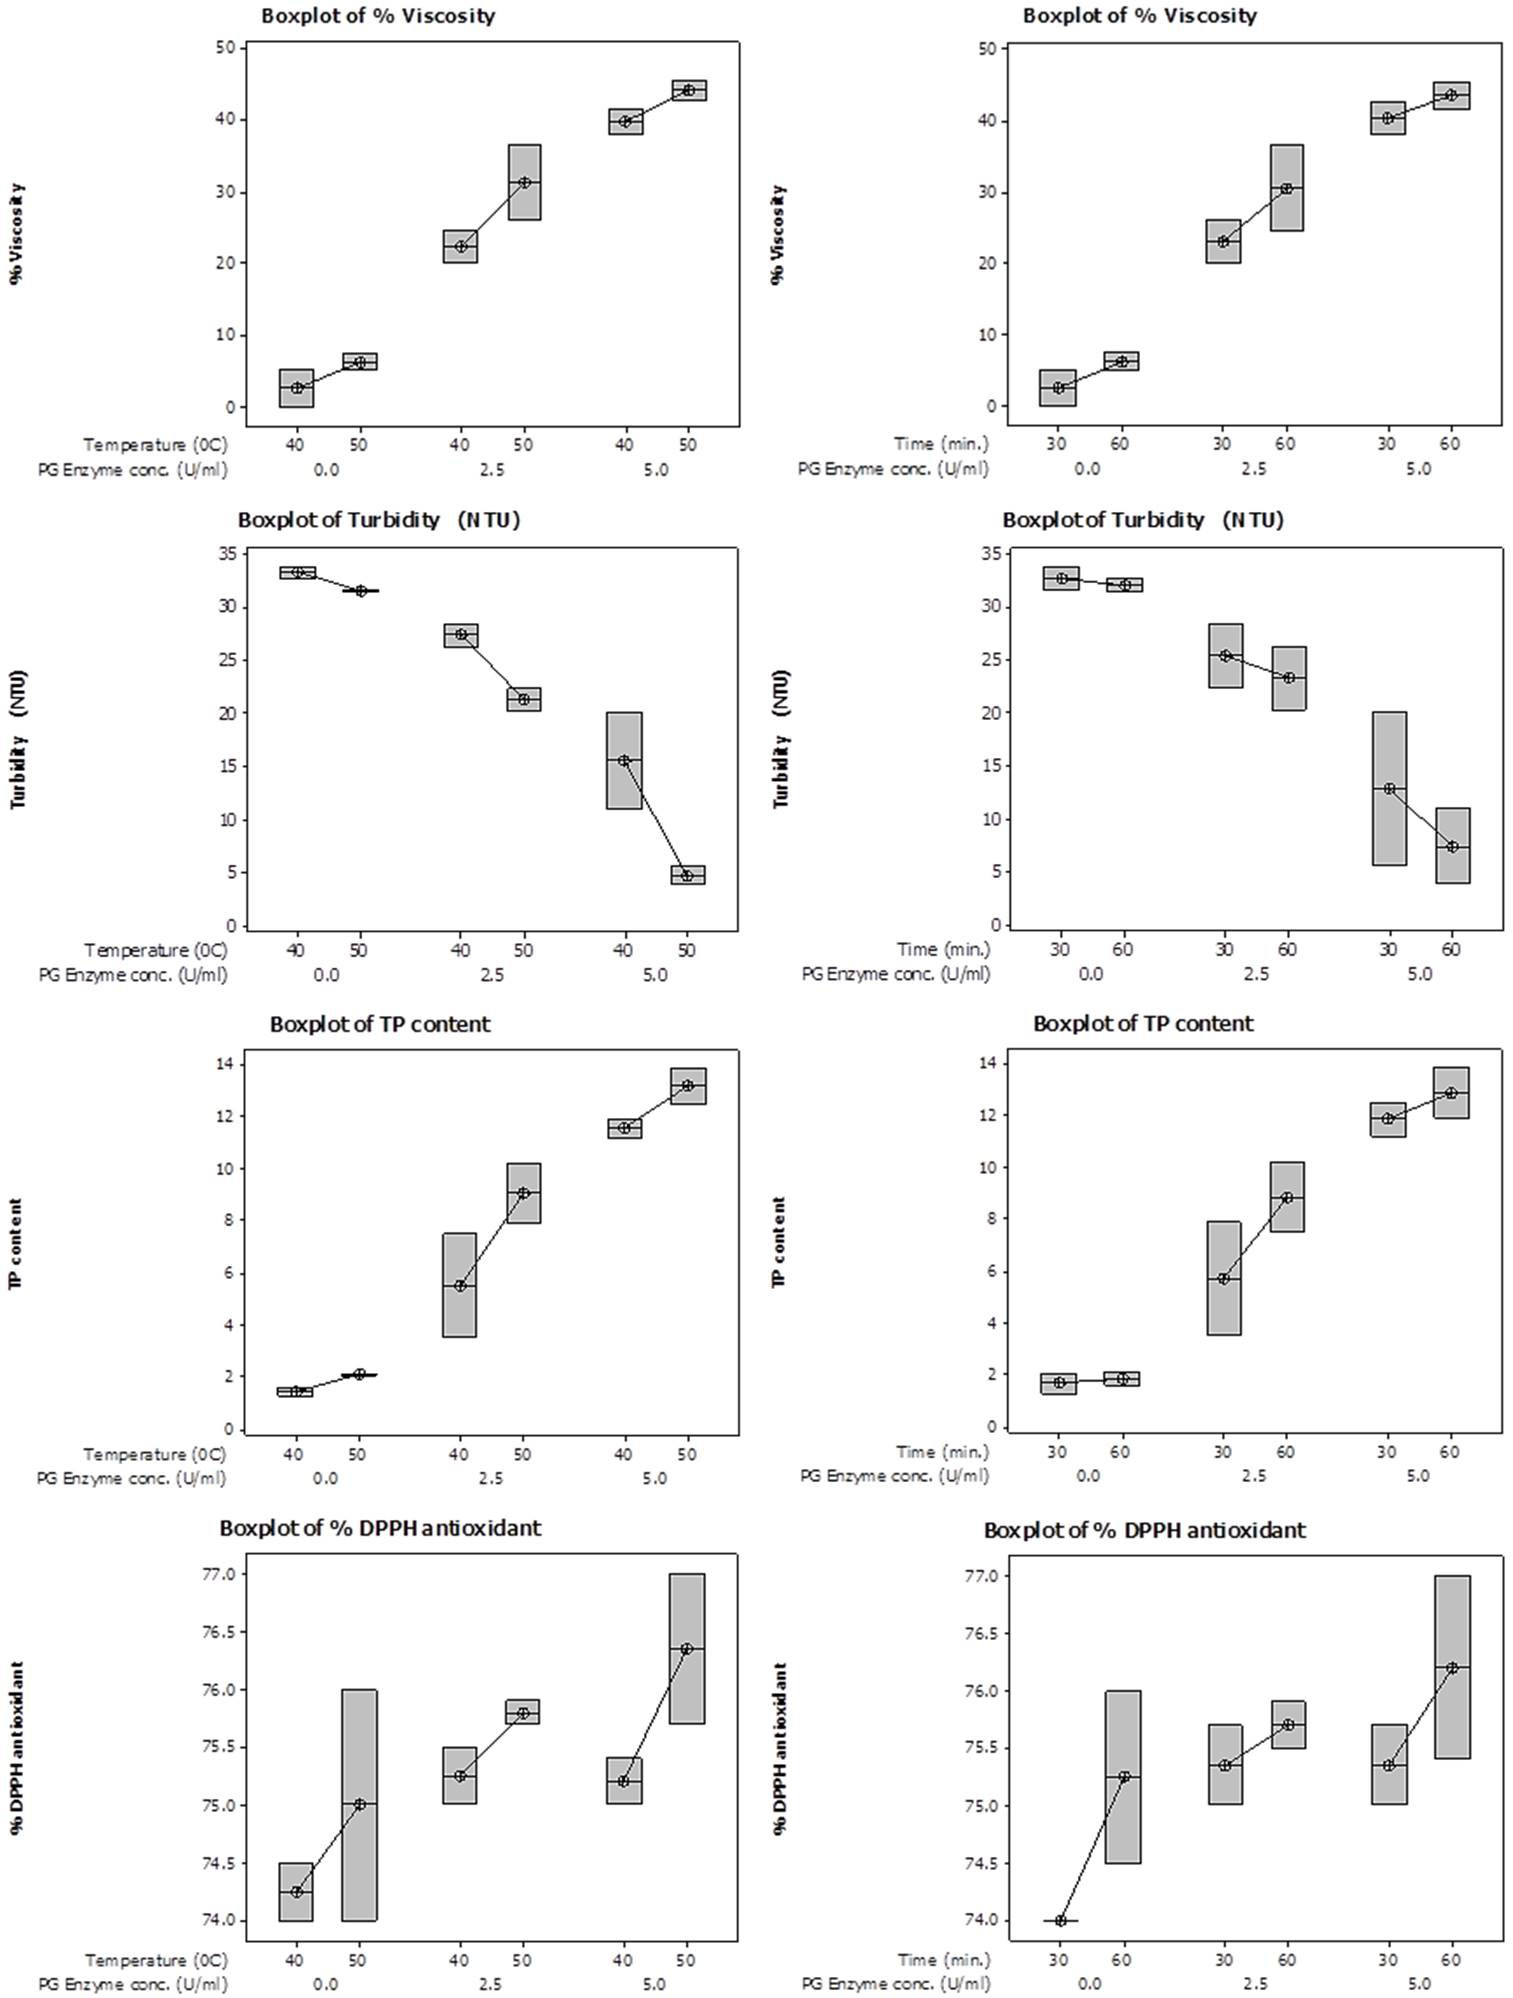
Box Surface plots showing interactive effect of temperature (left panel) and time (right panel) on % viscosity reduction, turbidity, total phenolic content and % DPPH antioxidant activity content of juice employing various PG enzyme concentrations.


