

Rab21, an Endocytic Rab GTPase, is Involved in Drug Resistance in Prostate Cancer Cells


Rab21, an Endocytic Rab GTPase, is Involved in Drug Resistance in Prostate Cancer Cells
Maryam Yousaf1, Naveed Shahzad2, Zeeshan Mutahir1 and Moazzam Ali1*

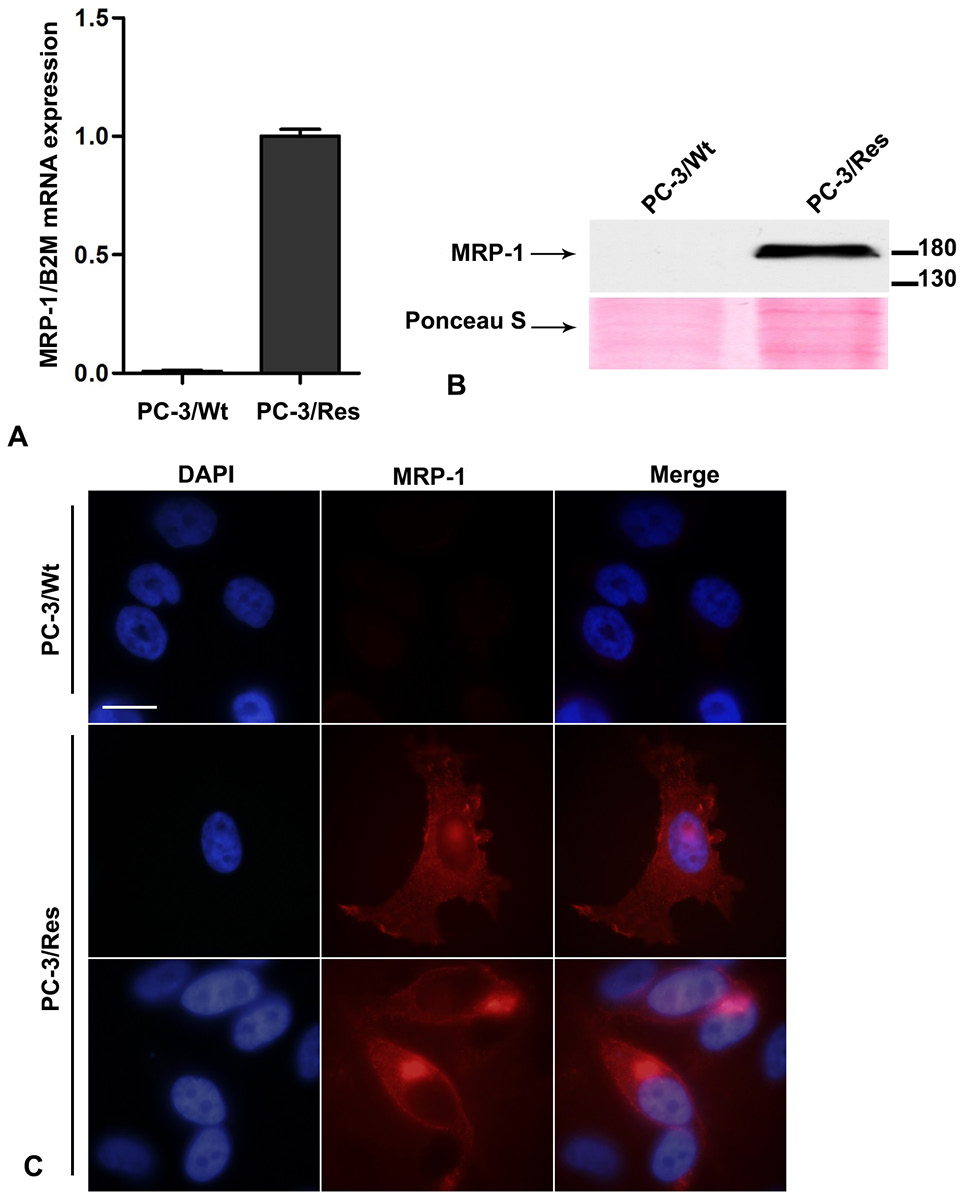
Expression and localisation of MRP-1 in prostate cancer cells. (A) The mRNA levels of ABCC1 in PC-3/Wt and PC-3/Res cells were obtained by real time RT-PCR and normalised to beta 2 microglobulin (B2M) expression (B) ABCC1 protein expression was analysed by Western blot using anti-MRP-1 antibody. Ponceau S staining is shown as loading control (C) Immunofluorescence analysis of ABCC1 protein in PC-3/Wt (upper panel) and PC-3/Res cells (lower panels). Cells were fixed and immunolabelled for ABCC1 (red) using anti-MRP-1 antibody. Merged images, including nuclei (stained with DAPI), were assembled using Adobe Photoshop CS6 Software. Bar, 20µm.

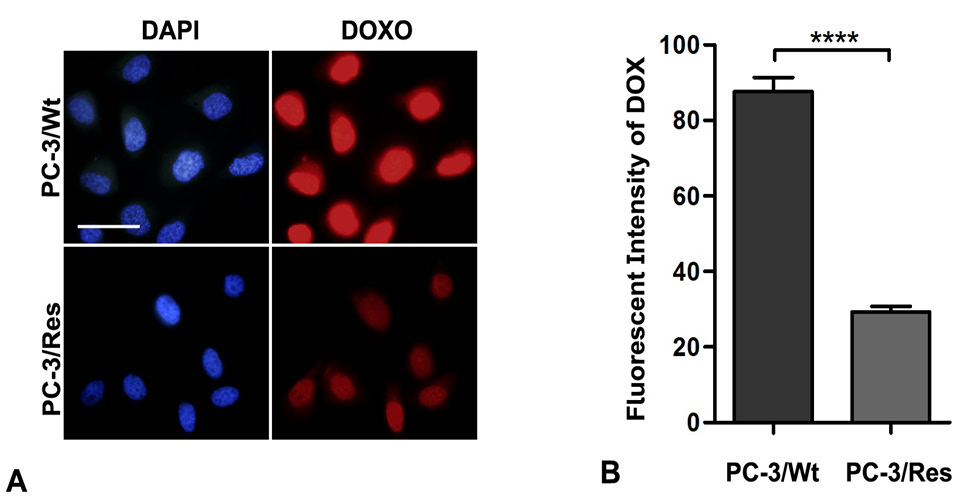
Functional analysis of MRP-1 over expression in PC-3/Res cells. (A) Efflux of doxorubicin in PC-3/Wt and PC-3/Res cells monitored using Olympus BX-51 fluorescent microscope. Cells were incubated with 5μM doxorubicin for 2 h and then allowed to efflux for 1h in drug free media. Bar, 50µm. (B) The intracellular fluorescent intensity of doxorubicin post efflux was measured and expressed as mean fluorescent intensity. Error bars represent standard error of mean, n=70; ****P ˂ 0.0001.
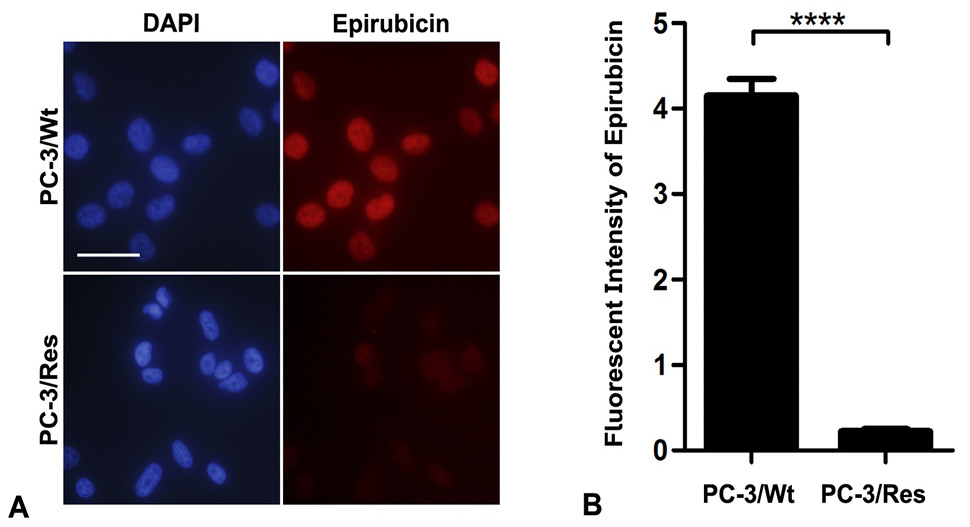
Decreased intracellular retention of epirubicin in PC-3/ Res cells. (A) Fluorescent microscope images of PC-3/Wt and PC-3/Res cells. Cells were incubated with 5μM epirubicin for 2 h and then allowed to efflux for 1 h in drug free media. Bar, 50µm. (B) Intracellular fluorescent intensity of epirubicin was quantified using Image J Software. Error bars represent standard error of mean, n=30; ****P ˂ 0.0001.
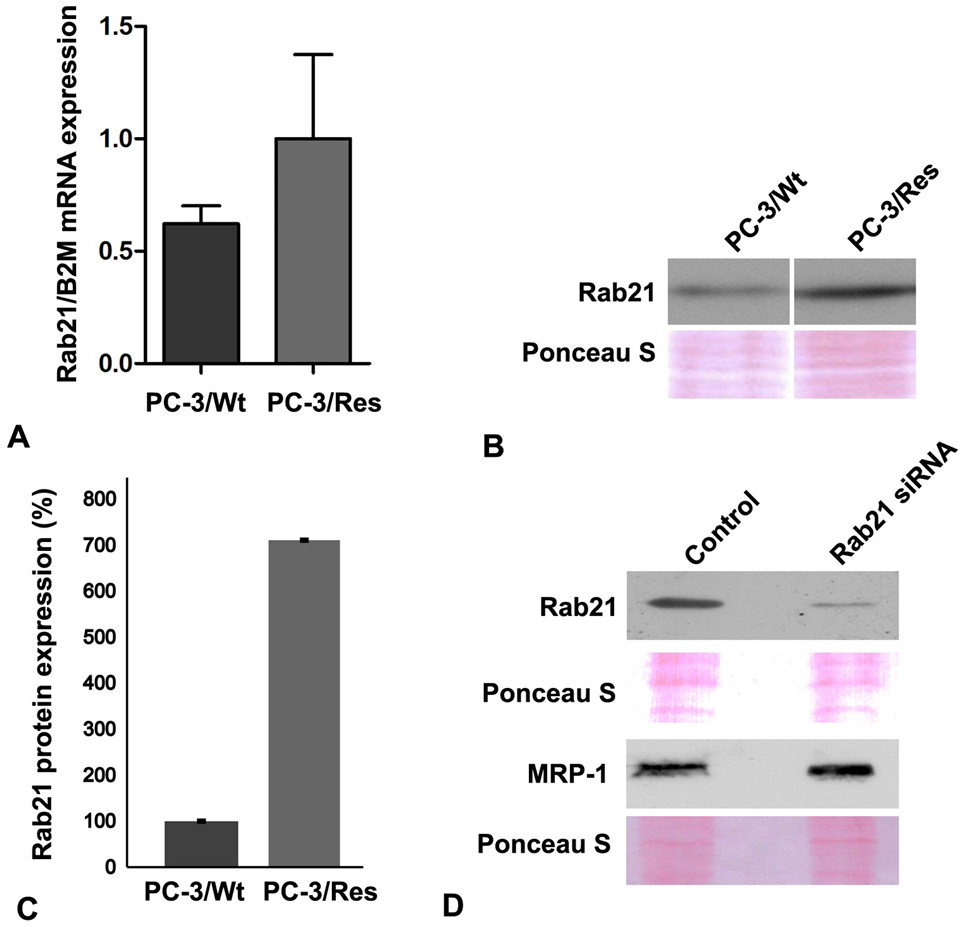
Increased expression of Rab21 in epirubicin resistant PC-3 cells. (A) The mRNA expression level of Rab21 was quantified by RT-PCR and normalised against B2M expression level. (B) Rab21 protein expression was determined by Western immunoblotting using Rab21 specific antibody. Ponceau S staining was used as a loading control. (C) Normalised expression of Rab21 protein in PC-3/Res cells represented as percentage of PC-3/Wt level. (D) Protein expression levels of Rab21 and ABCC1 in control and Rab21 siRNA transfected PC-3/Res cells.
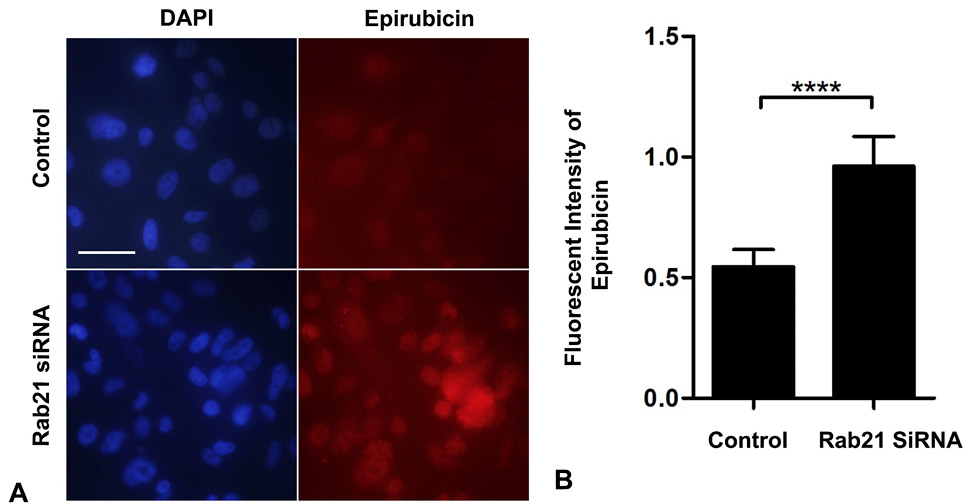
Down regulation of Rab21 decreases epirubicin efflux. (A) Fluorescent microscope images showing intracellular retention of epirubicin after efflux in control and Rab21 siRNA transfected PC-3/Res cells. All images were captured at the same magnification and exposure settings using an Olympus BX-51 fluorescence microscope. Bar, 50µm. (B) Fluorescent intensity of epirubicin was quantified in control and Rab21 siRNA transfected PC-3/Res cells using ImageJ Software. Error bars represent standard error of mean, n=30; ****P ˂ 0.0001.

