Stock Assessment of Trichiurus lepturus (Linneaus, 1758) in Zhejiang, China: A Proposal for Fishery Management


Stock Assessment of Trichiurus lepturus (Linneaus, 1758) in Zhejiang, China: A Proposal for Fishery Management
Qian Chong1, Muhammad Mohsin2*, Zhu Ting1, Chen Qiqi1 and Ana Mehak3
1School of Finance and Trade, Wenzhou Business College, Wenzhou, 325035, China
2Fisheries Management, College of International Finance and Trade, Zhejiang YueXiu University of Foreign Languages, Shaoxing, 312000, China
3Fisheries College, Ocean University of China, Qingdao, 266005, China
ABSTRACT
Zhejiang province marine waters are a significant place of commercial fisheries in China as these resources are rich in fish fauna. However, decreased fish biomass catch has been observed during recent years, putting a big question about the ongoing stock status of commercial fisheries. Therefore, this paper strives to appraise the population dynamics of Trichiurus lepturus in Zhejiang, China which would help fishery managers. For this, authentic data, 1999 – 2018, collected from Fishery Yearbooks of China was statistically evaluated through depletion models (DMs). In principle, three models, viz., Fox (FM), Schaefer (SM), and Pella-Tomlinson (PTM) of surplus production models (SPMs), a specialized form of DMs, were used and compared for getting the better-fitted model to draw results. SPMs were applied with the help of computer-based fishery analysis software, i.e., catch and effort data analysis (CEDA) and a stock production model incorporating covariates (ASPIC). In the principle initial portion (IP = 0.9), CEDA output showed higher values of maximum sustainable yield (MSY) (480000 – 614000 t) as compared to ASPIC (468000 – 583000 t). Similarly, R2 values followed the pattern of estimation with MSY. Research findings signpost overexploitation of T. lepturus. Therefore, it is recommended to lower the catch quantity of T. lepturus to safeguard this fishery resource for the future. Besides, further analogous research is strongly advised prior to making or executing any administration strategy.
Article Information
Received 24 February 2022
Revised 03 March 2022
Accepted 29 March 2022
Available online 01 June 2022
(early access)
Published 12 August 2022
Authors’ Contribution
QC and MM initiated this project, performed statistical analysis and wrote the manuscript. ZT, CQ and AM procured data, constructed tables and figures and revised several parts of the manuscript.
Key words
Trichiurus lepturus, Fishery, CEDA, ASPIC, Zhejiang
DOI: https://dx.doi.org/10.17582/journal.pjz/20220224140242
* Corresponding author: mohsingrw@hotmail.com
0030-9923/2022/0006-2553 $ 9.00/0
Copyright 2022 by the authors. Licensee Zoological Society of Pakistan.
This article is an open access article distributed under the terms and conditions of the Creative Commons Attribution (CC BY) license (https://creativecommons.org/licenses/by/4.0/).
INTRODUCTION
Zhejiang is a coastal province whose shores are drained by the East China Sea. The waters of this sea are rich in nutrients as many rivers, such as Qiantang, Yangtze, Ou, etc., flow into it. Thus, rich fish fauna dwell here (Liu et al., 2001). Excellent inshore and offshore breading and spawning sites occur near estuaries. Therefore, this sea’s marine waters are home to a variety of commercially important fish fauna such as large head hairtail (Trichiurus lepturus), large yellow croaker (Pseudosciaena crocea), butterfish (Pampus spp.), cuttlefish (Sepiella maindroni), small yellow croaker (Larimichthys polyactis), etc. (Zhao et al., 2016; Ji et al., 2019). Many migratory fishes, e.g., shark, frigate mackerel, etc., pass through the East China Sea. That’s why many famous fishery grounds, such as Zhoushan are located in Zhejiang.
Unfortunately, decreased fish biomass catch has been observed from the East China Sea during recent years. Because of traditional fishing, fishing grounds are damaged, resulting in a change in fish population structure. Thus, landed fishes with high trophic levels and economic values are replaced with low trophic levels and economic value (Zhu et al., 2009). It is reported that P. crocea are facing the issue of extinction. However, on the other hand, many other fishery resources, such as cuttlefish, are restoring their population with the passage of time. In the past several fishery management policies, such as projects of seeding release, summer moratorium, etc., have been implemented successfully, which have significantly helped to improve the fishery situation. However, some fishery resources are continuously collapsing (Shen and Heino, 2014). There are many reasons for the collapse of fishery resources, among which overfishing is the most significant (Ji et al., 2019). Therefore, accessing the fishery status of commercially important fish species dwelling in Zhejiang province is of immense importance. Therefore, this study undertakes fish population analysis of T. lepturus in Zhejiang, China.
It is very popular to manage fishery resources worldwide using a peculiar surplus production concept. Fundamentally, this idea is a practical application of depletion theory. Scientifically speaking, it means that fish biomass can be harvested consistently without affecting the residual population. This simply implies sustainable fishery harvest. Statistical models which employ the concept of surplus production are termed surplus production models and are abbreviated as SPMs very frequently. There are many reasons because of which plenty of literature related to fishery management employ these model as a tool to access fishery stock and give management advice. First, these models can use general fishery catch figures and estimate very important management parameters. Otherwise, fetching data through age-based models for fishery management advice is very complex. Second, these models are based on the depletion idea of fishery stock, which states that harvesting of fish results in decreasing fish abundance index (Hoggarth et al., 2006). Thus, these models are very appropriate fishery stock appraisal tools on which management decisions can rely (Jensen, 2002). In classical versions of SPMs, it was assumed that fish stock does not show variations such as population dynamics, predator-prey interactions, environmental induced variations, etc., which were unrealistic conditions. However, the latest SPMs suppose the dynamic nature of fish stock and so-termed as non-equilibrium SPMs (Hoggarth et al., 2006). In view of such qualities of non-equilibrium SPMs, they are used in this study.
Managing fishery resources requires the computation of parameters like maximum sustainable yield (MSY), fishing mortality (F) and Biomass (B). Depending upon the estimates of these parameters, target catch quantity can be suggested (Mohsin et al., 2019). However, this is an ideal situation. In the case of China, mostly fishery management is done by using other ways such as closure during summer (May to August), controlling fishing power or mesh size, etc. (Yue et al., 2015) because of fishery data-limited situation. Therefore, it becomes even more imperative to estimate MSY for developing sustainable fishery management policies (Ji et al., 2019). However, its reported catch has considerably decreased between 1999 and 2018 (CFY, 2019). Previously published online scientific literature documents some of the fishery management studies related to T. lepturus specie, Trichiurus genus specie or some other aspects of this fishery resource. For instance, one study studied the summer fishing ban and sustainable utilization of T. japonicas from the East China Sea (Yan et al., 2007). Likewise, some researchers explored the feeding habits and ecology of T. lepturus (Yunrong et al., 2011). The exploitation of T. japonicas in the East China Sea is also analyzed by fishery scientists (Ling et al., 2005). Thus, various researchers have contributed to understanding the fishery stock of Trichiurus genus in China. However, this is the initial effort to appraise the population status of T. lepturus from Zhejiang, China.
MATERIALs AND METHODS
Data collection
Reported long-term yearly based fishery statistics of T. lepturus spanning over twenty years from 1999 to 2018. The data used in this study is authentic and is reported by the Chinese Government for Zhejiang, China. This data is published in Fishery Yearbooks of China (CFY, 2019). We used two types of fishery statistics, i.e., number of fishermen (effort) and reported catch (or catch) of T. lepturus in tons (t). A special form of SPMs was used, i.e., non-equilibrium.
Data analysis
Three different versions of non-equilibrium SPMs were used to estimate fishery parameters. These routines or models were named based on their developer scientist, i.e., Fox (FM), Schaefer (SM), and Pella-Tomlinson (PTM). Although all of these routines are renowned fishery analysis tools, however, SM is usually the most preferred model. This model uses a particular type of fish population increase, i.e., logistic growth. This model can be written numerically as follows:
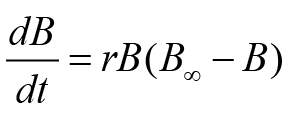 (Schaefer, 1954)
Above equality uses various parameters such as r (rate of fish growth), B, B∞ (carrying efficiency of fish stock), and t (time). The remaining two fishery routines, i.e., FM and PTM, use a special formula of growth. This growth formula was anticipated by Gompertz. These models also use the concept of generalized production. FM and PTM in the form of equality can be expressed as follows:
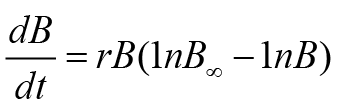 (
(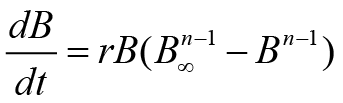 (
(In these model equations, n denotes parameter shape. As aforementioned, non-equilibrium SPMs were used in this study. These statistical routines are applied to the data by fishery monitoring computer applications, i.e., CEDA (catch and data analysis) and ASPIC (a stock production model incorporating covariates) (Prager, 2005; Hoggarth et al., 2006). When models are applied to fishery data, observed and expected catch values should have the same pattern ideally. However, practically we observe deviations. Therefore, to check these deviations, we used three error assumptions (EAs) in the former software, viz., CEDA. These error assumptions were termed as normal (NEA), log-normal (LNEA), and gamma. In the later software, i.e., ASPIC, two non-equilibrium SPM, viz., FM, and Logistic Model (LM) were used. It is necessary to explain why we used many models. The advantage of using many models includes that we can compare models and find a better fitting model for results interpretation. This is really very important for finding reliable results. We used criteria for accepting the results of a model and to consider any model for fishery management advice. First, MSY estimates in an appropriate range were considered. Models having very high or low MSY estimates as compared to observed or reported MSY were rejected. Second, for reliable results, goodness of fit, i.e., R2 value more than 0.5, was considered.
CEDA analysis tool
This famous fishery management software is a computer-based application with manual customized options for estimating parameters. This software estimates parameters by employing a method, viz., bootstrapping. In this method, parameters are estimated by taking a confidence interval of 95%. Before using CEDA, the initial proportion (IP) computed by diving first observed catch by highest one. Obtained IP value is the principal IP value or main IP value. However, we also did sensitivity analysis. In this analysis, we not only estimated fishery parameters for principal IP, but we also estimated them for the other IP values from 0.1 to 1.0. Zero represents no fishery. On the other hand, 1 means fully exploited fishery. Therefore, we employed all of the IP values to portray the complete and reliable picture of the fishery status of T. lepturus in Zhejiang, China. Dot file containing catch and effort fishery statistics was prepared and uploaded into CEDA software. Later on, this file was run and manually modeled, and its EA was selected. Observations were recorded, and residual plots were manually constructed by using Excel 2013 based on the values obtained during the analysis. Salient estimates of CEDA include MSY, r, B, catchability coefficient (q), the goodness of fit (R2), and carrying capacity (K).
ASPIC analysis tool
For fishery management advice this software is famous all over the world. Its frequent use depends upon its reliability and computation of exclusive parameters. Similar to CEDA, it needs specially prepared files to be uploaded in this software for the computation of fishery management parameters. The preparation of files needs the input of various estimates using formulas. BOT and FIT files were used in ASPIC, which basically represent different program modes. Former is used for management, whereas latter mode uses bootstrapping method. Usually running time of the later mode is considerable long as compared to the former one. It is worth mentioning that for each IP value, individual files of both file types were used. This software estimated MSY, R2, K, q, F, F/FMSY, and B/BMSY.
RESULTS
Reported fishery statistics indicate decreased landed biomass of T. lepturus at dock stations during the study period. In 1999, the recorded catch was 586125 t which declined and became 387968 t in 2018. A decline in catch is not gradual. Rather, it showed many fluctuations with maximum, minimum, and average catch quantity of 649108 t (2000), 361357 t (2007), and 487383 t/year. An effort has also decreased from 442334 (1999) to 371278 (2018) after many variations. Maximum, minimum, and average effort remained 470670 (2003), 342800 (2016), and 408432 (Fig. 1). CPUE showed many variations and decreased from 1.325 (1999) to 1.045 (2018). The average CPUE during the study period was calculated as 1.192. Maximum and minimum CPUE, i.e., 1.479 and 0.928, was observed during 2000 and 2007 (Fig. 2). Observed and calculated estimates of MSY by using CEDA for all the models are presented in Figure 3 in the form of residual plots. Superficially these plots appear to look similar; however minor differences can be observed between them (Fig. 3).
CEDA software result
MSY estimates of sensitivity analysis for T. lepturus by using CEDA are written in the Table I. For smaller IP values, CEDA estimated higher MSY estimates until IP = 0.5. However, from IP = 0.6 to 1.0, this software estimated lower MSY estimates for smaller values of IP and larger MSY estimates against larger values of IP. For all of the IP values, sometimes CEDA showed MF. Table II represents CEDA estimates of different parameters for T. lepturus. For FM, MSY was estimated as 613242 t and 606543 t by using NEA and LNEA. Here, GEA showed MF. In this model, R2 was calculated as 0.652 and 0.619 for NEA and LNEA. For SM and PTM, MSY and R2 were estimated as 489185 t and 0.652 for NEA. Whereas, for LNEA, their estimated remained as 492586 t and 0.616, accordingly. Whether, it was SM or PTM, GEA encountered MF.
ASPIC software result
Results of sensitivity analysis to estimate MSY for T. lepturus by using ASPIC are presented in Table III. For FM, various MSY estimates were obtained for different IP values without any specific pattern. Like, against IP of 0.1, this parameter was estimated as 474000 t, and IP of 0.9 its computed figure remained 468000 t. The calculated values of R2 remained lower than 4. For LM, the same pattern of parameter estimation, i.e., MSY and R2 was observed. Table IV denotes estimates of diverse parameters for IP having the value of 0.9. In FM, this software calculated MSY and R2 as 468000 t and 0.346, respectively. At the same time, other estimated parameters, i.e., FMSY, BMSY, q, and K, were calculated as 0.079, 5913000 t, 1.17E-07, and 16070000 t, in that order. For LM, calculated values of MSY and R2 were observed as 5825000 t and 0.349, correspondingly. In this model, the values of FMSY, BMSY, q, and K were found as 0.050, 11690000 t, 2.12E-07, and 23370000 t. ASPIC estimates of F and B for T. lepturus are given in Table V. In FM, it was observed that F has decreased from 0.050 (1999) to 0.041 (2018). In contrast with F, B has also declined from 11880000 t (1999) to 9458000 t (2018). Likewise, F/FMSY and B/BMSY also showed decreasing trend. For LM, all the parameters, i.e., F, B, F/FMSY, B/BMSY, showed decreasing trend.
DISCUSSION
Many parameters can be used for making fishery management policies. These parameters include MSY, CPUE, BMSY, and FMSY. Among them, CPUE represents the simplest way to indicate fishery status. The trend of these parameters directs about the status of the fishery and hence helps to make a management plan. Rise or fall in CPUE happens because of some quantitative variations in the fish population. The fishery is usually recommended to continue at the same level when CPUE does not show fluctuation. However, overexploitation occurs when CPUE falls, and on the other hand, effort rises (Mohsin et al., 2021). It is observed that the CPUE of eel fish has fallen from 1999 (1.325) to 2018 (1.045), which signposts overexploitation of this fishery resource. As aforementioned, besides CPUE, there are also other parameters such as MSY, which are more statistically important parameters to evaluate fishery stock status. Since 1992 this parameter has been frequently used for fishery management purposes around the globe (Hoggarth et al., 2006). MSY indicates the catch level without ensuring any fixed catch quantity. Thus, the catch level must be predicted carefully because wrong MSY estimation will result in losses. Over or underestimation
Table I. Sensitivity analysis to estimate MSY of T. lepturus by using CEDA (IP = 0.1-1.0).
|
IP |
|
|
|
|
Model |
|
|
|
|
|
|
FM |
SM |
PTM |
||||||||
|
NEA |
LNEA |
GEA |
NEA |
LNEA |
GEA |
NEA |
LNEA |
GEA |
||
|
0.1 |
766932 |
835586 |
MF |
1452441 |
1365912 |
5608038 |
1452441 |
1365912 |
5608038 |
|
|
(0.064) |
(0.002) |
(MF) |
(0.037) |
(0.012) |
(0.629) |
(0.038) |
(0.011) |
(2.008) |
||
|
0.2 |
526046 |
549889 |
1904965 |
790515 |
726506 |
MF |
790515 |
726506 |
MF |
|
|
(0.067) |
(0.011) |
(0.151) |
(0.049) |
(0.022) |
(MF) |
(0.048) |
(0.024) |
(MF) |
||
|
0.3 |
448186 |
470781 |
MF |
579207 |
538306 |
575342 |
579207 |
538306 |
575342 |
|
|
(0.061) |
(0.017) |
(MF) |
(0.061) |
(0.028) |
(0.067) |
(0.063) |
(0.030) |
(0.067) |
||
|
0.4 |
419028 |
434674 |
29207570 |
482533 |
458061 |
479710 |
482533 |
458061 |
479710 |
|
|
(0.062) |
(0.029) |
(1932) |
(0.071) |
(0.031) |
(0.073) |
(0.071) |
(0.032) |
(0.076) |
||
|
0.5 |
414681 |
423234 |
413500 |
434639 |
421692 |
2505560 |
434639 |
421692 |
2505560 |
|
|
|
(0.070) |
(0.046) |
(0.074) |
(0.064) |
(0.047) |
(2411) |
(0.065) |
(0.043) |
(3891) |
|
|
0.6 |
428454 |
447156 |
428065 |
414681 |
392931 |
MF |
414681 |
392931 |
MF |
|
|
(0.080) |
(0.047) |
(0.090) |
(0.069) |
(0.060) |
(MF) |
(0.069) |
(0.069) |
(MF) |
||
|
0.7 |
460980 |
481109 |
461182 |
415635 |
413177 |
MF |
415635 |
413177 |
MF |
|
|
(0.092) |
(0.063) |
(0.105) |
(0.078) |
(0.065) |
(MF) |
(0.076) |
(0.057) |
(MF) |
||
|
0.8 |
517990 |
517366 |
518955 |
438217 |
467942 |
1421794 |
438217 |
467942 |
1421794 |
|
|
(0.143) |
(0.117) |
(0.142) |
(0.108) |
(0.059) |
(35) |
(0.114) |
(0.073) |
(4.187) |
||
|
0.9 |
613242 |
606543 |
MF |
489185 |
492586 |
MF |
489185 |
492586 |
MF |
|
|
(0.190) |
(0.206) |
(MF) |
(0.141) |
(0.143) |
(MF) |
(0.182) |
(0.161) |
(MF) |
||
|
1.0 |
10709830 |
10479470 |
MF |
9741472 |
5593672 |
MF |
9741472 |
5593672 |
MF |
|
|
(2.853) |
(4.512) |
(MF) |
(3.404) |
(5.825) |
(MF) |
(2.897) |
(5.877) |
(MF) |
||
CV, coefficient of variation (written in parenthesis); MF, minimization failure.
Table II. CEDA estimates of various parameters for T. lepturus (IP = 0.9).
|
Model |
MSY |
R2 |
q |
r |
B |
K |
|
FM (NEA) |
613242 |
0.652 |
9.71E-08 |
0.104 |
1.15E+07 |
1.61E+07 |
|
FM (LNEA) |
606543 |
0.619 |
1.02E-07 |
0.107 |
1.09E+07 |
1.54E+07 |
|
FM (GEA) |
MF |
MF |
MF |
MF |
MF |
MF |
|
SM (NEA) |
489185 |
0.652 |
1.04E-07 |
0.130 |
1.07E+07 |
1.51E+07 |
|
SM (LNEA) |
492586 |
0.616 |
1.37E-07 |
0.169 |
8.13E+06 |
1.17E+07 |
|
SM (GEA) |
MF |
MF |
MF |
MF |
MF |
MF |
|
PTM (NEA) |
489185 |
0.652 |
1.04E-07 |
0.130 |
1.07E+07 |
1.51E+07 |
|
PTM (LNEA) |
492586 |
0.616 |
1.37E-07 |
0.169 |
8.13E+06 |
1.17E+07 |
|
PTM (GEA) |
MF |
MF |
MF |
MF |
MF |
MF |
MSY, Maximum sustainable yield; R2, coefficient of determination; CV, coefficient of variation; q, Catchability coefficient; r, intrinsic population growth rate; B, final biomass; K, carrying capacity; MF, Minimization failure.
of this parameter will result in overexploitation or under exploitation. Both situations will lead to economic losses (Rosenberg et al., 1993). Statistical estimates of MSY determine harvest levels. Suppose calculated values of these parameters are greater than the reported catch, then more exploitation of fishery resources until the MSY level is recommended. This condition represents overharvesting. If calculated figures are smaller when compared to the observed catch, then deduced fishery catch is suggested as this condition symbolizes overexploitation. However, the fishery is suggested to remain at the same level when MSY estimates and observed catch are almost the same (Hoggarth et al., 2006). The calculated values of MSY for eel fish are lower than the observed catch, so it indicates that the fishery is overharvested.
Managing fishery resources is a multi-step process. This procedure begins with data gathering and finishes at formulating administration policy (FAO, 1997). Statistical points or reference points are estimated for fishery management. These points help to understand fishery status and guide to make management plan (Hoggarth et al., 2006). These points fall under two categories. First, points that are followed to achieve comprehensive management and hence are called target points. Second, points that are avoided to encounter are termed as limit points. These points are statistical estimates to control fishery (Caddy and Mahon, 1995; Cochrane, 2002). Many previously documented studies related to fishery management have employed the same statistical techniques which we have used in this study. These models use some plausible assumptions. Such as, there is no competition between fish populations, i.e., intra or inter-species competition. Fish age composition is not related to r in any way. Catch data represents the single fish population from where it is fetched. Data truly represents fish catch and effort. Both mortality types, i.e., fishing and natural happen at once (Ewald and Wang, 2010). Although some of these assumptions may not be met under natural conditions, however this happening does not nullify the importance of these models in management studies. In fact, these are famous and reliable management methods (Musick and Bonfil, 2005). Actually, their frequent use rests on their easy handling and estimation of important fishery parameters such as Fcurrent, BMSY, etc. (Ewald and Wang, 2010).
Table III. Sensitivity Analysis to estimate MSY of T. lepturus by using ASPIC (IP = 0.1-1.0).
|
Model |
IP |
MSY |
R2 |
FMSY |
BMSY |
q |
K |
|
FM |
0.1 |
474000 |
0.346 |
0.081 |
5853000 |
1.17E-07 |
15910000 |
|
0.2 |
484400 |
0.348 |
0.043 |
11310000 |
1.99E-07 |
30750000 |
|
|
0.3 |
482200 |
0.346 |
0.084 |
5773000 |
1.17E-07 |
15690000 |
|
|
0.4 |
577800 |
0.346 |
0.095 |
6068000 |
9.63E-08 |
16490000 |
|
|
0.5 |
401900 |
0.346 |
0.059 |
6757000 |
1.50E-07 |
18370000 |
|
|
0.6 |
480500 |
0.346 |
0.083 |
5788000 |
1.17E-07 |
15730000 |
|
|
0.7 |
588500 |
0.346 |
0.095 |
6167000 |
9.36E-08 |
16760000 |
|
|
0.8 |
636500 |
0.345 |
0.099 |
6418000 |
8.63E-08 |
17450000 |
|
|
0.9 |
468000 |
0.346 |
0.079 |
5913000 |
1.17E-07 |
16070000 |
|
|
1.0 |
584200 |
0.348 |
0.037 |
15660000 |
2.12E-07 |
42580000 |
|
|
LM |
0.1 |
531900 |
0.349 |
0.052 |
10180000 |
2.12E-07 |
20360000 |
|
0.2 |
568400 |
0.349 |
0.050 |
11280000 |
2.12E-07 |
22550000 |
|
|
0.3 |
562400 |
0.349 |
0.051 |
11090000 |
2.12E-07 |
22190000 |
|
|
0.4 |
593900 |
0.349 |
0.049 |
12020000 |
2.12E-07 |
24050000 |
|
|
|
0.5 |
548500 |
0.349 |
0.051 |
10680000 |
2.12E-07 |
21370000 |
|
0.6 |
568300 |
0.349 |
0.050 |
11270000 |
2.12E-07 |
22540000 |
|
|
0.7 |
581000 |
0.349 |
0.050 |
11640000 |
2.12E-07 |
23290000 |
|
|
0.8 |
579400 |
0.349 |
0.050 |
11600000 |
2.12E-07 |
23200000 |
|
|
0.9 |
582500 |
0.349 |
0.050 |
11690000 |
2.12E-07 |
23370000 |
|
|
1.0 |
567600 |
0.349 |
0.050 |
11250000 |
2.12E-07 |
22510000 |
Table IV. ASPIC estimates of various parameters for T. lepturus (IP = 0.9).
|
Model |
IP |
MSY |
R2 |
FMSY |
BMSY |
q |
K |
|
FM |
0.9 |
468000 |
0.346 |
0.079 |
5913000 |
1.17E-07 |
16070000 |
|
LM |
0.9 |
582500 |
0.349 |
0.050 |
11690000 |
2.12E-07 |
23370000 |
Table V. ASPIC estimates of F and B for T. lepturus (IP = 0.9).
|
Year |
Model |
|||||||
|
FM |
LM |
|||||||
|
F |
B |
F/FMSY |
B/BMSY |
F |
B |
F/FMSY |
B/BMSY |
|
|
1999 |
0.050 |
11880000 |
0.631 |
2.009 |
0.091 |
6490000 |
1.829 |
0.555 |
|
2000 |
0.057 |
11580000 |
0.719 |
1.959 |
0.104 |
6368000 |
2.077 |
0.545 |
|
2001 |
0.054 |
11240000 |
0.677 |
1.902 |
0.097 |
6176000 |
1.955 |
0.529 |
|
2002 |
0.051 |
10970000 |
0.640 |
1.856 |
0.092 |
6030000 |
1.847 |
0.516 |
|
2003 |
0.050 |
10760000 |
0.629 |
1.820 |
0.090 |
5923000 |
1.813 |
0.507 |
|
2004 |
0.053 |
10570000 |
0.667 |
1.788 |
0.096 |
5830000 |
1.922 |
0.499 |
|
2005 |
0.045 |
10380000 |
0.570 |
1.755 |
0.082 |
5711000 |
1.642 |
0.489 |
|
2006 |
0.050 |
10270000 |
0.632 |
1.737 |
0.091 |
5674000 |
1.819 |
0.486 |
|
2007 |
0.036 |
10130000 |
0.451 |
1.713 |
0.064 |
5589000 |
1.290 |
0.478 |
|
2008 |
0.050 |
10140000 |
0.633 |
1.714 |
0.090 |
5653000 |
1.803 |
0.484 |
|
2009 |
0.050 |
10010000 |
0.630 |
1.692 |
0.090 |
5574000 |
1.797 |
0.477 |
|
2010 |
0.054 |
9887000 |
0.682 |
1.672 |
0.097 |
5499000 |
1.952 |
0.471 |
|
2011 |
0.048 |
9741000 |
0.611 |
1.647 |
0.088 |
5385000 |
1.758 |
0.461 |
|
2012 |
0.047 |
9659000 |
0.594 |
1.634 |
0.085 |
5327000 |
1.711 |
0.456 |
|
2013 |
0.046 |
9597000 |
0.581 |
1.623 |
0.084 |
5283000 |
1.678 |
0.452 |
|
2014 |
0.044 |
9549000 |
0.550 |
1.615 |
0.079 |
5249000 |
1.587 |
0.449 |
|
2015 |
0.046 |
9528000 |
0.583 |
1.611 |
0.084 |
5240000 |
1.685 |
0.448 |
|
2016 |
0.045 |
9485000 |
0.572 |
1.604 |
0.083 |
5205000 |
1.655 |
0.445 |
|
2017 |
0.041 |
9453000 |
0.523 |
1.599 |
0.075 |
5179000 |
1.514 |
0.443 |
|
2018 |
0.041 |
9458000 |
0.518 |
1.600 |
0.075 |
5190000 |
1.497 |
0.444 |
It is necessary to clarify that this study used many NESPMs simultaneously. The reason for using more than one model was to ensure the reliability of the results. In this way, models can also be compared, and the results of the best model can be used to formulate management advice. Occasionally, different models estimate the same values of parameters which happens because of some untestable model suppositions (Hoggarth et al., 2006).
Overexploitation of fishery resources has great social, biological, as well as economic impacts. Overexploitation leads to uncontrolled harvesting of the fishery resource. This happens as fishermen try to increase their revenues. On the other hand, this situation leads to decreased fish biomass production in subsequent years, or in severe cases, extinction of commercially important fish species can also occur (Clark, 1973). When the fishery starts somewhere, in the beginning, fishermen earn a lot of profit which encourages other fishermen to join this business. With the passage of time, the number of fishermen increases, and catch also increases. However, at some point number of fishermen continues to increase but catch starts to decrease. Later on the discounted gain of fishermen decreases until the minimum level of earnings is earned by fishermen. The fishery stock is considerably overexploited at this stage. However, restoring this stock can bring economic gains (Grafton et al., 2007). But, unfortunately, fishermen usually do not agree with this idea because they have to pay transition costs. If some other alternative of these costs, such as harvesting rights or arrangement of temporary jobs, etc. can be arranged, it may facilitate fishermen to agree with fish stock rebuilding (Clark, 1973; Grafton et al., 2007; Grafton, 1995).
CONCLUSION
Diverse MSY figures and fishery parameters were obtained during this study. ASPIC showed lower MSY estimates with respect to CEDA, i.e., 468000 – 583000 t and 480000 – 614000 t, respectively (IP = 0.9). Since, R2 values are higher for CEDA, therefore, by considering this software output values it is observed that predicted MSY level, 468000 t, has been achieved in 2011. Before this year, this fishery indicates overexploitation. From 2011 gradual decrease in fish biomass can be observed which may indicate some other factors playing their role along with MSY. Thus, in order to ensure sustainable fisheries, catch quantities should be lowered. To be on a safe side and by using precautionary approach it is recommended to lower catch quantity up to 350000 t. Besides, it is strongly recommended to conduct further studies to verify the results obtained in this study and to find effect of other factors on fishery population dynamics as this is just a preliminary study.
ACKNOWLEDGEMENT
Authors are grateful to 2021 Wenzhou Oujiang Young Social Science Scholars Special Research Project (Grant No. 21QN12).
Statement of conflict of interest
The authors have declared no conflict of interest.
REFERENCES
Caddy, J.F. and Mahon, R., 1995. Reference points for fisheries management. FAO Fish. Tech. Paper No. 347. FAO’s Fisheries Department, Rome, Italy, pp. 1-83.
CFY, 2019. China fishery yearbooks. Beijing Press, China.
Clark, C.W., 1973. The economics of overexploitation. Science, 181: 630-634. https://doi.org/10.1126/science.181.4100.630
Cochrane, K.L., 2002. The use of scientific information in the design of management strategies. Chapter 5, pp 95-130. In: A fishery manager’s guidebook: Management measures and their application (ed. K.L. Cochrane). FAO Fisheries Technical Paper No. 424, FAO’s Fisheries Department, Rome, Italy, pp. 1-231.
Ewald, C.O. and Wang, W.K., 2010. Sustainable yields in fisheries: Uncertainty, risk-aversion, and mean variance analysis. Nat. Resour. Model, 23: 303-323. https://doi.org/10.1111/j.1939-7445.2010.00065.x
FAO, 1997. Fisheries management. FAO Technical Guidelines for Responsible Fisheries No. 4, FAO’s Fisheries Department, Rome, Italy, pp. 1-82.
Fox, Jr. W.W., 1970. An exponential surplus-yield model for optimizing exploited fish populations. Trans. Am. Fish. Soc., 99: 80–88. https://doi.org/10.1577/1548-8659(1970)99<80:AESMFO>2.0.CO;2
Grafton, R.Q., 1995. Rent capture in a rights-based fishery. J. Environ. Econ. Manage., 28: 48-67. https://doi.org/10.1006/jeem.1995.1004
Grafton, R.Q., Kompas, T. and Hilborn, R.W., 2007. Economics of overexploitation revisited. Science, 318: 1601. https://doi.org/10.1126/science.1146017
Hoggarth, D.D., Abeyasekera, S., Arthur, R.I., Beddington, J.R., Burn, R.W., Halls, A.S., Kirkwood, G.P., McAllister, M., Medley, P., Mees, C.C., Parkes, G.B., Pilling, G.M., Wakeford, R.C. and Welcomme, R.L., 2006. Stock assessment for fishery management: A framework guide to the stock assessment tools of the fisheries management science program. FAO Fish. Tech. Paper No. 487.FAO’s Fisheries Department, Rome, Italy, pp. 1-261.
Jensen, A.L., 2002. Maximum harvest of a fish population that has the smallest impact on population biomass. Fish. Res., 57: 89–91. https://doi.org/10.1016/S0165-7836(01)00337-X, https://doi.org/10.1007/s13131-019-1343-4
Ji, Y., Liu, Q., Liao, B., Zhang, Q. and Han, Y., 2019. Estimating biological reference points for largehead hairtail (Trichiurus lepturus) fishery in the Yellow Sea and Bohai Sea. Acta Oceanol. Sin., 38: 20–26. https://link.springer.com/article/10.1007/s13131-019-1343-4
Ling, J., Yan L. and Lin L., 2005. Reasonable utilization of hairtail Trichiurus japonicus resource in the East China Sea based on its fecundity. J. Fish. Sci. China, 12: 726–730.
Liu, Z.L., Ning, X.R. and Cai, Y.M., 2001. Primary productivity and standing stock of the phytoplankton in the Hangzhou Bay to the Zhoushan fishing ground during autumn. Acta Oceanol. Sin., 23: 93–99.
Mohsin, M., Guilin, D., Zhou, C., Hengbin, Y. and Noman, M., 2019. Maximum sustainable yield estimates of Carangoides fishery resource in Pakistan and its bioeconomic implications. Pakistan J. Zool., 51: 279–287. https://doi.org/10.17582/journal.pjz/2019.51.1.279.287
Mohsin, M., Hengbin, Y. and Luyao, Z., 2021. Application of non-equilibrium SPMs to access overexploitation risk faced by Scomberomorus sinensis in Shandong, China. Pakistan J. Zool., 53: 439-446. https://doi.org/10.17582/journal.pjz/20190901040914
Musick, J.A. and Bonfil, R., 2005. Management techniques for elasmobranch fisheries. FAO Fish. Tech. Paper No. 474. FAO’s Fisheries Department, Rome, Italy, pp. 1-251.
Pella, J.J., and Tomlinson, P.K., 1969. A generalized stock production model. Int. Am. Trop. Tuna Comm. Bull., 13: 416–497.
Prager, M.H., 2005. A stock-production model incorporating covariates (Version 5) and auxiliary programs. CCFHR (NOAA) Miami Laboratory Document MIA-92/93-55, Beaufort Laboratory Document BL-2004-01.
Rosenberg, A.A., Fogarty, M.J., Sissenwine, M.P., Beddington, J.R. and Shepherd, J.G., 1993. Achieving sustainable use of renewable resources. Science, 262: 828-829. https://doi.org/10.1126/science.262.5135.828
Schaefer, M.B., 1954. Some aspects of the dynamics of populations important to the management of the commercial marine fisheries. Int. Am. Trop. Tuna Comm. Bull., 1: 23-56.
Shen, G., and Heino, M., 2014. An overview of marine fisheries management in China. Mar. Policy, 44: 265–272. https://doi.org/10.1016/j.marpol.2013.09.012
Yan, L.P., Hu, F., Li, S.F., Liu, Y., Zhou, Y.D. and Liu, Z.F., 2007. The effect of summer closed fishing and the reasonable utilization on hairtail (Trichiurus japonicus) resources in the East China Sea region. J. Nat. Resour., 22: 606–612.
Yue, D., Wang, L. and Zhang. X., Zheng, H. and Zhang, H., 2015. Status and reflections of the summer closed fishing in the East China Sea. J. Agric. Sci. Technol., 17: 122–128.
Yunrong, Y., Gang, H., Junlan, C., Huosheng, L. and Xianshi, J., 2011. Feeding ecology of hairtail Trichiurus margarites and largehead hairtail Trichiurus lepturus in the Beibu Gulf, the South China Sea. Chin. J. Oceanol. Limnol. 29: 174–183. https://doi.org/10.1007/s00343-011-0004-z
Zhao, S.J., Lu, B.Q., Li, R.W., Zhu, A.Y. and Wu, C.W., 2016. A preliminary analysis of fishery resource exhaustion in the context of biodiversity decline. Sci. China Earth Sci., 59: 223–235. https://doi.org/10.1007/s11430-015-5193-4
Zhu, X.G., Fang, Y.Y., Yan, L.J., Zhang, G. and Huang, L., 2009. The ecological strategy evolution of marine fishes under high intensity fishing environment. Bull. Sci. Technol., 25: 51–55.
To share on other social networks, click on any share button. What are these?