


Study on the NPK Uptake and Growth of Rice under Two different Cropping Systems with different Doses of Organic Fertilizer in the Imogiri Subdistrict, Yogyakarta Province, Indonesia
Sri Nuryani Hidayah Utami*, Andin Muhammad Abduh, Eko Hanudin and Benito Heru Purwanto
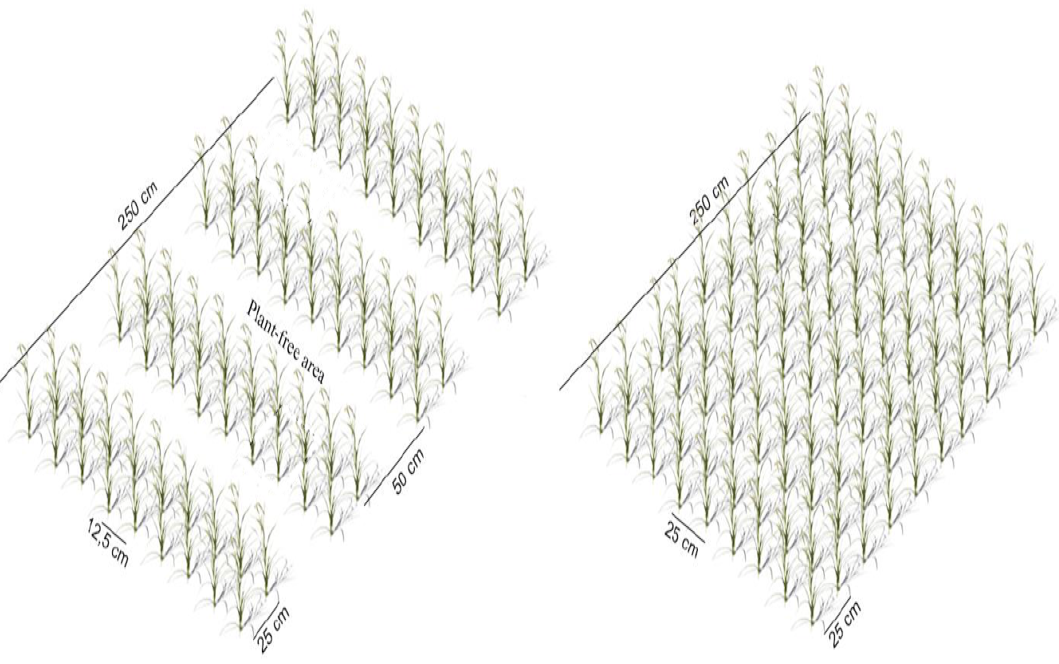
Grid system and Jarwo 2 : 1 (Abduh et al., 2019).
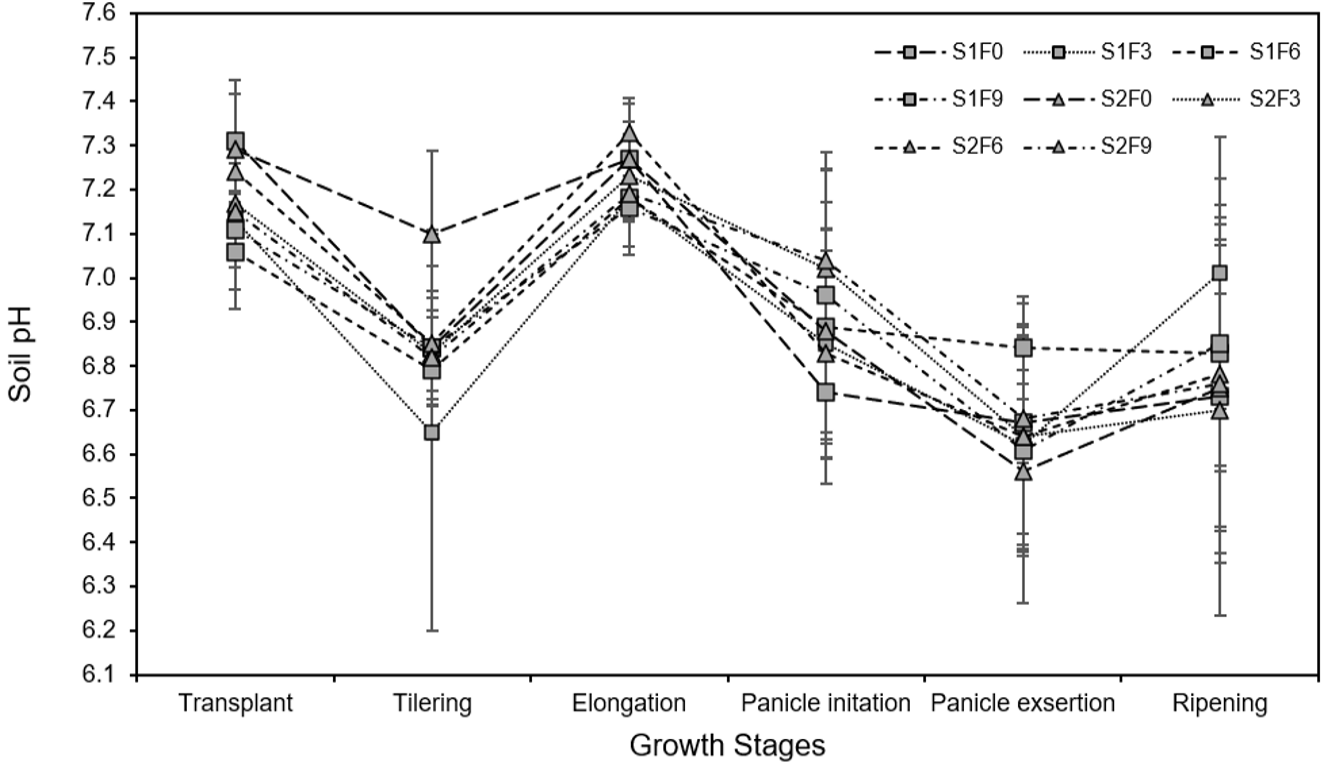
Soil pH in the rice growth stages. Error bars represent standard deviation of three samples. S1 = grid, S2 = Jarwo 2: 1, F0 = 0 ton ha-1, F3 = 3 ton ha-1, F6 = 6 ton ha-1, F9 = 9 ton ha-1.

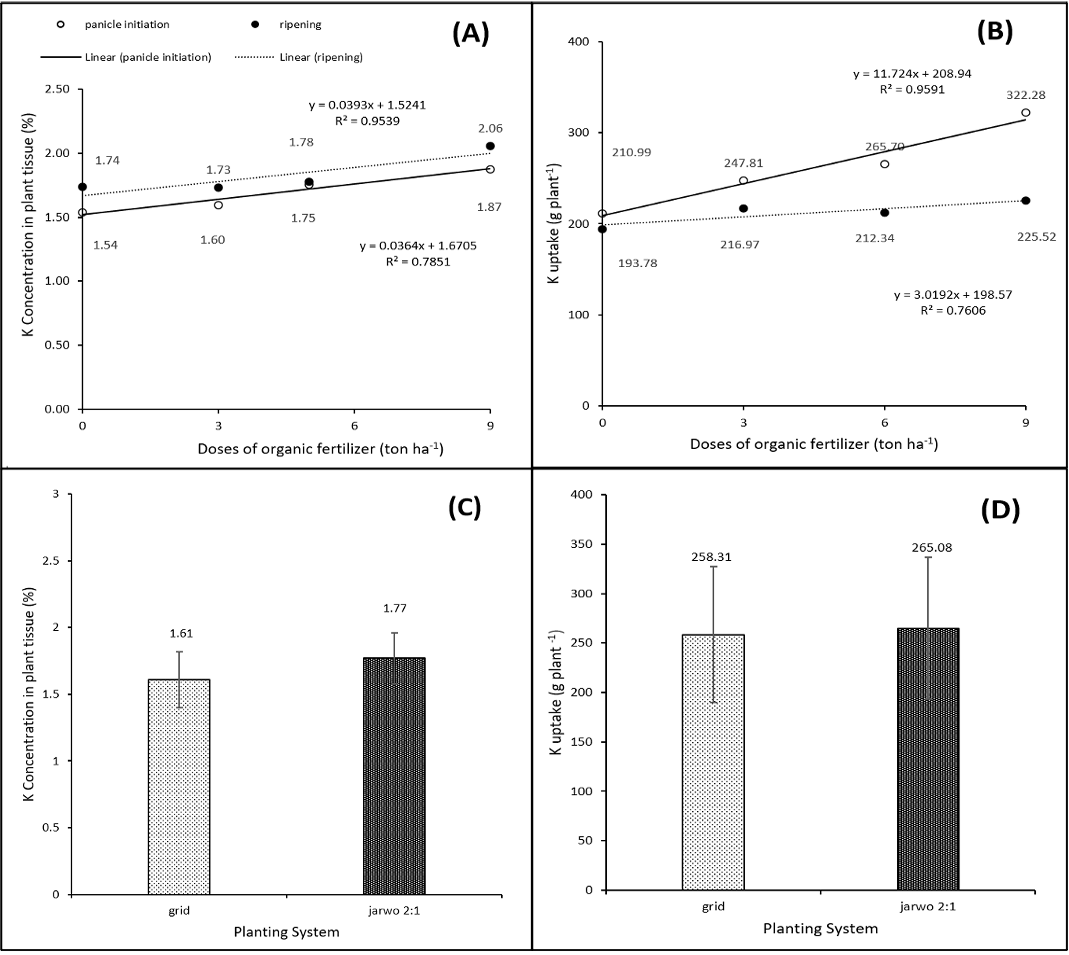
Potassium concentration (a) in plant tissue and Potassium uptake (b) at different doses of organic fertilizer. Potassium concentration (c) in plant tissue and Potassium uptake (d) at different cropping systems. Error bars represent standard deviation. Arrows of continuous and dotted lines show the trend between doses of organic fertilizer and NPK in whole plant.
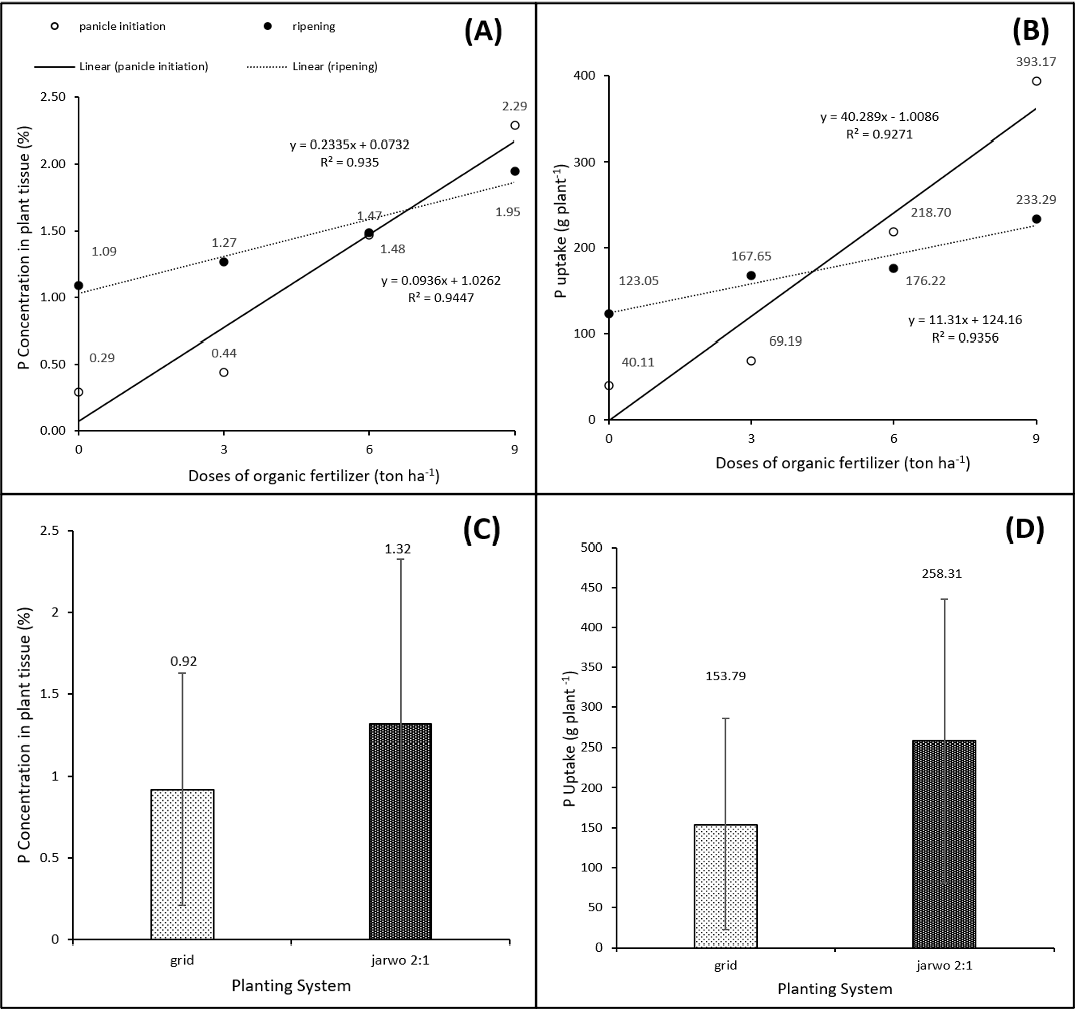
Phosphate concentration (a) in plant tissue and Phosphate uptake (b) at different doses of organic fertilizer. Phosphate concentration (c) in plant tissue and Phosphate uptake (d) at different cropping systems. Error bars represent standard deviation. Arrows of continuous and dotted lines show the trend between doses of organic fertilizer and NPK in whole plant.

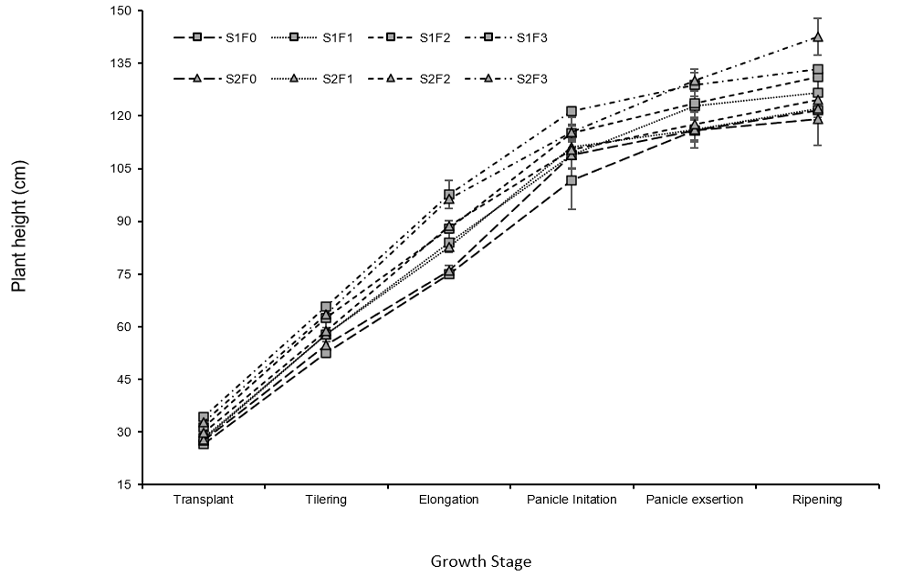
The dynamics of plant height (a) affected by cropping system and organic fertilizer doses. Error bars represent standard deviation of three samples. S1 = grid, S2 = Jarwo 2:1, F0 = 0 tons ha-1, F3 = 3 tons ha-1, F6 = 6 tons ha-1, F9 = 9 tons ha-1.

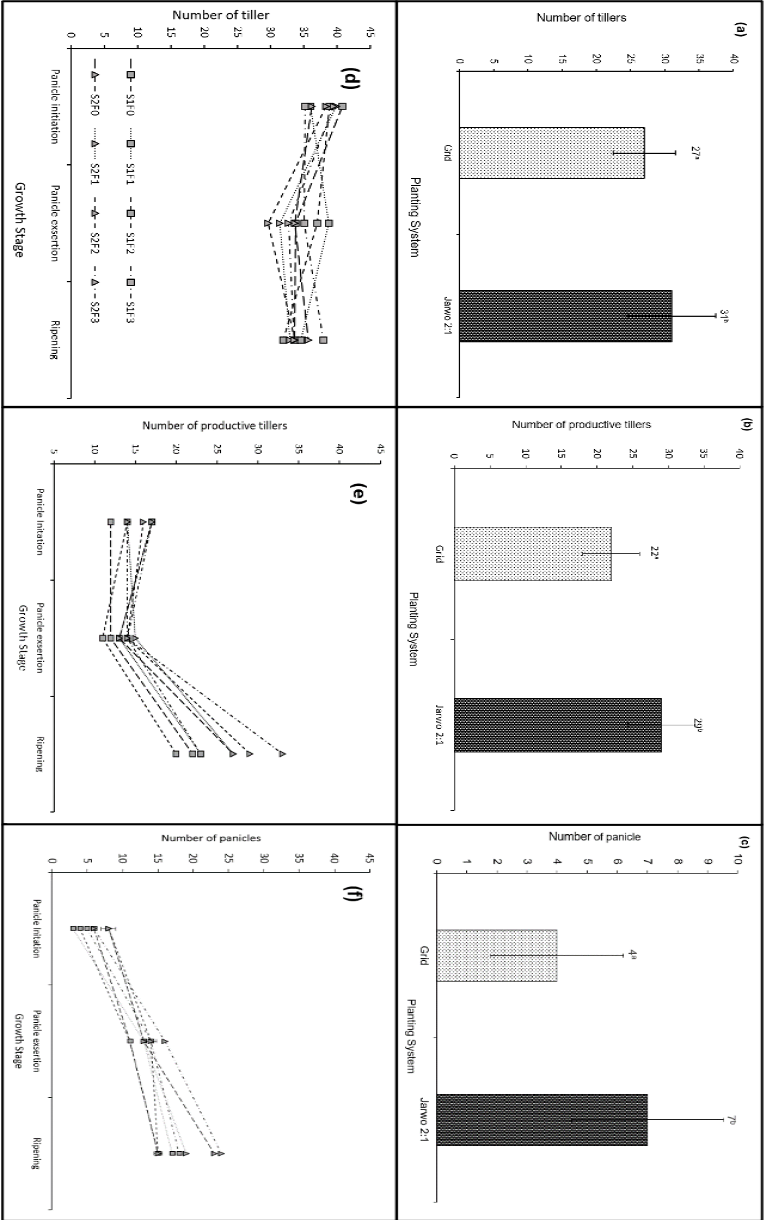
Number of tillers (a), productive tillers (b), and panicle (c) affected by different cropping pattsystems. The dynamics of the number of tillers (d), productive tillers (e), and panicle (f) as affected by cropping systems and organic fertilizer doses. Error bars represent standard deviation.

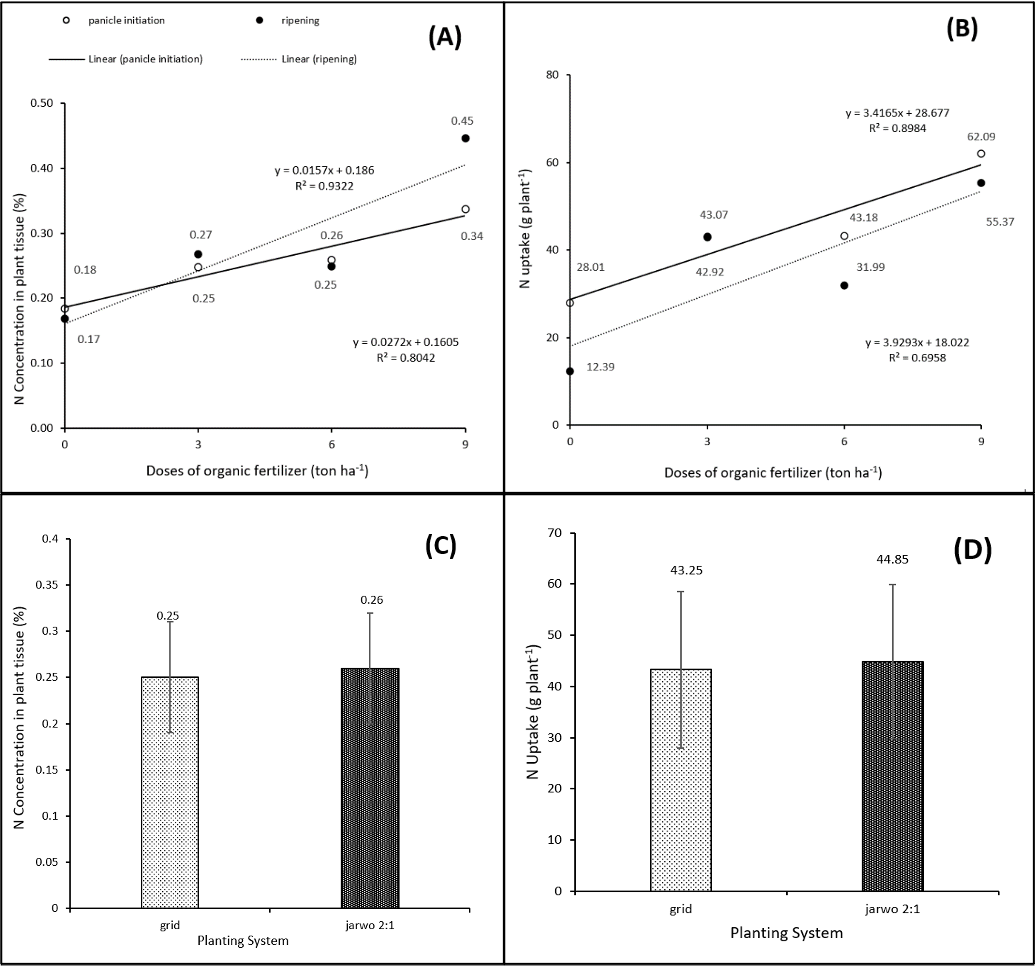
Nitrogen concentration (a) in plant tissue and Nitrogen uptake (b) at different doses of organic fertilizer. Nitrogen concentration (c) in plant tissue and Nitrogen uptake (d) at different cropping systems. Error bars represent standard deviation. Arrows of continuous and dotted lines show the trend between doses of organic fertilizer and NPK in whole plant.

