

Testosterone Enanthate Induces Cell Death in Human Colon (HCT) and Gastric (AGS) Cancer Cells


Testosterone Enanthate Induces Cell Death in Human Colon (HCT) and Gastric (AGS) Cancer Cells
Neda Amani1, Mehrdad Shariati1, Rahim Ahmadi2,3*, Mokhtar Mokhtari1 and Saeed Khatamsaz1
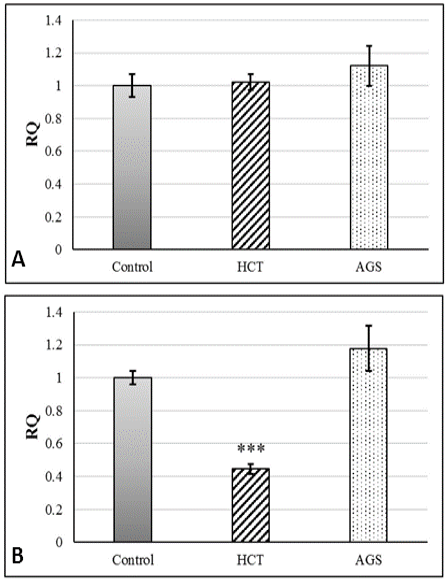
Partial expression level (RQ) of iNOS (A) and MMP9 (B) in HCT and AGS cells exposed to cytotoxic concentration of testosterone enanthate compared with control group.

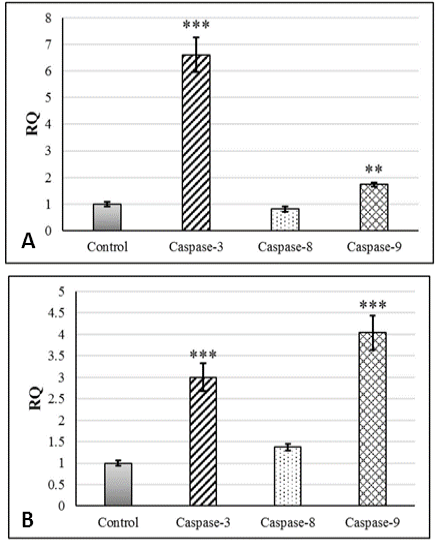
Partial expression level (RQ) of caspase-3, -8 and -9 in AGS cells (A) and HCT cells (B) exposed to cytotoxic concentration of testosterone enanthate compared with control group. *** and ** represent significant difference compared to control group (***: P<0.001, **: P<0.01).
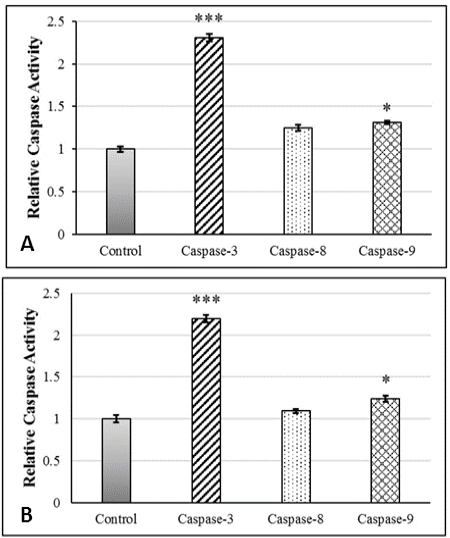
Activity level of caspase-3, -8 and -9 in AGS cells (A) and HCT cells (B) exposed to cytotoxic concentration of testosterone enanthate compared with control group. *** and * represent significent difference compared to control group. (***: P<0.001 and *: P<0.05).
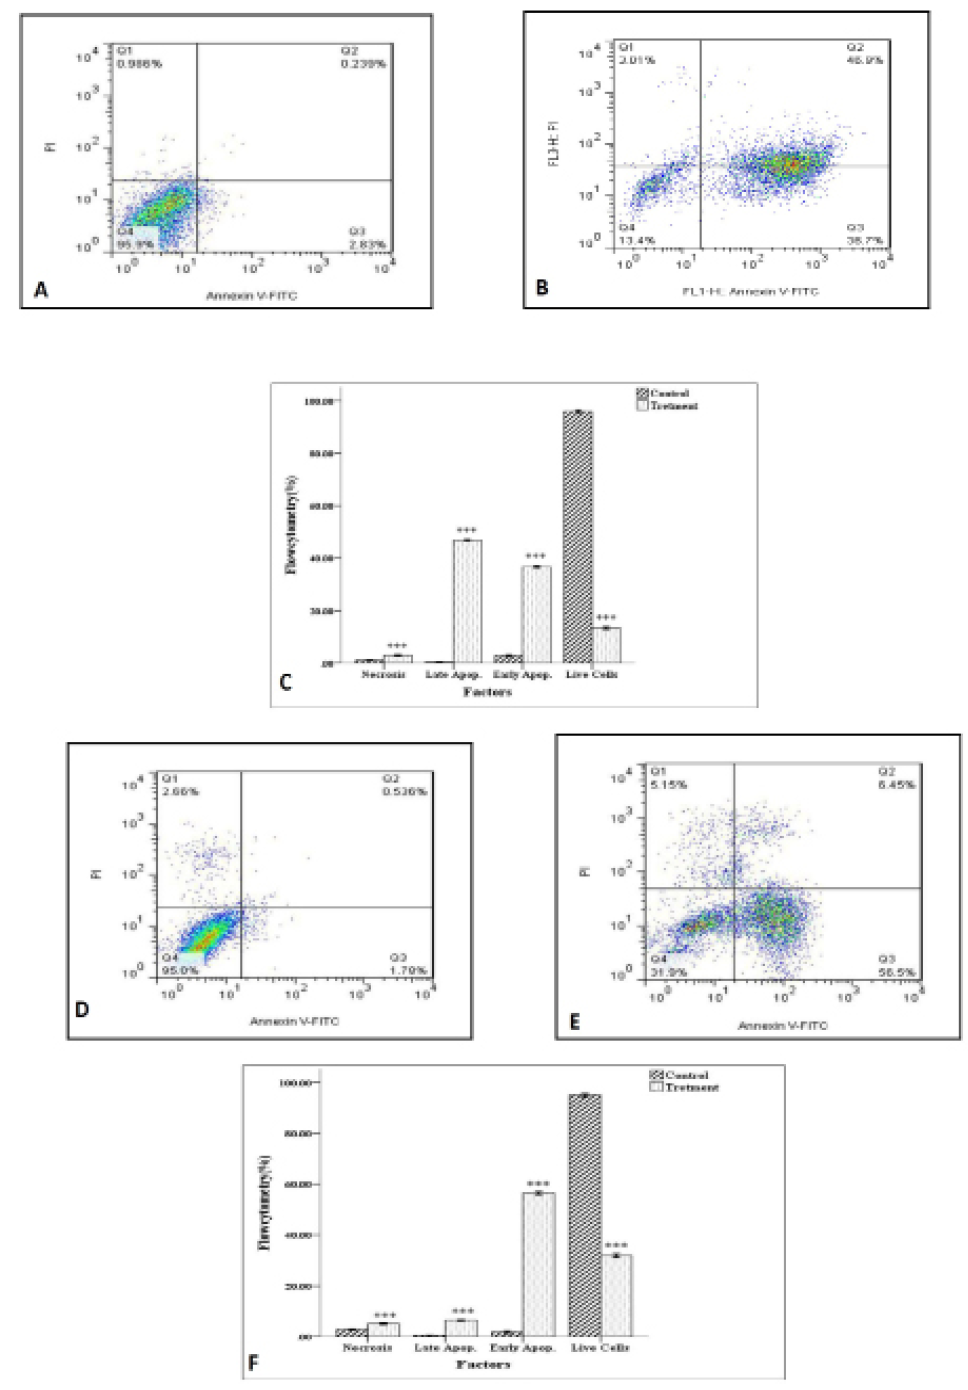
Apoptosis in AGS and HCT cell lines induced by testosterone enanthate: Q1, Necrosis; Q2, Late apoptosis; Q3, Early apoptosis; Q4, Viable cells. (A) Control AGS cells; (B) AGS cells treated with testosterone; (C) Necrosis, early and late apoptosis and live cells in control and testosterone treated AGS cells; (D) Control HCT cells; (E) HCT cells treated with testosterone enanthate and (F) Necrosis, Early and late apoptosis and live cells in control and testosterone treated HCT cells. Percentage of apoptotsis increased in treated cells compared with control groups. The analysis was done by FACSDiva version 6.1.3. *** represents significant difference compared to control group (***P<0.001).
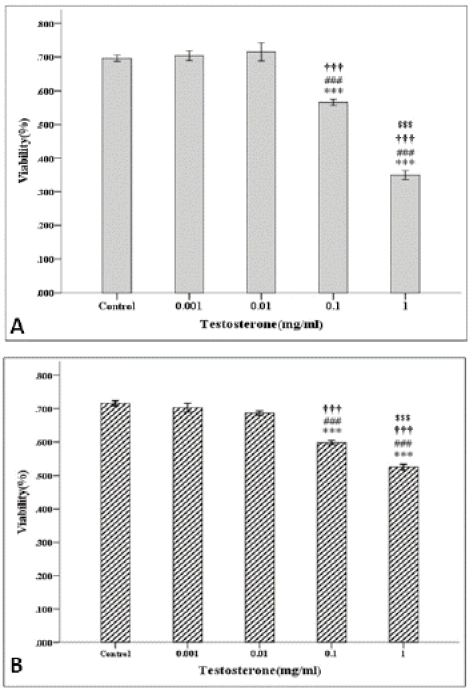
Viability of AGS (A) and HCT (B) cells exposed to 0.001, 0.1, 1 and 10 mg/ml of testosterone enanthate. *, #, † and $ indicate significant ddifference compared with control, and groups exposed to 0.001, 0.01, 0.1 and 1 mg/ml of testosterone, respectively. (***, P<0.001; ###, P<0.001; †††, P<0.001 and $$$, P<0.001).

