

The Exploration of Beijing Fatty Chicken Amniotic Fluid Stem Cells with Multilineage Potential


The Exploration of Beijing Fatty Chicken Amniotic Fluid Stem Cells with Multilineage Potential
Mingming Ning1,2, Yanjie Zheng1, Yuanyuan Dun1, Weijun Guan2 and Xiuxia Li1,*
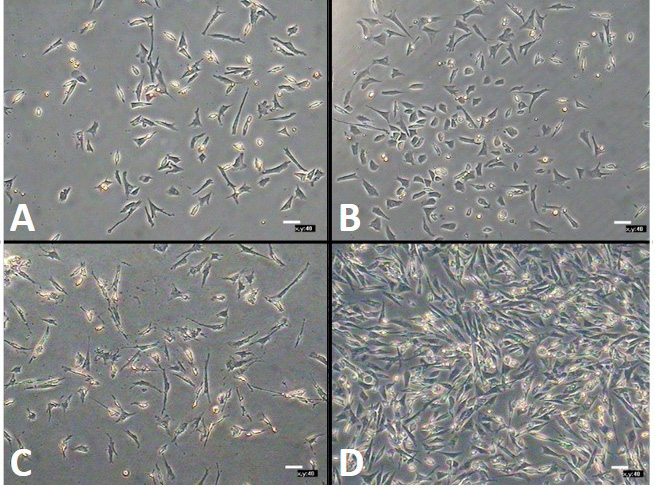
CAFSCs morphology comparison of complete medium with and without adding chicken serum. A, cell morphological of CAFSCs without adding chicken serum culture in 24 h; B, cell morphological of CAFSCs with adding chicken serum (5%) culture in 24 h. Few differences have been found between A and B; C, cell morphological of CAFSCs without adding chicken serum culture in 72 h; D, cell morphological of CAFSCs with adding chicken serum (5%) culture in 72 h,cell number and morphology are better compared with C. Sparklets are hemocytes which come from matrix and will disappear after passage.
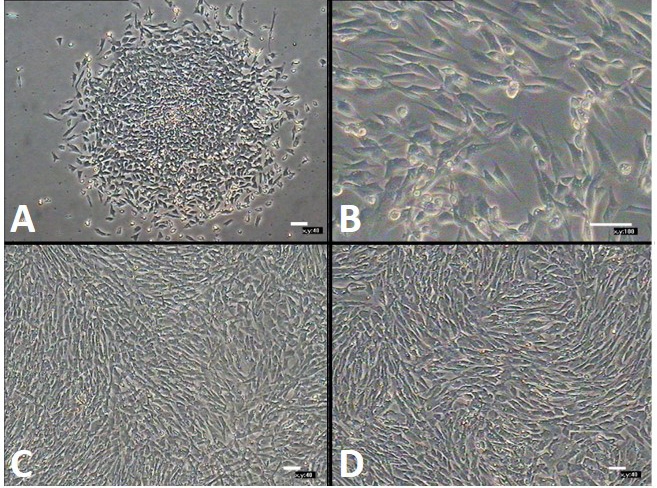
Morphology observation of CAFSCs subculture. A, nest clone that cultured for 24 h, cells are more toward the center more densely populated, which show a strong proliferation ability; B, nest clone has been passaged and cells evenly distribute, cell morphology comes to the development of fibrosis, strong refraction, full cells, and stronger stereo sense; C, P8 of CAFSCs before passage, which cells grew densely; D, P20 of CAFSCs after passage for 1 d.
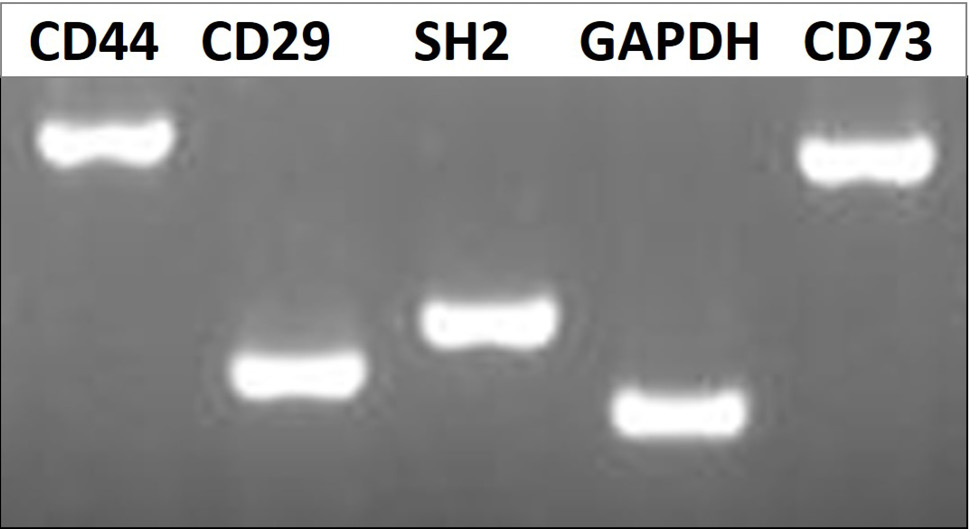
RT-PCR detection of CAFSCs. Genes CD44, CD29, CD73, SH2 are detected positive with RT-PCR. We use GAPDH as internal control.

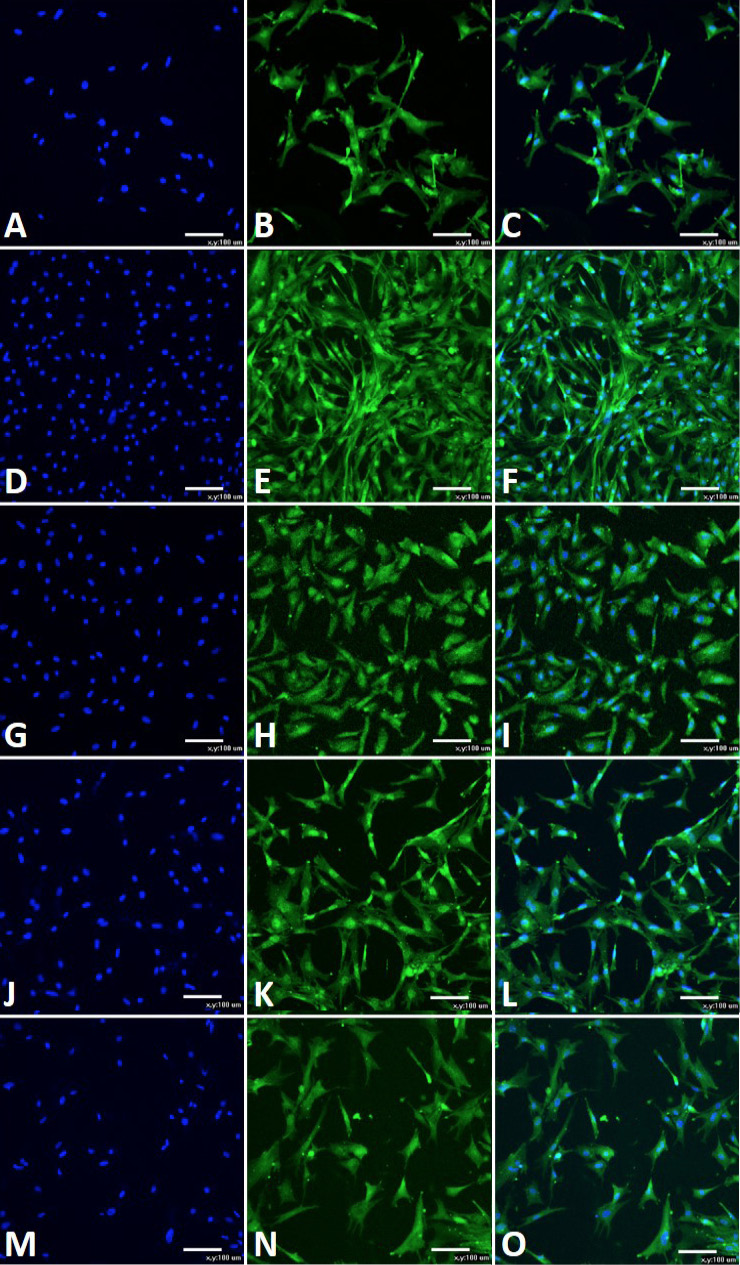
Immunofluorescence histochemical detection of CAFSCs. Cell surface markers Oct-4, CD105, nanog, CD73 and SSEA-4 are detected positive with immunofluorescence histochemistry on LSCM. A, D, G, J and M, nuclei is stained by DAPI; B, Oct-4+; E, CD105+; H, nanog+; K, CD73+; N, SSEA-4+; C, F, I, L and O, Merged.
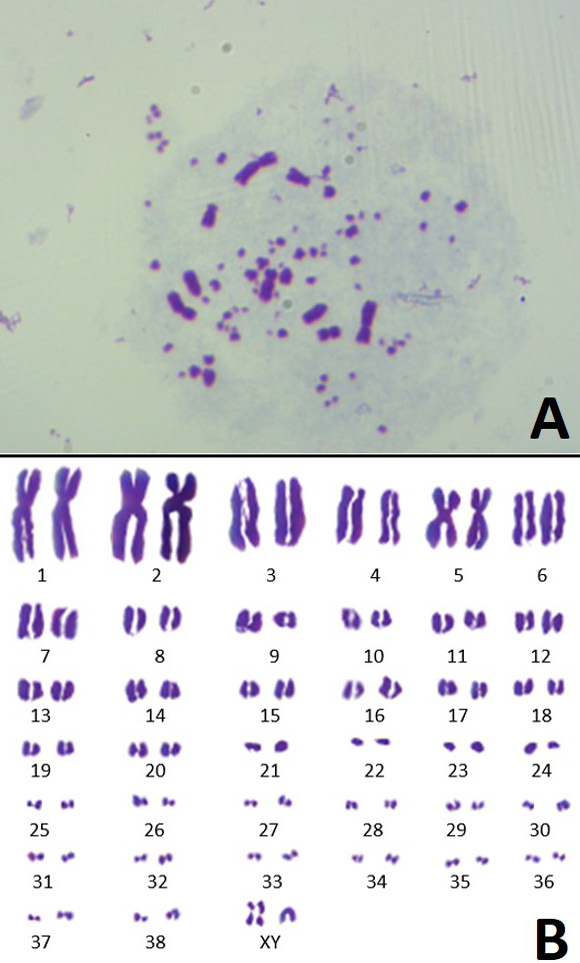
Karyotype analysis of CAFSCs. A, chromosome doubling in mitosis anaphase under microscope; B, each pair of chromosomes after arrangement, a total of 38 to autosomal and a pair of sex chromosomes.
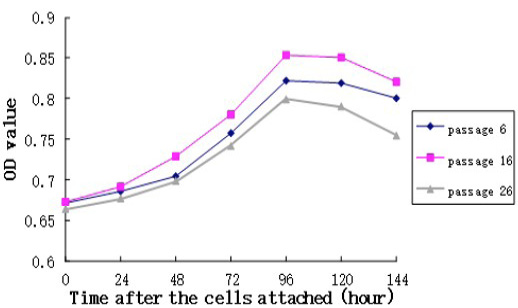
Growth curve of CAFSCs. Incubation phase (0-48 h), exponental phase (48-96 h), stationary phase (96-120 h) and apoptosis phase (120-144 h) are displayed clearly. P16 CAFSCs proliferation capability is stronger than P6 and P26.
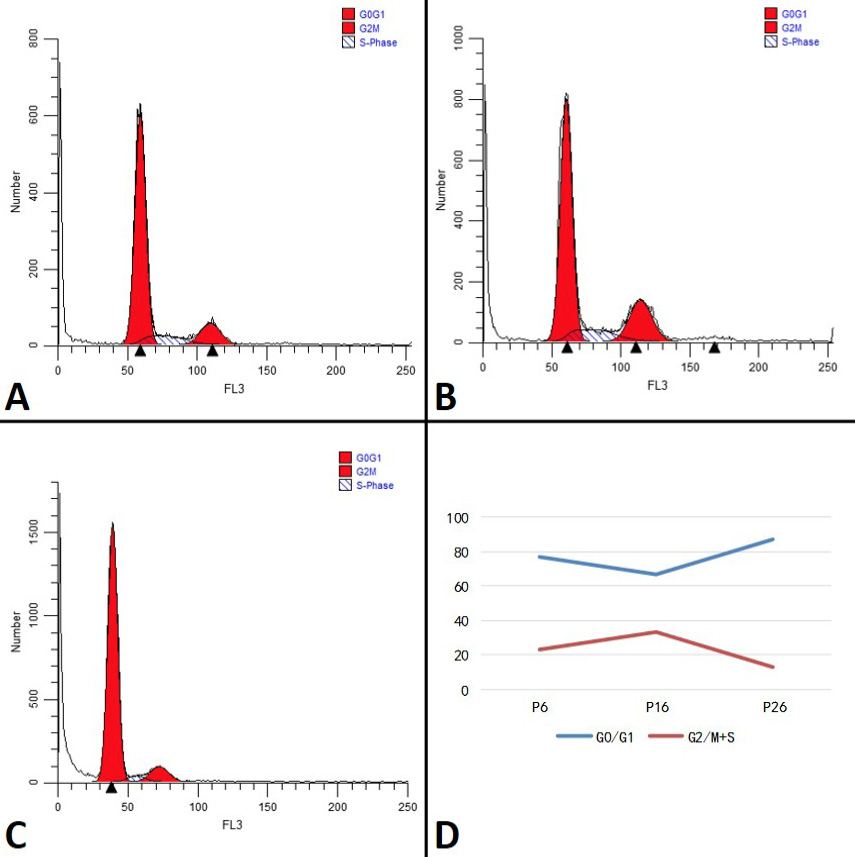
Examination of cell cycle. A, cell quantities that lie in G0/G1, S and G2/M of P6 CAFSCs, respectively; B, cell quantities that lie in G0/G1, S and G2/M of P16 CAFSCs, respectively; C, cell quantities that lie in G0/G1, S and G2/M of P26 CAFSCs, respectively; D, line chart of G0/G1 and G2/M+S statistics. S phase represent DNA replication stage, G2/M represent cell division stage, G2/M+S can reflect cell proliferation vigor.
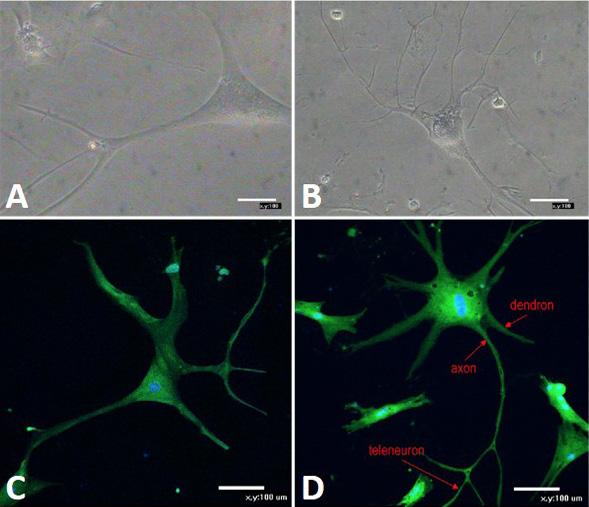
Neuron induced differentiation of CAFSCs in vitro. A and B, morphology observation of induced cells under inverted microscope, dendron and axon emerge and grow mature after culture for 15 days; C, neuron specific marker NSE is detected positive by immunofluorescence histochemistry; D, neuron specific marker nestin is detected positive too. Red arrow stamp axon, dendron and teleneuron, respectively which are typical morphological markers of neuron.
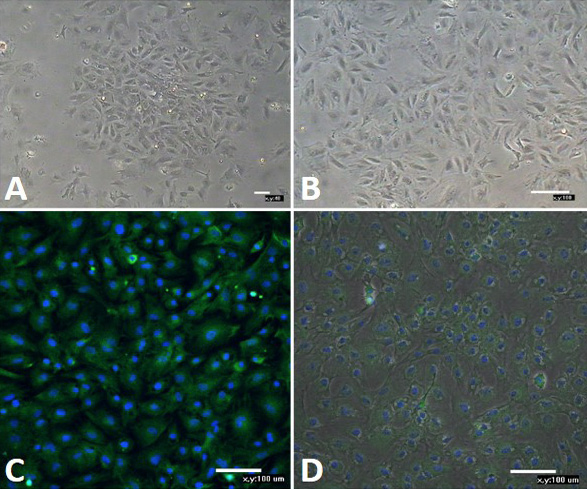
Epithelium induced differentiation of CAFSCs in vitro. A and B, morphology observation of induced cells under inverted microscope, cell morphology change from spindle to typically round or irregularly shaped after 12 days; C, Epithelium specific marker aquaporin-5 is detected positive by immunofluorescence histochemistry; D, Epithelium specific marker CK18 is detected positive too.

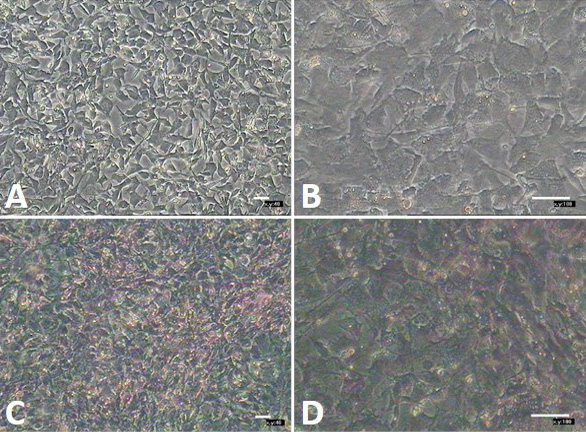
Hepatocyte induced differentiation of CAFSCs in vitro. A and B, morphology observation of induced cells under inverted microscope, cells present polygonal and foliated after culture for 12 d; C and D, Glycogenosome present amaranth by glycogen staining. This can prove that high-passaged CAFSCs (P25) still maintain induced differentiation potential.
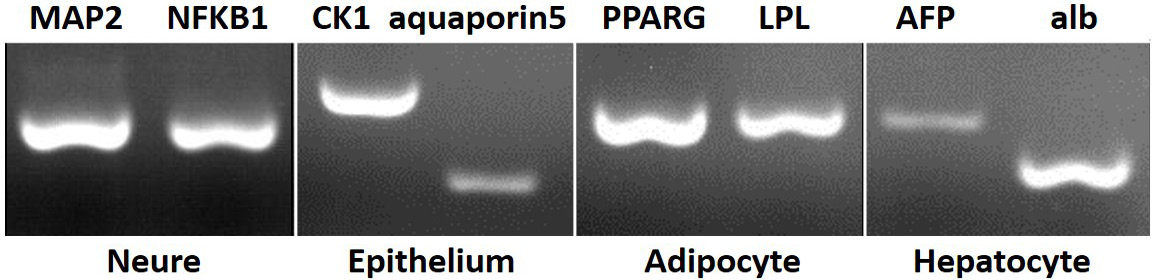
RT-PCR detection of induced cells in vitro. Respective specific markers of neure (MAP2 ,NFKB1), epithelium (CK1, aquaporin5), adipocyte (PPARG, LPL) and hepatocyte(AFP, alb) are detected positive, which can further confirms the success of induction for CAFSCs in vitro.
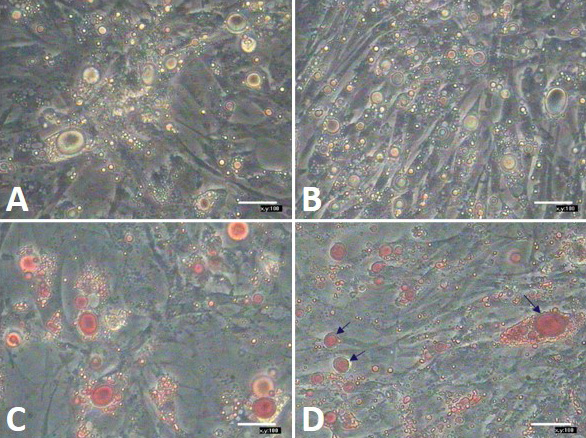
Adipocyte induced differentiation of CAFSCs in vitro. A and B, morphology observation of induced cells under inverted microscope, lipid droplet become brighter after culture for 20 d; C and D, lipid droplet present orange red after oil red O staining. Blue arrow stamp lipid droplet, which is typical morphological marker of adipocyte.


