

Analysis of Shisha Smoking Effect on Haematological Indices in Adult Smokers


Analysis of Shisha Smoking Effect on Haematological Indices in Adult Smokers
Muhammad Hassan Naseem1, Muhammad Mansha1*, Muhammad Triq1 and Peter C. Thomson2

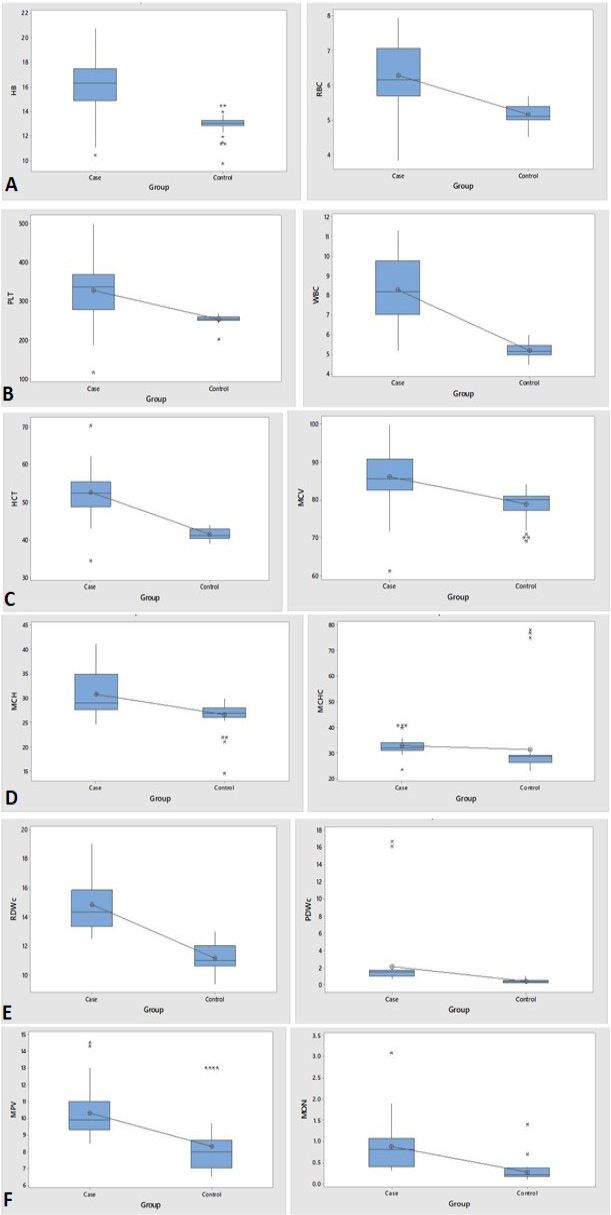
Fig. 1.
Boxplot showing distribution of HB and RBCs (A), PLT and WBC (B), HCT and MCV (C), MCH and NCHC (D), RDWC and PDWC (E) and MPV and MON (F) of case and control group. A boxplot shows 5 values in addition to mean value in the center of the box (that has been shown with a dot). Among five values, it covers minimum and maximum values along with box in the middle which contains lower quartile (Q1), Median and upper quartile (Q3). Asterisk in the boxplot indicates extreme lowest/highest values. In terms of variation, case group contains higher variation within respective values as compared to control group.
December 2022
Vol. 54, Iss. 6, Pages 2501-3000

