

Biological Characterization and Pluripotent Identification of Cartilage Stem/Progenitor from Peking Duck


Biological Characterization and Pluripotent Identification of Cartilage Stem/Progenitor from Peking Duck
Xibin Liu1,2,3, Weijun Guan2,* and Dong Zheng1,*
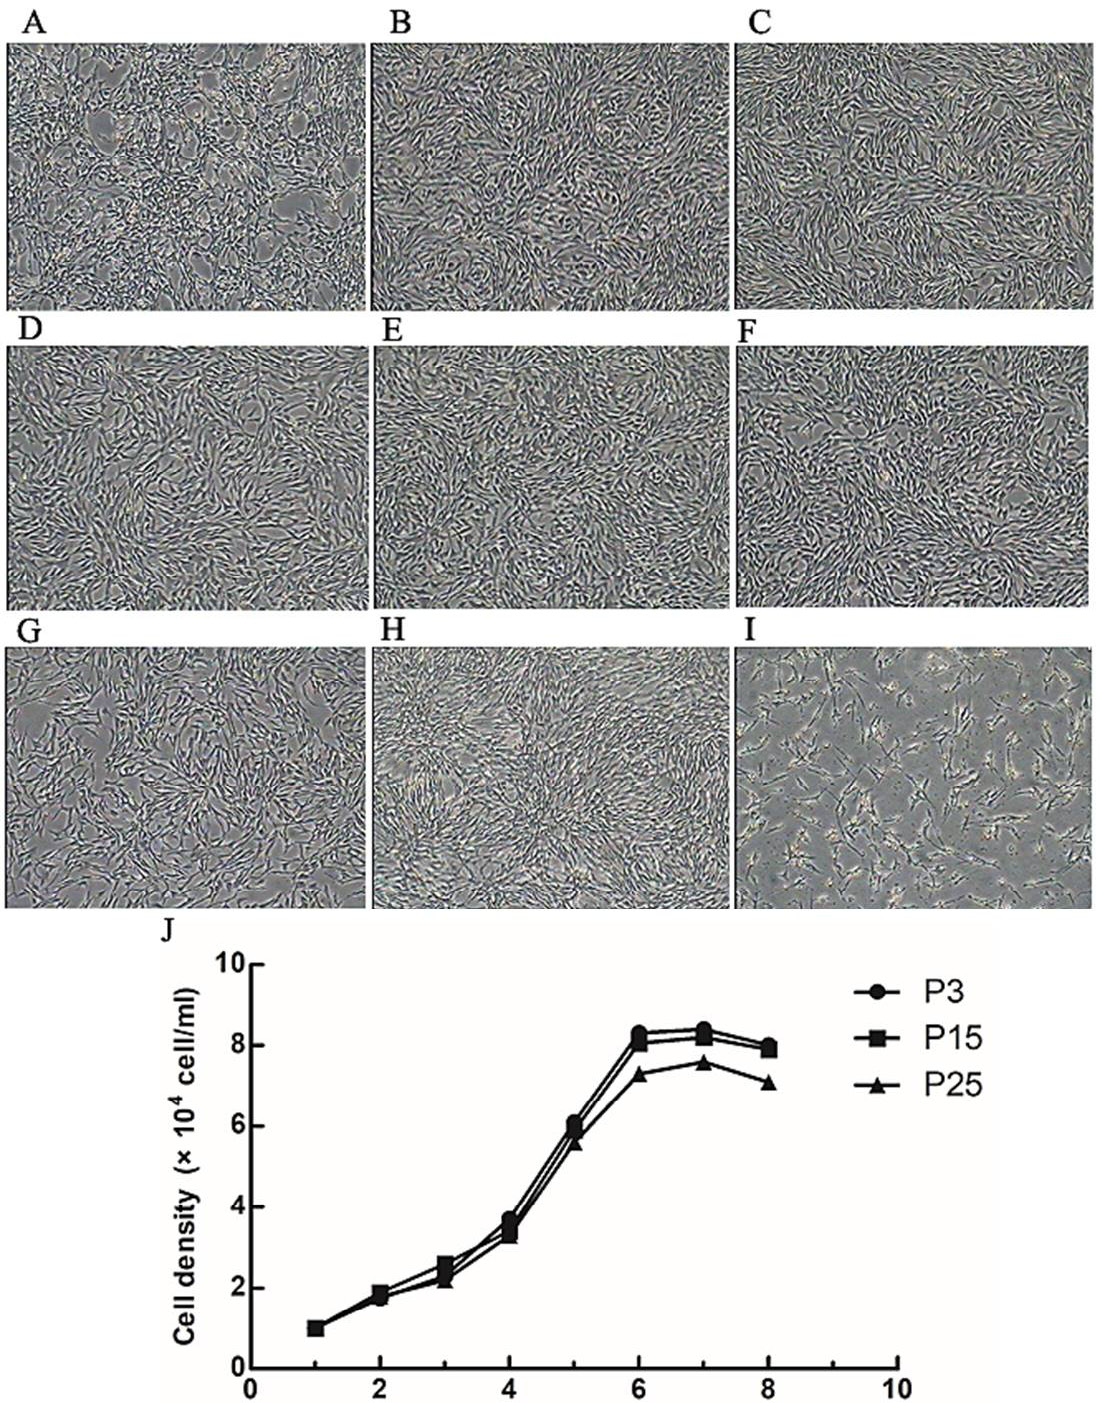
Morphology of primary cultured and sub-cultured CPSCs. A–I, representative cellular morphologies of CPSCs from passage 0, 1, 3, 5, 10, 15, 20, and 25, respectively (40×). J, the growth curves of CPSCs from P3, P15, and P25 were all typically sigmoidal; the cell density is reflected by the vertical axis. The growth curves consist of the latent period, logarithmic period, stable period, and decline period. The population doubling times (PDTs) during the logarithmic, stable, and decline periods were about 39.66 ± 9.11 h, 40.38 ± 8.89 h, and 43.06 ± 8.84 h, respectively.

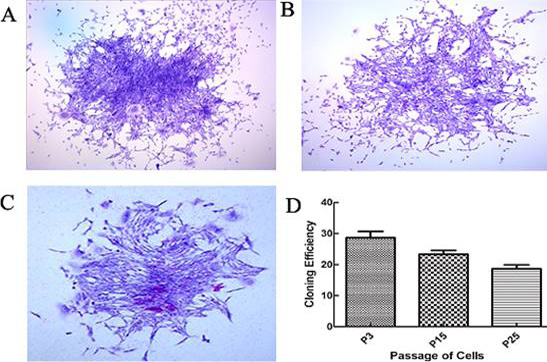
Cloning efficiency of CPSCs. A–C, morphology of colonies formed by CPSCs from P3, P15, and P25 after 7 days of culture (100×). D, bar chart showing the cloning rates for CPSCs from P3, P15, P25; the colony-forming levels were 28.67 ± 2.87%, 23.33 ± 1.7%, and 18.67 ± 1.7%, respectively.

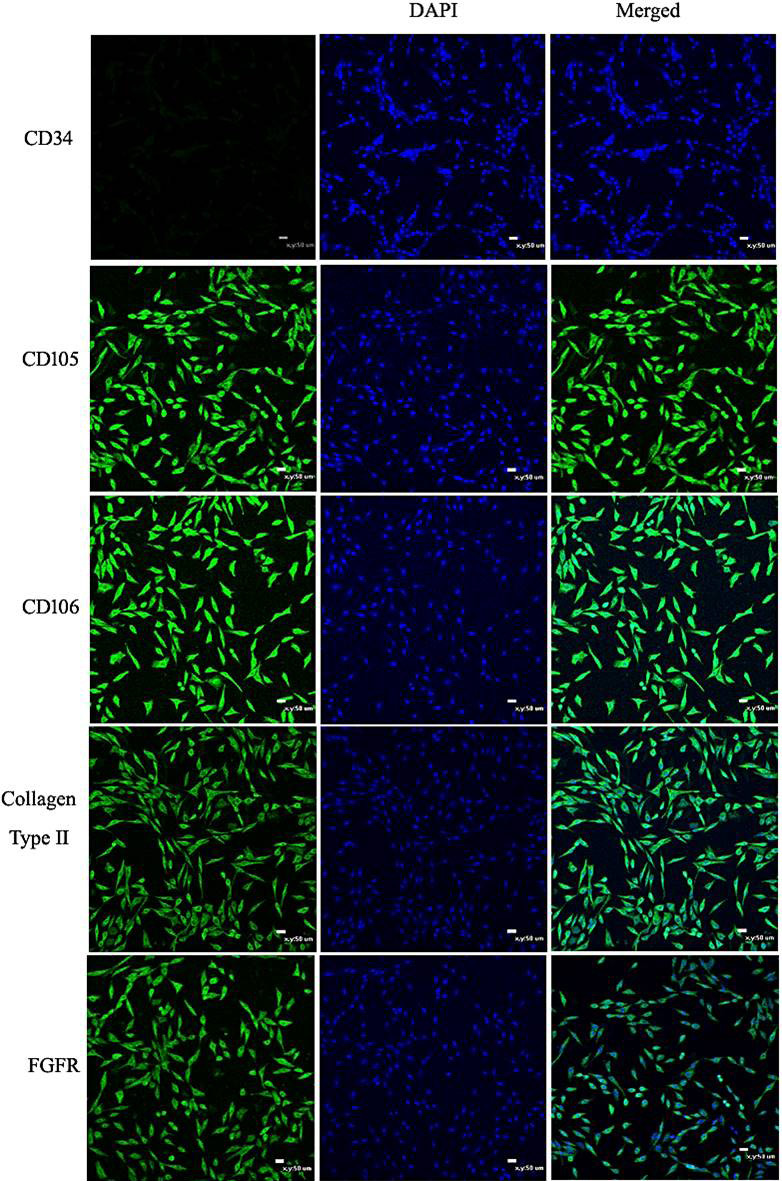
Immunofluorescence of CPSC surface markers. Cell nuclei stained with DAPI are shown in the middle panels. The pictures shown above indicate that the CPSCs positively expressed FGFR-3, collagen type II, CD105, and CD106, and negatively expressed CD34 (Scale bar = 50 μm).
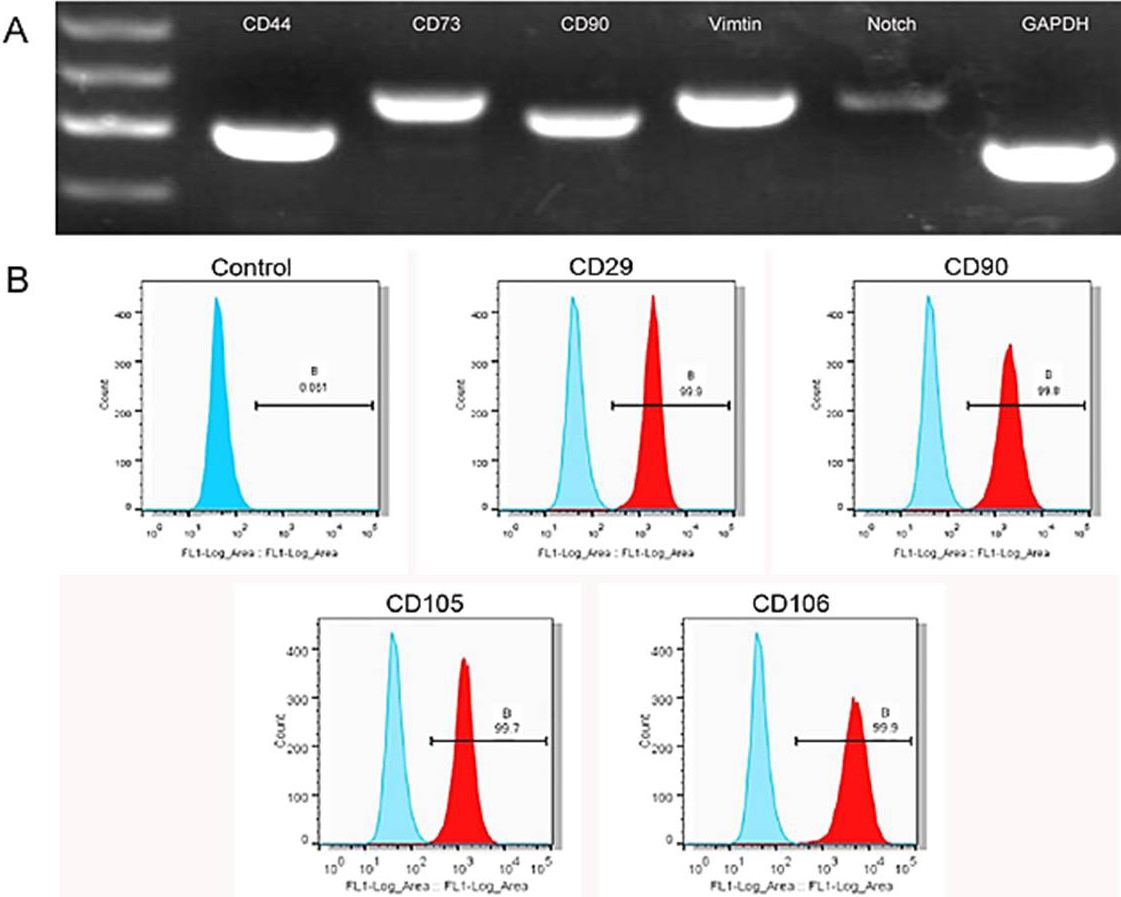
Detection of CPSC markers by RT-PCR. A, the image shows the expression levels of CD44, CD73, CD90, Vimentin, Notch1, and GAPDH. B, detection of CPSC markers by flow cytometry. CPSCs were labelled by the markers CD29, CD90, CD105, and CD106. The positivity rates of the CPSCs for all these markers were above 99%.

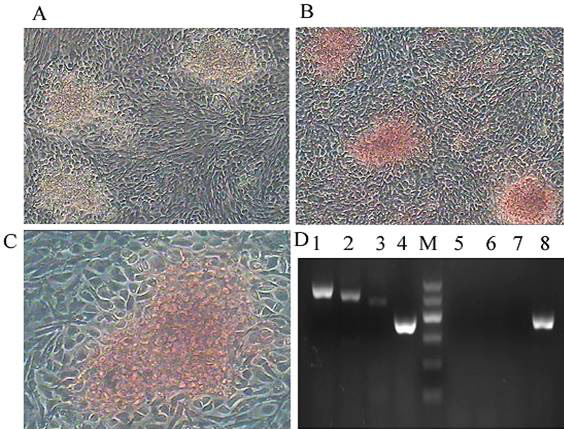
Osteogenic differentiation of CPSCs. After induction for 14 days, the morphology of the cells changed significantly, from a fusiform appearance to a larger size and more polygonal shape. A–C, the induced cells were alizarin red positive (100×). D, RT-PCR revealed the expression of the osteoblast-specific genes lane 1 OPN, lane 2 Runx2, lane 3 ALP, GAPDH (lane 4 and lane 8) in cells from the induced group, whereas these genes were not expressed in cells from the control group (lane 5-7). GAPDH served as the internal control.

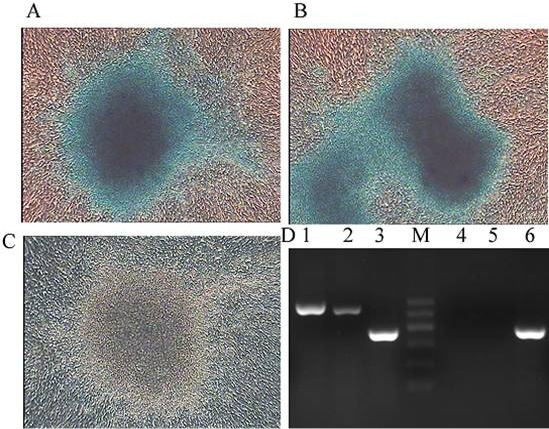
Chondrogenic differentiation of CPSCs. After induction for 15 days, the cells in some areas aggregate to form clusters, and become larger. A–C, the induced cells were alcian blue positive. (100×) D RT-PCR revealed the expression of the chondrocyte-specific genes lane 1 Vimentin and lane 2 ACAN in cells from the induced group, whereas these genes were not expressed in cells from the control group (lane 4-5). GAPDH (lane 3 and Lane 6) served as the internal control.

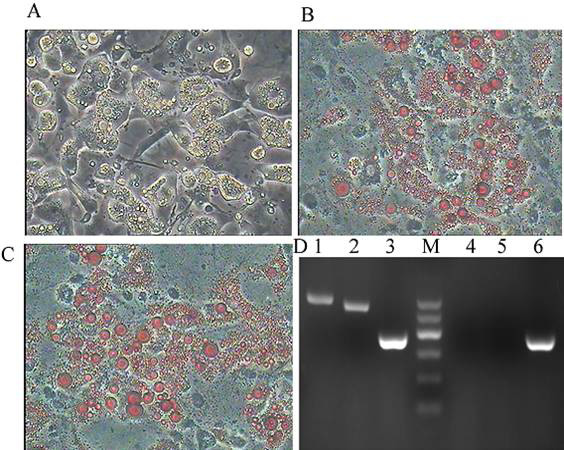
Adipogenic differentiation of CPSCs. After induction for 15 days, many big bright lipid droplets were observed in the cells. A–C, The induced cells were oil red O positive (100 ×). D, RT-PCR revealed the expression of the adipocyte-specific genes lane 1 LPL and lane 2 PPARγ in cells from the induced group, whereas these genes were not expressed in cells from the control group (lane 4 and 5). GAPDH served as the internal control (lane 3 and 6).

