

Effect of a Traditional Chinese Medicine Formula (Bu Shen Zhu Yun) on Mifepristone-Induced Abnormal Pituitary Gonadotropin Secretion in Rats


Effect of a Traditional Chinese Medicine Formula (Bu Shen Zhu Yun) on Mifepristone-Induced Abnormal Pituitary Gonadotropin Secretion in Rats
Zhen-li Li1,2, Hui-fang Zhou2,*, Bo-ru Zhou2, Bei Liu2, Xiao-fei Jiang2 and Jian-ya Xu2

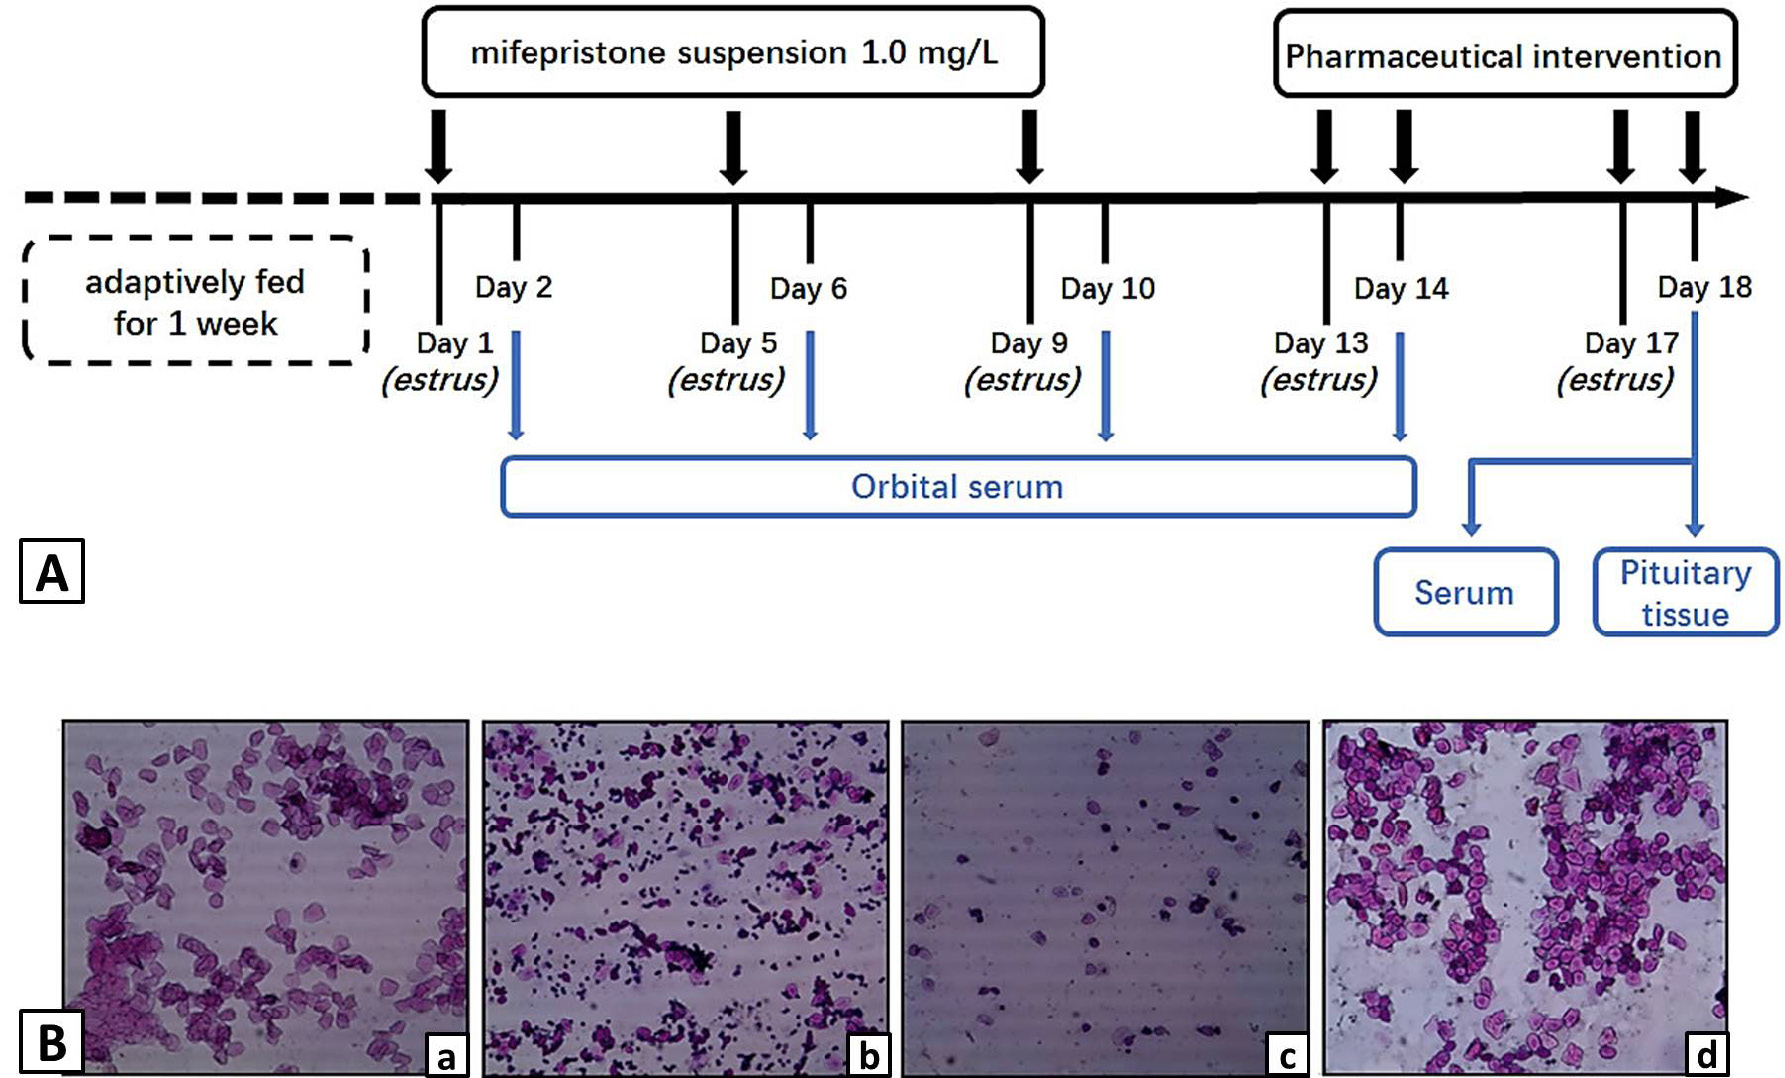
The feeding, medication, and sampling procedures of Rats. A, experimental protocol for model establishment and challenge as described in Section 2. B, differences in rat vaginal smears during four periods of the rat sexual cycle (HE, Χ100). a, estrus; b, metestrus; c, diestrus; d, proestrus.
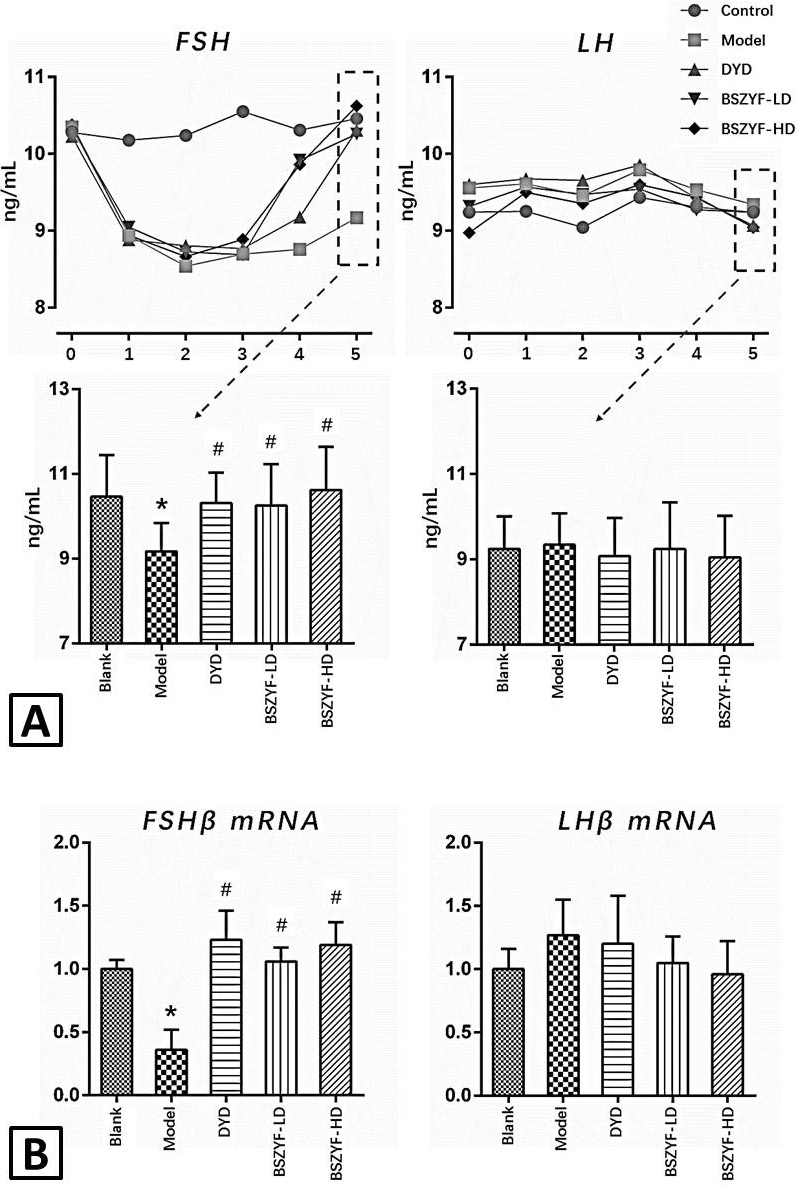
FSH and LH levels in the serum and mRNA expression in pituitary. A, serum samples were collected from five groups during the treatment phase (D2, D6, D10, D14, D18) and once before medication as a baseline value. All sampling times were during the metestrus stage of each cycle. Mifepristone downregulated the level of FSH. However, following treatment with Bu Shen Zhu Yun formula (BSZYF), FSH levels ìncreased to the level of the blank group. There were no significant differences in LH levels between the groups. The levels of FSH and LH in the serum were measured by ELISA; B, differences in FSHβ and LHβ mRNA expression in the anterior pituitary tissue were similar to differences in serum levels. Values are represented as mean ± SD (n=6 per group), *P<0.05 compared with the blank group, #P<0.05 compared with the model group.

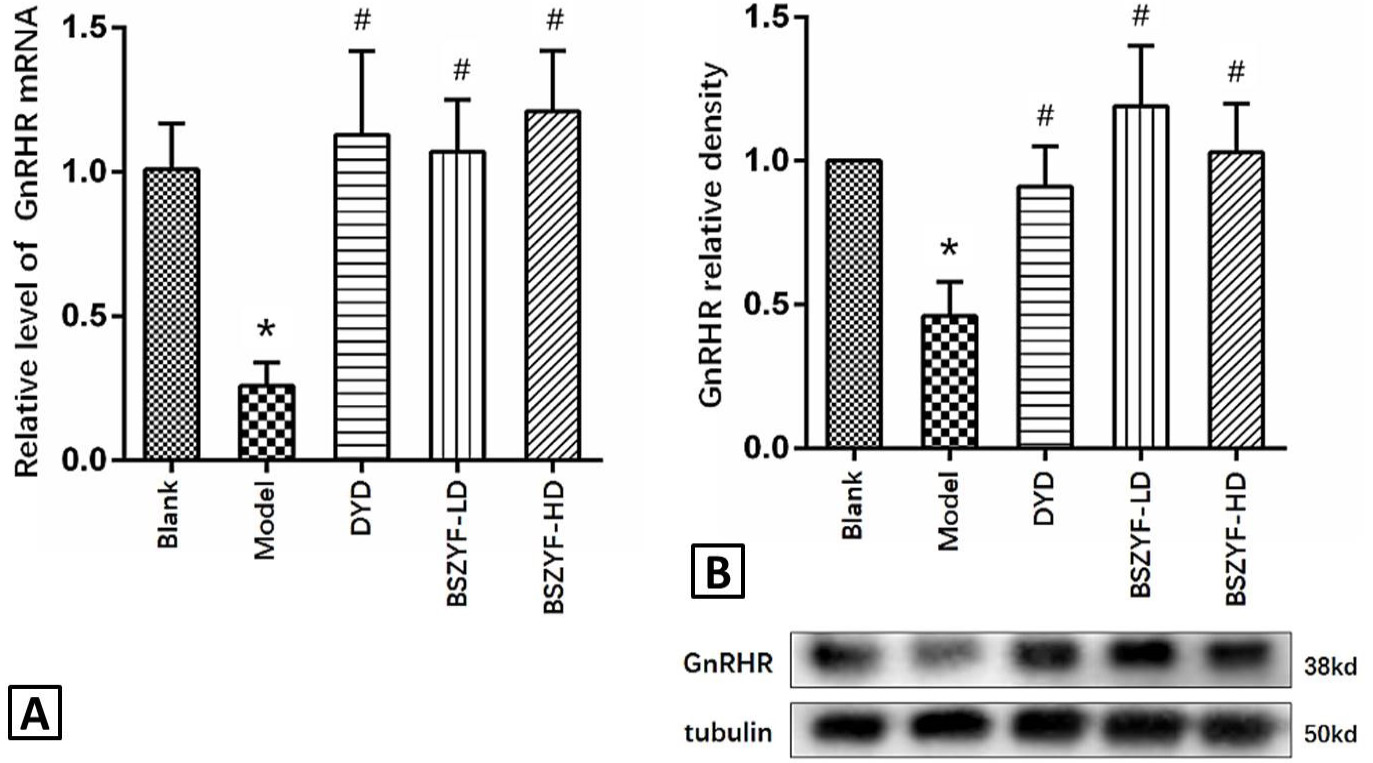
Treatment with BSZYF upregulated the expression of GnRHR in the anterior pituitary tissue. A, mRNA expression of GnRHR was analyzed by qPCR. B, Western blotting to measure the protein expression of GnRHR. The relative density was quantified relative to tubulin. Values are represented as mean±SD (n=6 per group), *P<0.05 compared with the blank group, #P<0.05 compared with the model group.
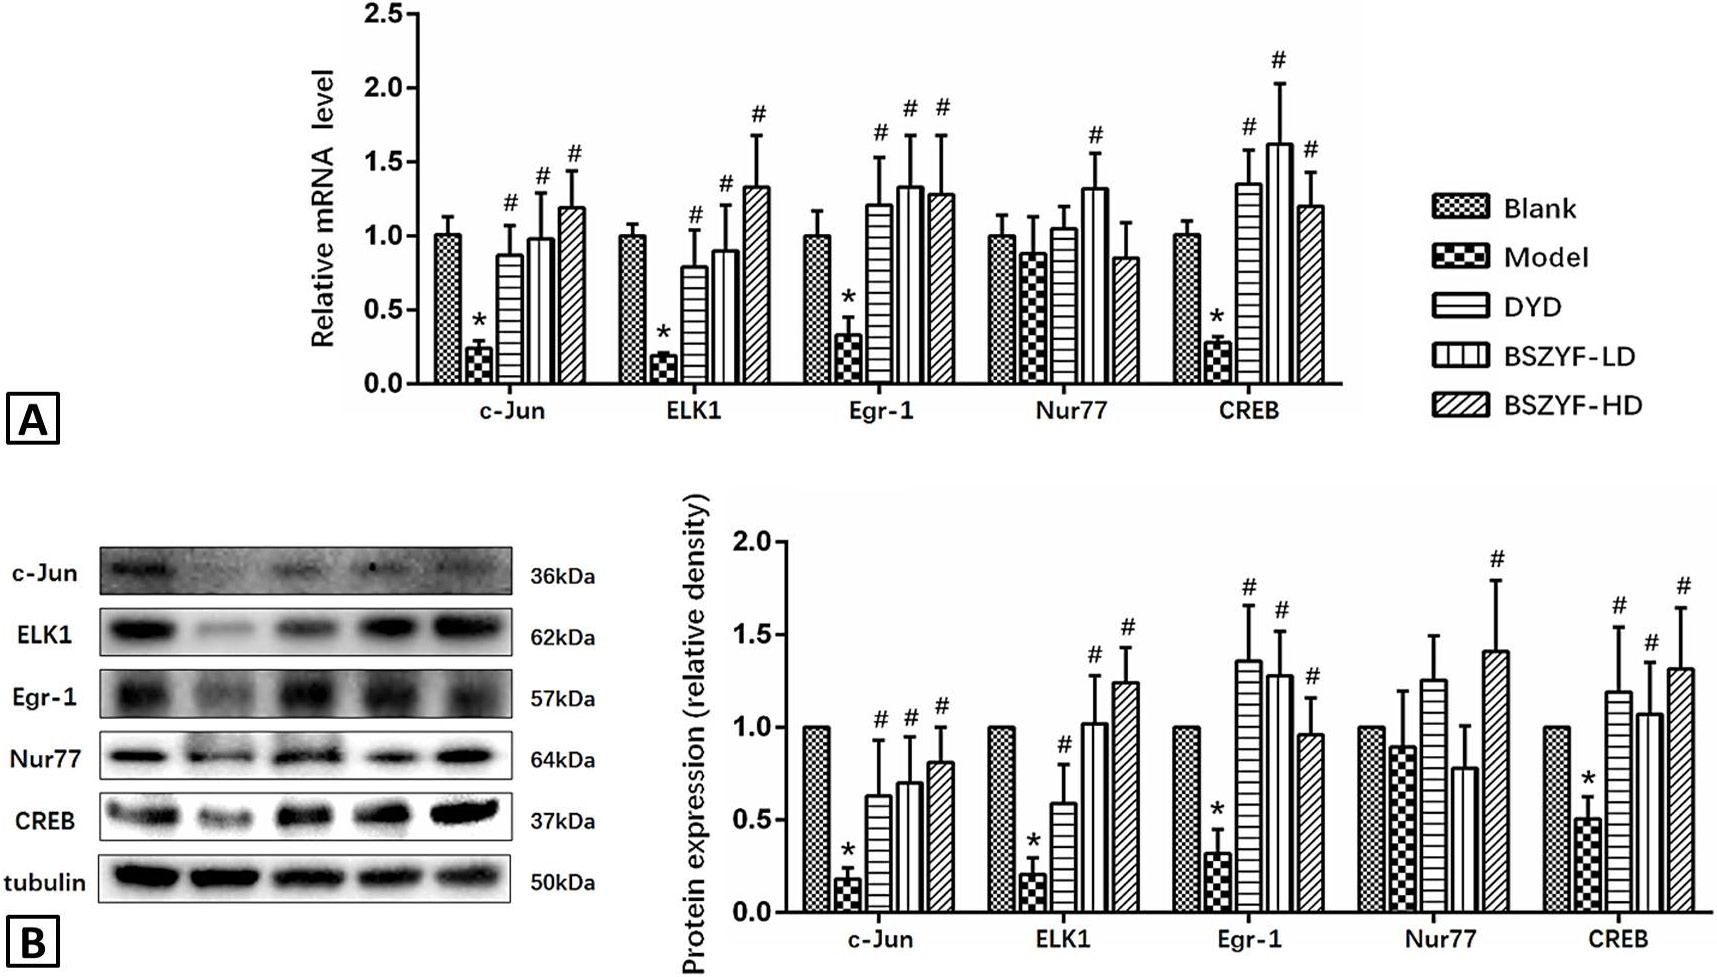
BSZYF treatment promoted the activation of transcription factors c-Jun, ELK-1, Egr-1, and CREB. A, the mRNA expression of transcription factors was analyzed by qPCR. B, Western blotting to measure the protein expression of transcription factors. The relative density was quantified relative to tubulin. Values are represented as mean±SD (n=6 per group), *P<0.05 compared with the blank group, #P<0.05 compared with the model group.

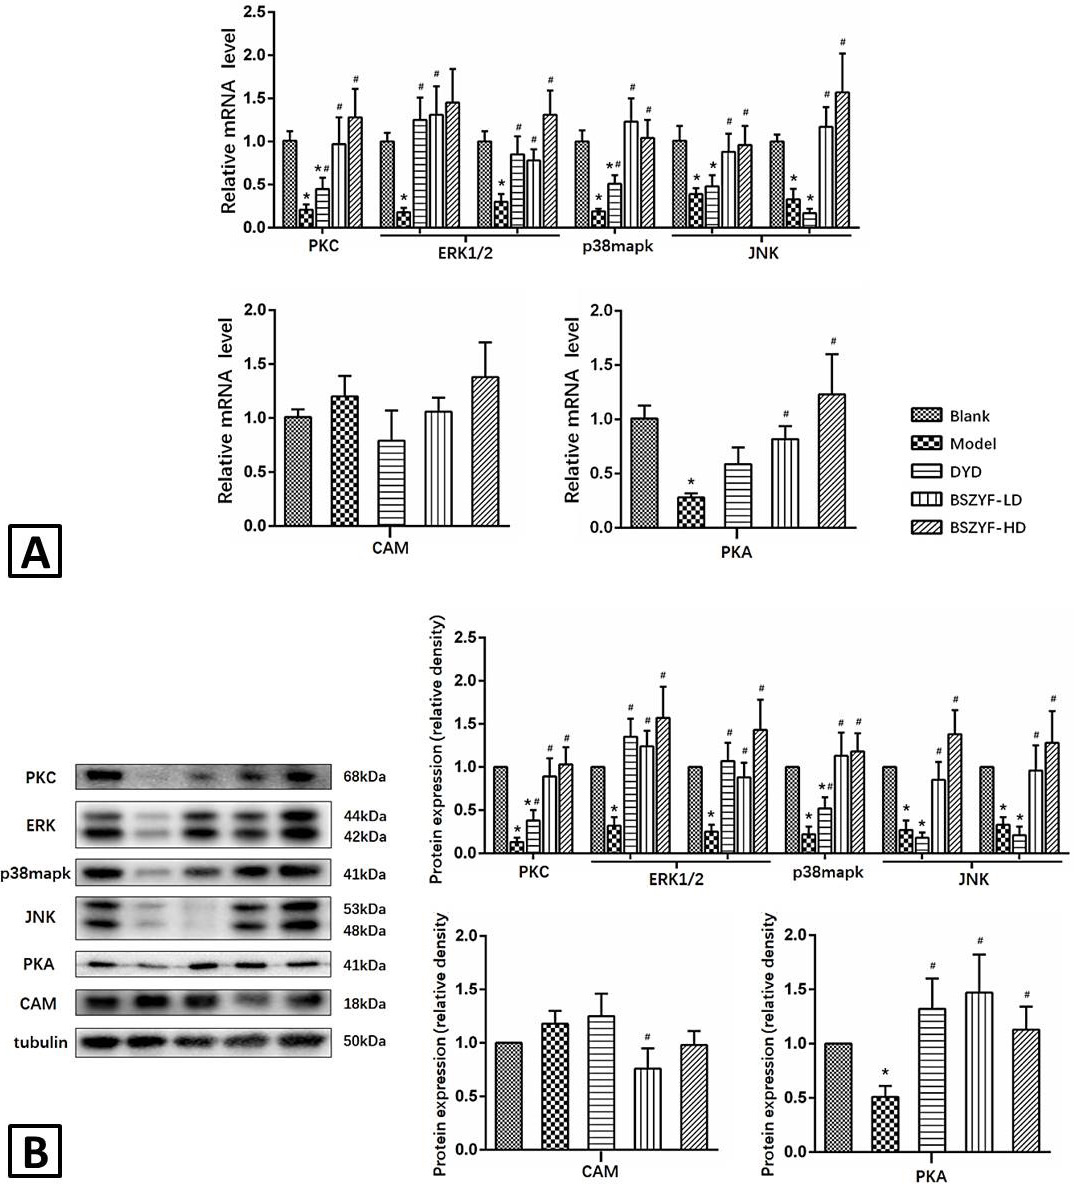
BSZYF treatment promoted the activation of PKC-MAPK and cAMP-PKA signaling pathways. A, the mRNA expression of signal transducers was analyzed by qPCR. B, Western blotting to measure the protein expression of signal transducers. The relative density was quantified relative to tubulin. Values are represented as mean±SD (n=6 per group), *P<0.05 compared with the blank group, #P<0.05 compared with the model group.

