Submit or Track your Manuscript LOG-IN

Effects of Naringenin on Cadmium-Induced Changes in Blood Physiological and Biochemical Indices and Kidney Damage Among Rats

Effects of Naringenin on Cadmium-Induced Changes in Blood Physiological and Biochemical Indices and Kidney Damage Among Rats

Lulu Ding, Ke Wang, Ruxue Huang, Wenjing Yu, Bingzhao Yan, Mengli Jiang and Jicang Wang*

College of Animal Science and Technology, Henan University of Science and Technology, No.263, Kaiyuan Avenue, 471023, Luoyang, PR China.

 
* Corresponding author: wangjicang@126.com

Fig. 1.
GSH and MDA levels assay in kidney tissues.
Rats were treated with CdCl2 and/or Nar for 4 weeks. Then, the kidney tissues were used to determine the levels of GSH (A) and MDA (B). All measurement results were expressed as mean ± standard deviation. *, indicates significant difference compared with the corresponding control (*P < 0.05). #, indicates statistically significant difference between the Cd and Cd + Nar groups (#P < 0.05).
Fig. 2.
CAT and T-SOD levels assay in kidney tissues.
Rats were treated with CdCl2 and/ or Nar for 4 weeks. Then, the kidney tissues were used to determine the levels of CAT (A) and T-SOD (B). All measurement results were expressed as mean±standard deviation. *,indicates significant difference compared with the corresponding control (*P < 0.05). #, indicates statistically significant difference between the Cd and Cd + Nar groups (#P < 0.05).
Fig. 3.

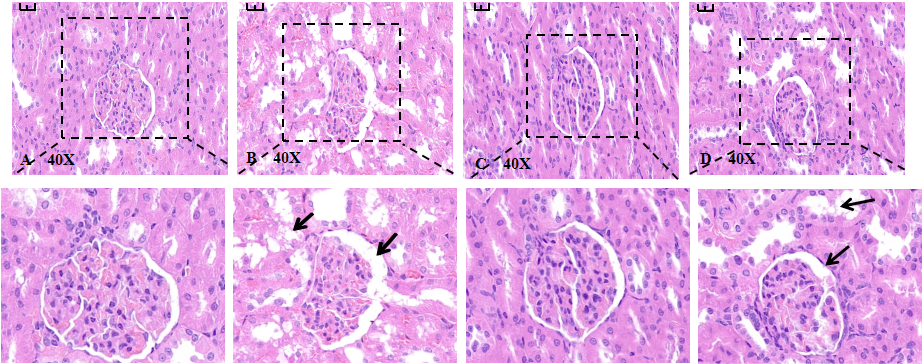
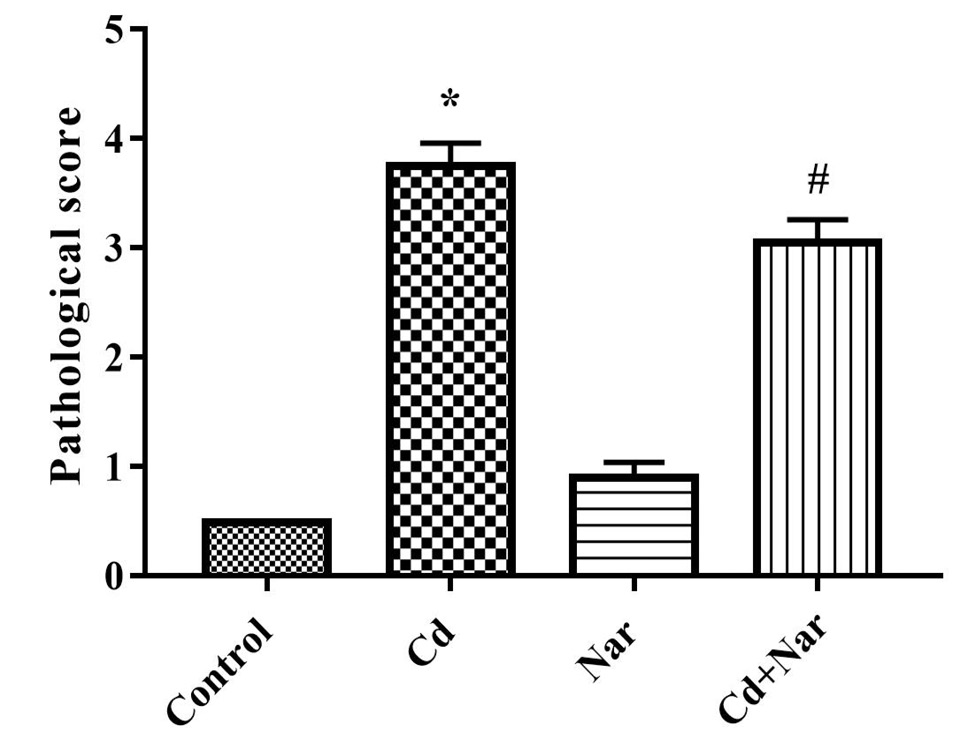
Effect of naringenin on cadmium induced kidney injury in rats (H and E, 400×, scale bar = 50 μm). Kidney sections from control rats showed normal glomerular and tubular histomorphology. In the cadmium exposure group, the glomerulus was shrunk and the tubular structure was damaged. The structural damage of glomeruli and renal tubules was alleviated in Nar and Cd co treated group. (A) control group; (B) Cd-treated group; (C) Nar-treated group; (D) Cd + Nar-treated group.

Fig. 4.

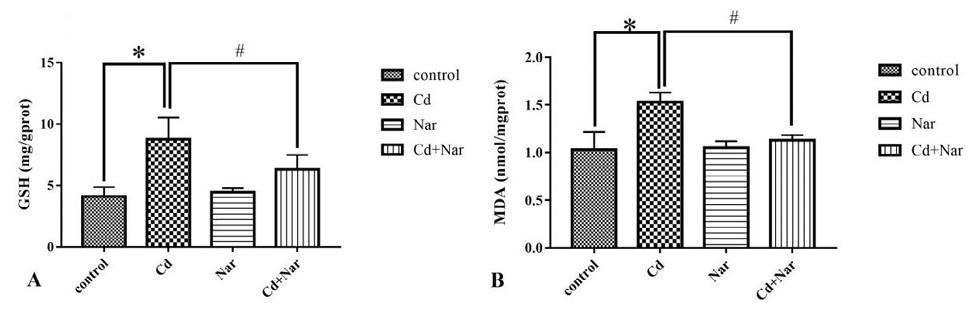
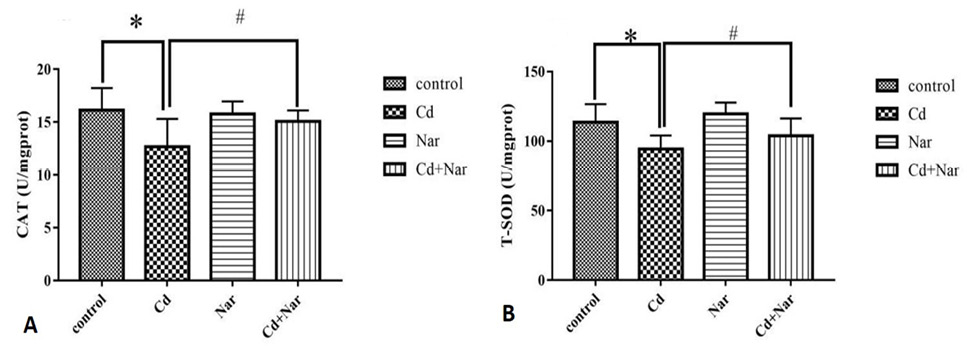
The pathological scores of kidney tissues in different treatment groups were evaluated by members of the experimental group, and three independent experiments were repeated. *, indicates significant difference compared with the corresponding control (*P < 0.05). #, indicates statistically significant difference between the Cd and Cd + Nar groups (#P < 0.05).

Pakistan Journal of Zoology

April

Pakistan J. Zool., Vol. 56, Iss. 2, pp. 503-1000

Featuring

Click here for more

Subscribe Today

Receive free updates on new articles, opportunities and benefits


Subscribe Unsubscribe