

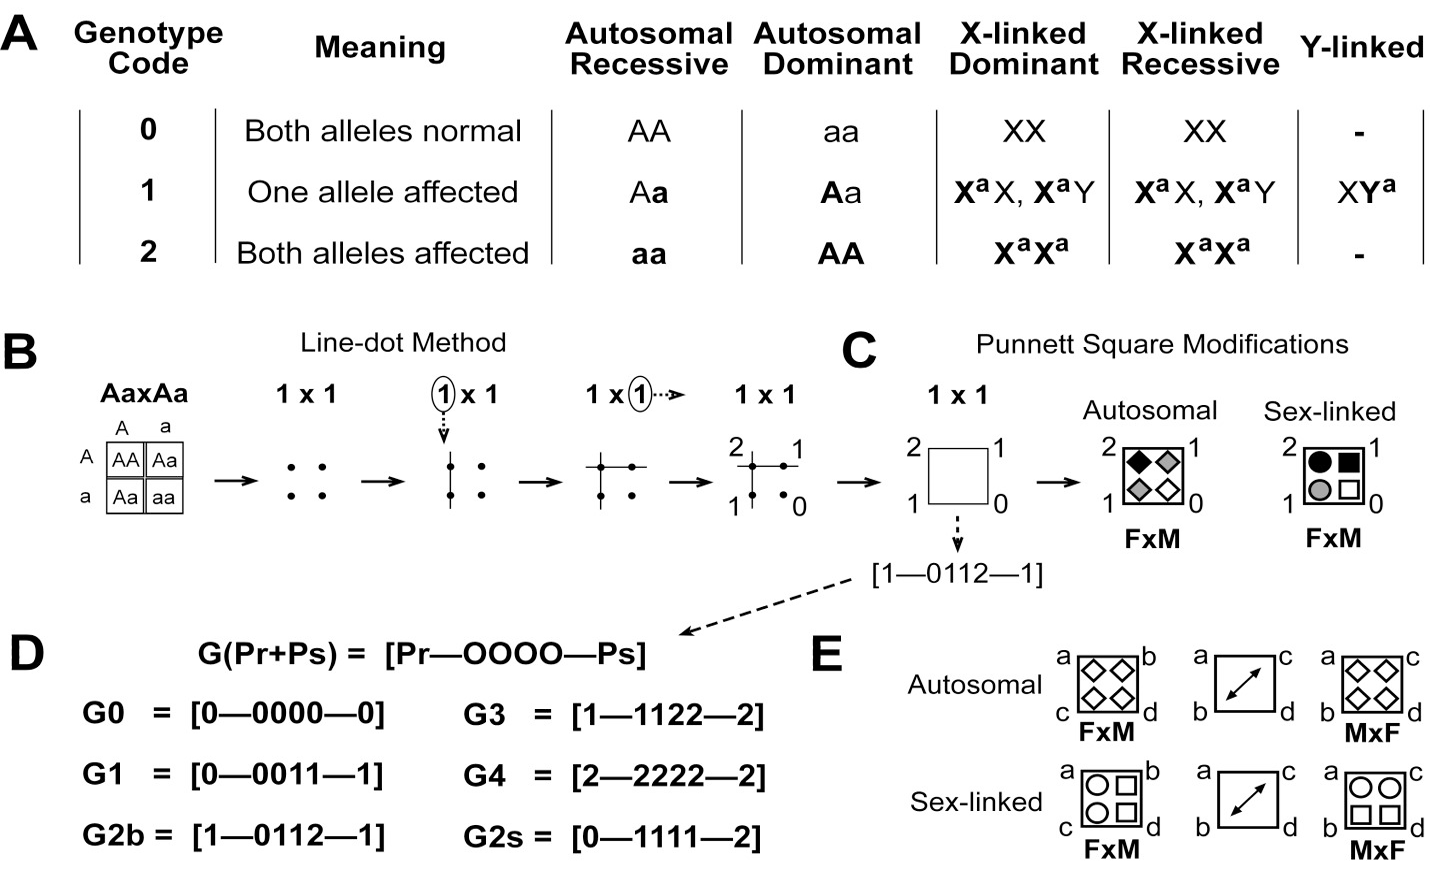
Genotype and Phenotype Probabilities by Ternary Code based Line-dot Method and Polygonal Illustrations


Genotype and Phenotype Probabilities by Ternary Code based Line-dot Method and Polygonal Illustrations
Muhammad Imran Shabbir

Overview of different approaches used. A, ternary coding for genotypes and their corresponding symbols generally used in literature. Bold symbols are affected alleles; B, line-dot method. Here, dot = 0, one line passing through a dot = 1, two lines passing through a dot = 2; C, Punnett square modifications. Unfilled symbols = normal, filled symbols = affected, light filled symbols = heterozygotes that will be affected for dominant and carrier for recessive conditions; D, ternary coded genotype probability groups. Parents’ genotype codes are on the sides and four offspring codes are in the middle. Group name is based on the total number of affected alleles (Pr and Ps) shared by parents. 2b = total of two affected alleles each allele shared by both parents, 2s = total of two affected alleles which are coming from single parent; E, diagonal shift of genotypes in autosomal and sex-linked outcomes described with diagonal pointing arrow.
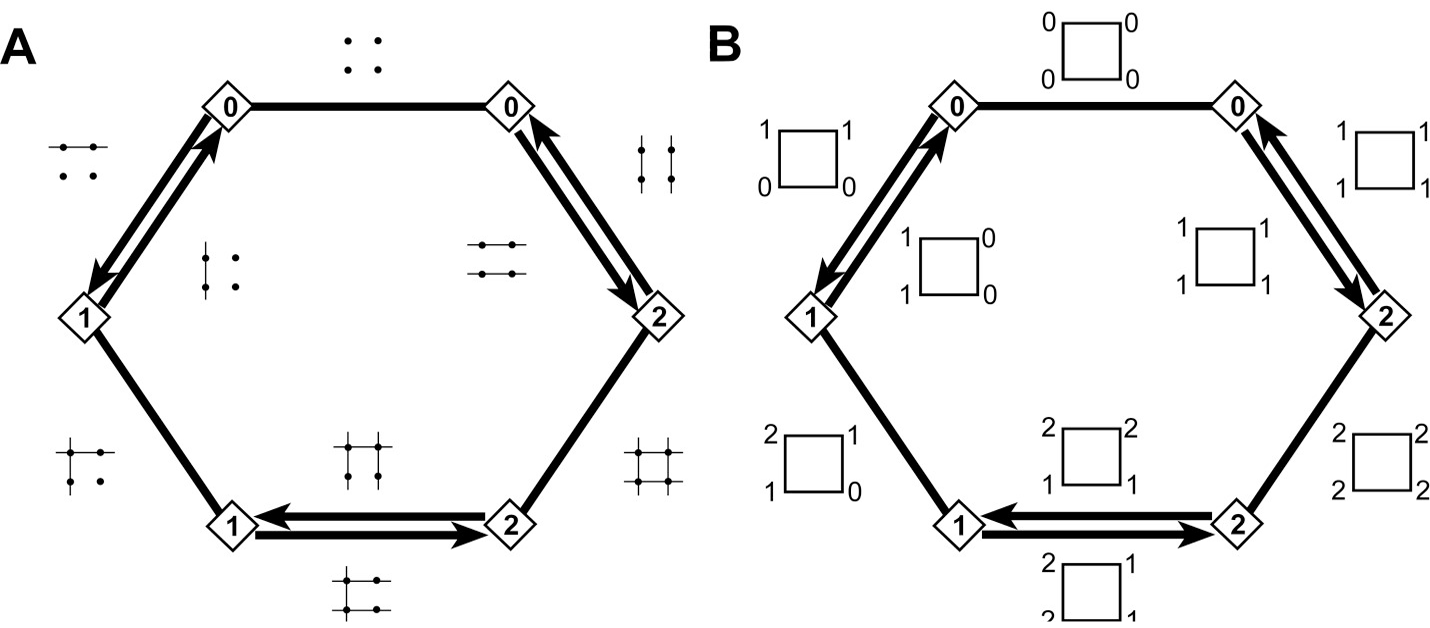
Basic hexagonal illustration approach. Here a line between two parent symbols (rhombus = either sex) represent marriage line as 1—1 means 1 x 1 and where genotype of both parents is different, two different writable crosses are possible as represented by arrows 0→1 = 0 x 1 and 1→0 = 1 x 0 etc. A, line-dot hexagon (Ld-hex) representing the line-dot offspring outcomes of nine possible writable parent genotype combinations. Here, dot = 0, one line passing through a dot = 1, two lines passing through a dot = 2; B, basic genotype hexagon (bG-hex) representing the ternary coded square offspring outcomes of nine possible writable parent genotype combinations.

Detailed genotype hexagon (dG-hex) describing the probability of having a certain genotype in offspring after a parental cross. Solid lines in the outer hexagon between two rhombuses (parent with either sex) represent marriage for autosomal inheritance. Solid and dotted lines in the inner hexagon space between square (father) and circle (mother) represent marriage for X-linked and Y-linked inheritance, respectively. Genotype outcome in offspring are represented by ternary coded square along each marriage line. Wherever genotype code of both parents is different, two different writable crosses are possible so respective ternary coded square is represented along the relevant arrowhead. e.g., for a parental cross 0 x 1, the offspring outcomes are written along the arrow head near the parent 0 in the 0→1 direction.

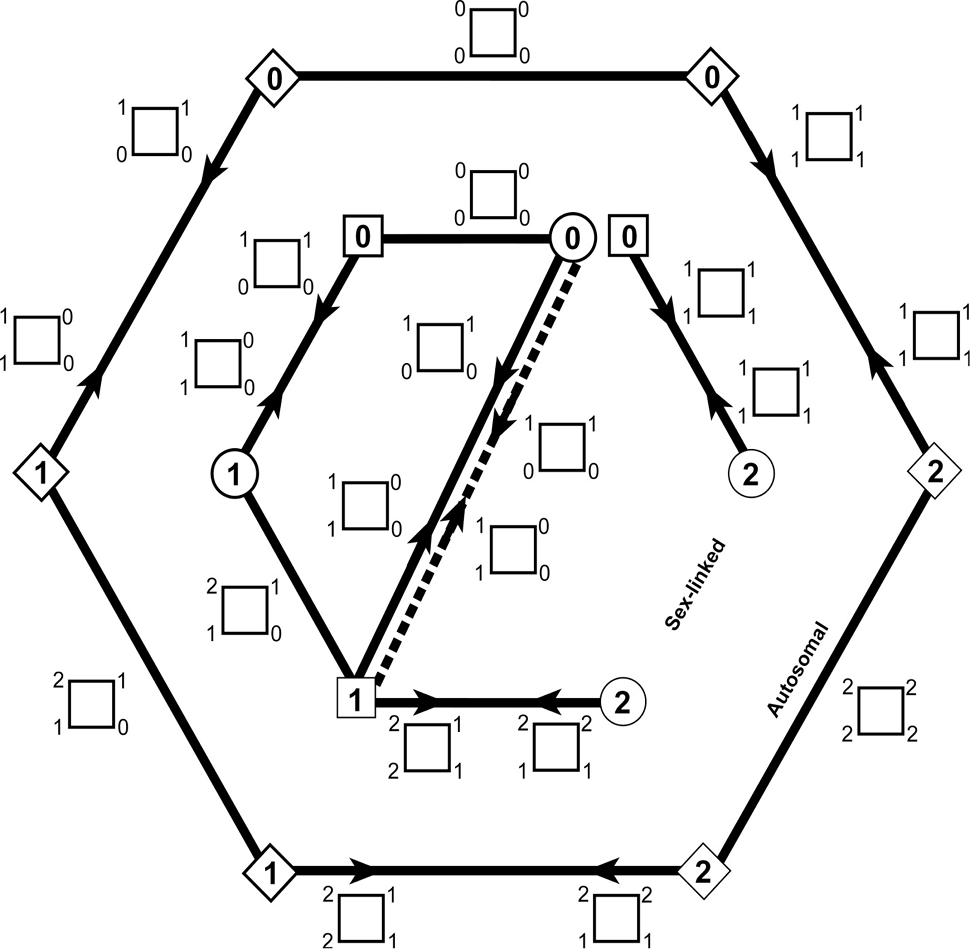
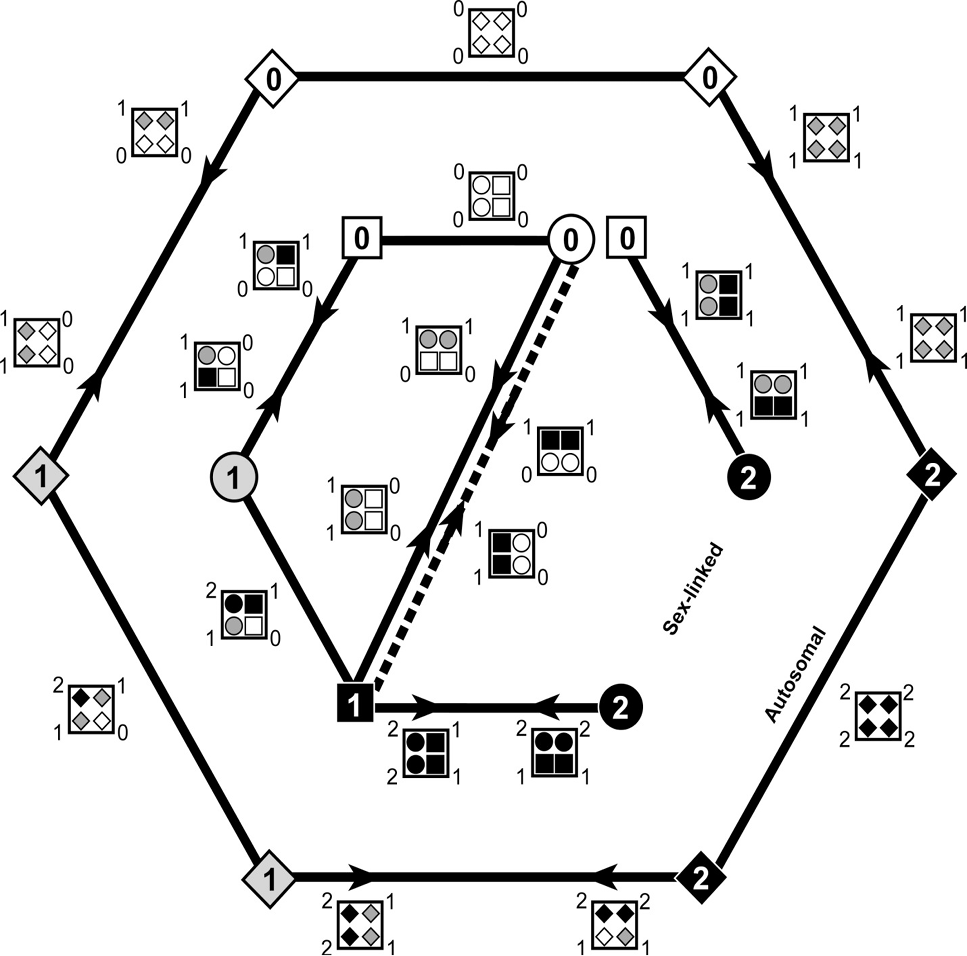
Genotype-to-phenotype hexagon (G2P-hex) describing the probability of all possible genotypic along with phenotypic outcomes for autosomal and sex-linked Mendelian inheritance. The ternary coded square is filled with four gender symbols along with their affection status relative to genotype. Outer and inner hexagons represent genotypic outcomes and associated phenotype for autosomal and sex-linked inheritance, respectively. For inner hexagon solid and dotted lines represent x-linked and y-linked inheritance, respectively. Genotype outcomes are similar as described in dG-hex but for representing affection status, unfilled symbols = normal, filled symbols = affected, light filled symbols = heterozygotes that will be affected for dominant and carrier for recessive conditions.
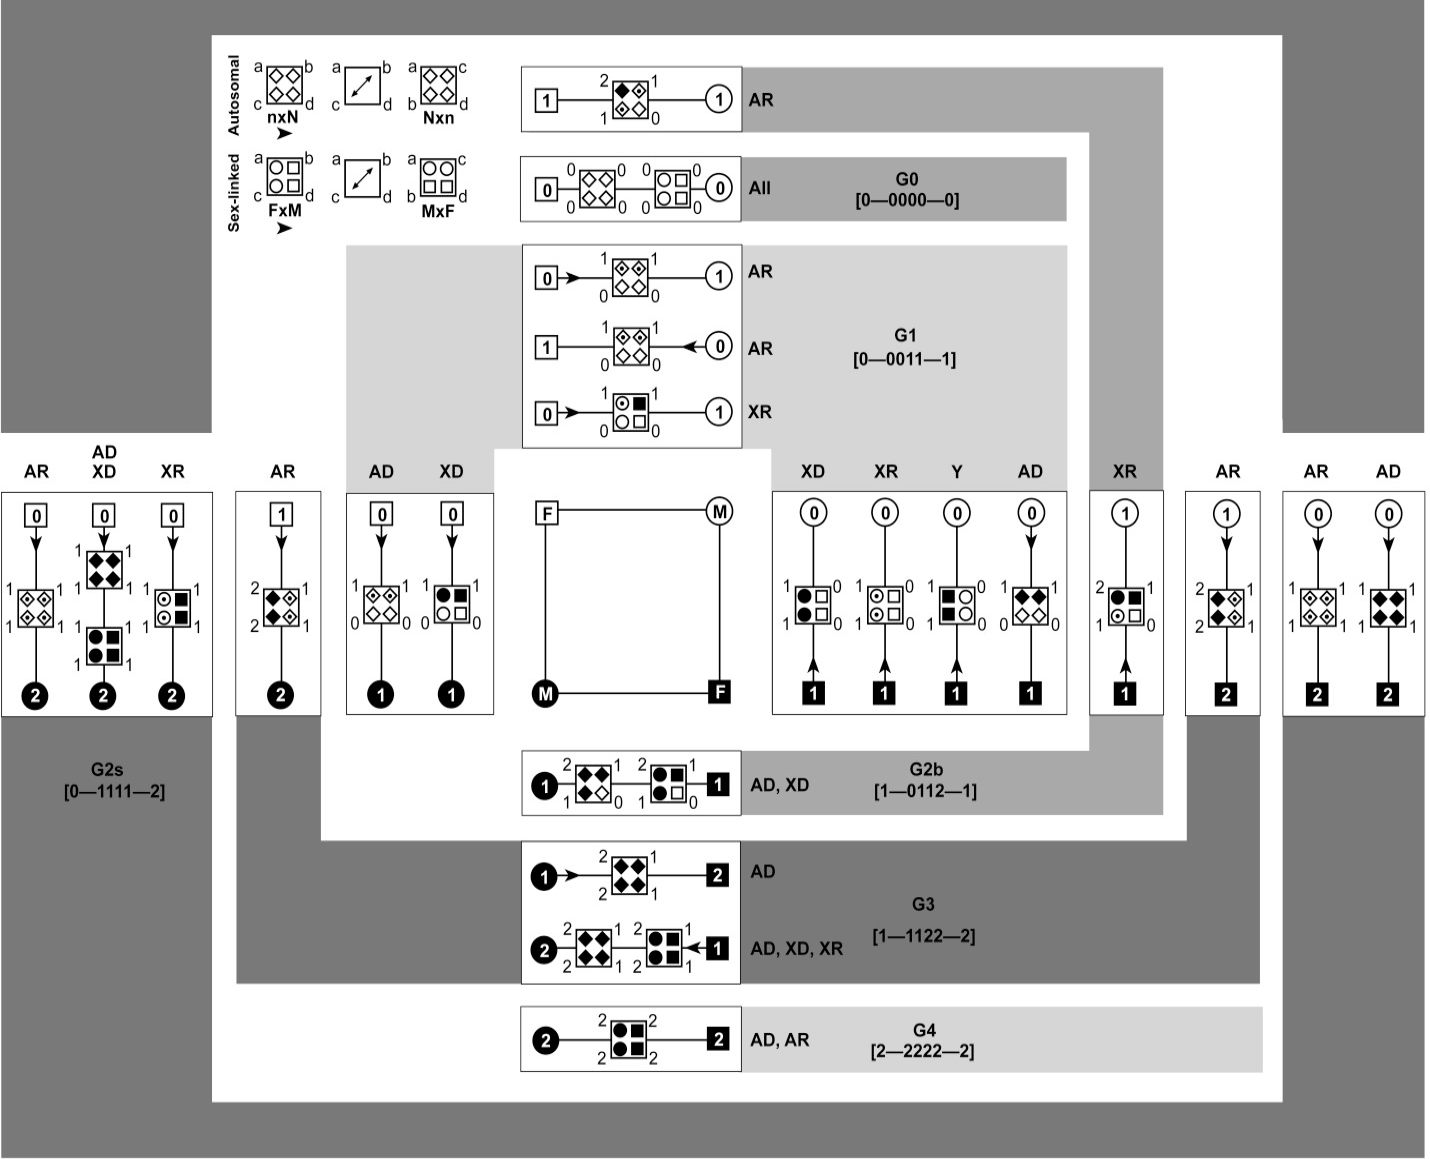
Phenotype-to-genotype square (P2G-Sq) describing four possible parent unions on the basis of phenotype (square in the center) and their possible genotype and phenotype probabilities in parents and their offspring accordingly (along each side of this square). For any Mendelian trait, the genotype and phenotype probabilities will lie on any of the four sides of this central square. Genotypic and phenotypic outcomes in offspring are represented by modified Punnett square in the middle of marriage line between parents. Marriage lines where two modified Punnett squares are present represent the outcomes for both possible autosomal and sex-linked inheritance. Further, all outcomes are explained with respect to genotype probability groups. All parent unions and offspring outcomes connected with a similar shaded region belong to one genotype group mentioned in that shade. (n, parent with smaller genotype code; N, parent with larger genotype code; n=N when both parents have same genotype code; F, father; M, mother; x, cross; Arrowhead, describe which parent to consider first when writing a cross e.g., 0→1 means 0 x 1; AR, autosomal recessive; AD, autosomal dominant; XR, X-linked recessive; XD, X-linked dominant; Y, Y-linked; All, possible in all patterns of inheritance; Unfilled symbols, normal; Filled symbols, affected; Dot in a symbol, carrier).


