

Increased Oxidative Stress and Apoptosis in Splenic Tissue of Lupus-Prone (NZB/NZW) F1 Mice Infected with Live but not Gamma Irradiated Plasmodium chabaudi


Increased Oxidative Stress and Apoptosis in Splenic Tissue of Lupus-Prone (NZB/NZW) F1 Mice Infected with Live but not Gamma Irradiated Plasmodium chabaudi
Mostafa A. Abdel-Maksoud1,2, Fathy A. Abdel-Ghaffar2, Azza El-Amir2, Gamal Badr3 and Saleh Al-Quraishy1*
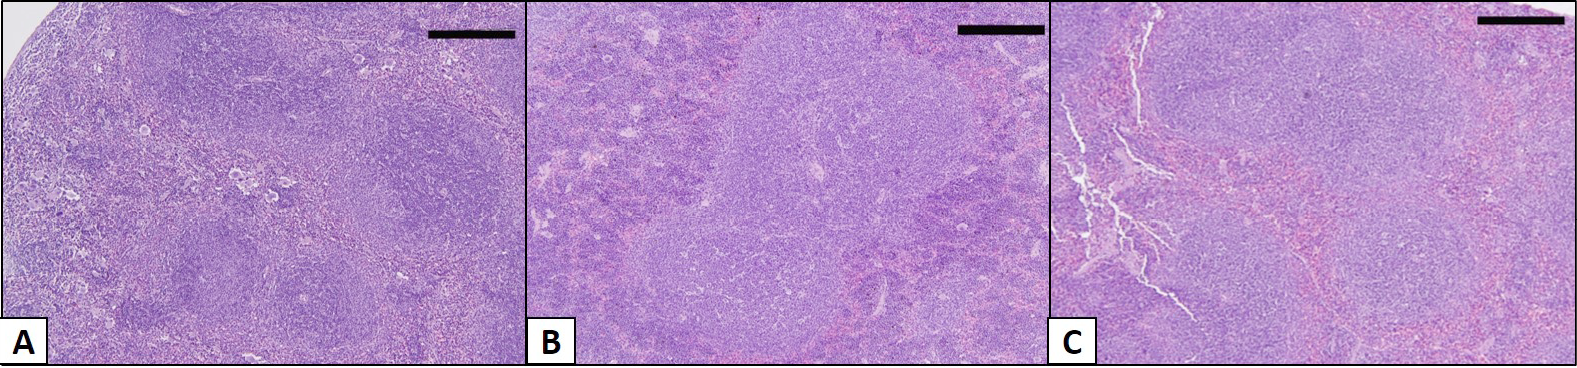
The effect of malarial infection on the distribution of red and white pulps in splenic tissue of female BWF1 mice. Hematoxylin and eosin (H/E) staining of spleen of lupus (A), live P. chabaudi (B) and gamma-irradiated P. chabaudi (C) infected group of BWF1 mice (n=10). The organs were removed at day 14 p.i. Sections of P. chabaudi infected groups have showed hypertrophied white pulps at the expense of red pulp. Scale bar = 100µm.
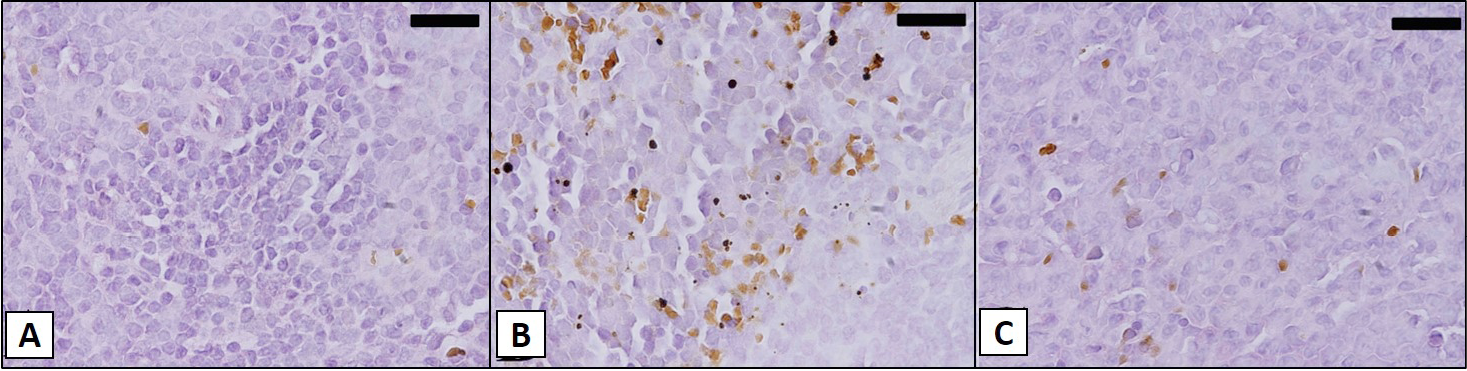
The effect of malarial infection on apoptotic DNA fragmentation in splenic tissue of female BWF1 mice splenic tissues of the lupus (A), live P. chabaudi (B), and gamma-irradiated P. chabaudi (C) infected group of BWF1 mice at week 32. Paraffin embedded tissue sections were prepared and investigated using TUNEL apoptosis detection kits. The TUNEL-positive nuclei are markedly different from those observed in the lupus group. Scale bar = 25µm.
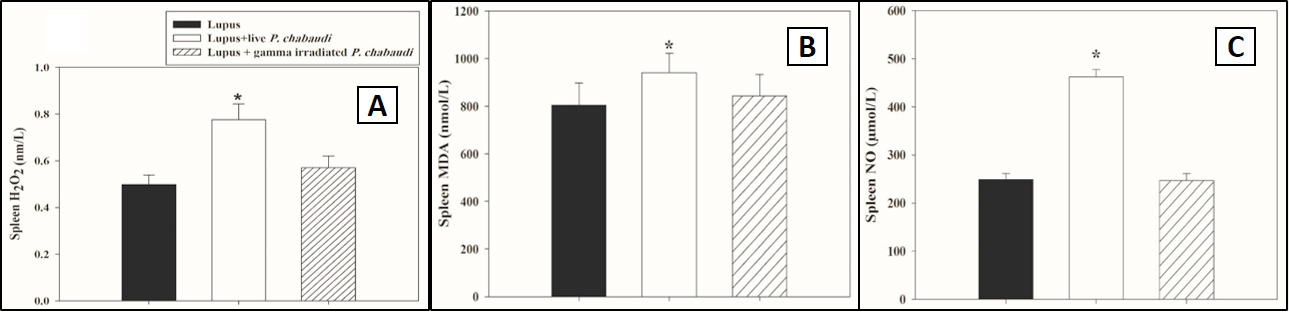
Effect of live or gamma-irradiated P. chabaudi infection on splenic NO, H2O2, and MDA levels. The levels of H2O2 (a), MDA (b), and NO (c) in splenic tissue of BWF1 lupus mice after experimental infection with either live or gamma irradiated malaria in comparison with the lupus non infected group. The data are the mean ± SEM for 6 mice per group *P<0.05 for live malaria-infected BWF1 mice versus lupus mice.

