

Leptin in Darkbarbel Catfish Pseudobagrus vachellii: Molecular Characterization, Synteny and Phylogeny, Tissue Distribution, and Expression in Response to Different Feeding Status


Leptin in Darkbarbel Catfish Pseudobagrus vachellii: Molecular Characterization, Synteny and Phylogeny, Tissue Distribution, and Expression in Response to Different Feeding Status
Zheng-Yong Wen1, 2*, Chuan-Jie Qin1,2, Bin Li1,2, Rui Li1,2 and Xiao-Tao Shi3*
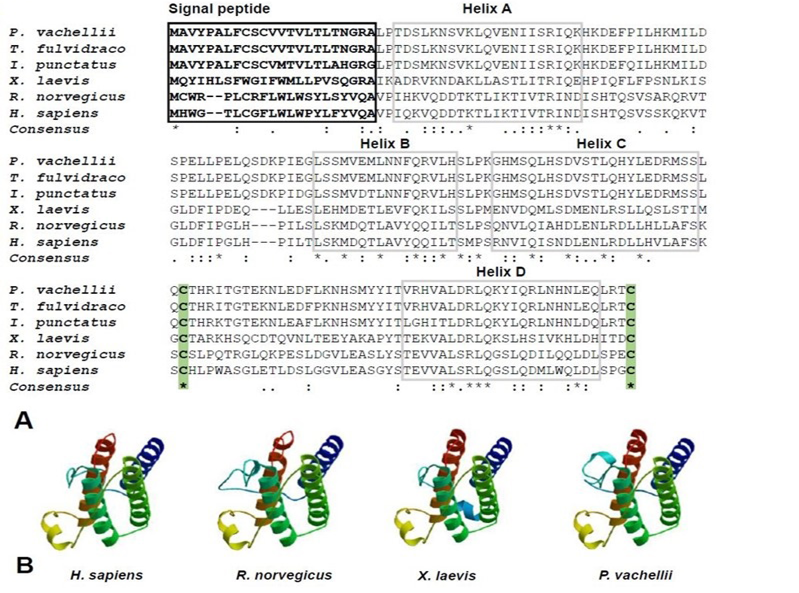
Multiple Leptin sequences alignment (A) and three-dimensional structure modeling of Leptins in four representative species (B). Signal peptide sequences are marked by black box and highlighted with bold font. Four α-helix domains were labeled by gray boxes and numbered A-D. Two conservative cysteine residues were marked by green background with bold font. The representative species including human (H. sapiens), rat (R. norvegicus), frog (X. laevis) and darkbarbel catfish (P. vachellii).

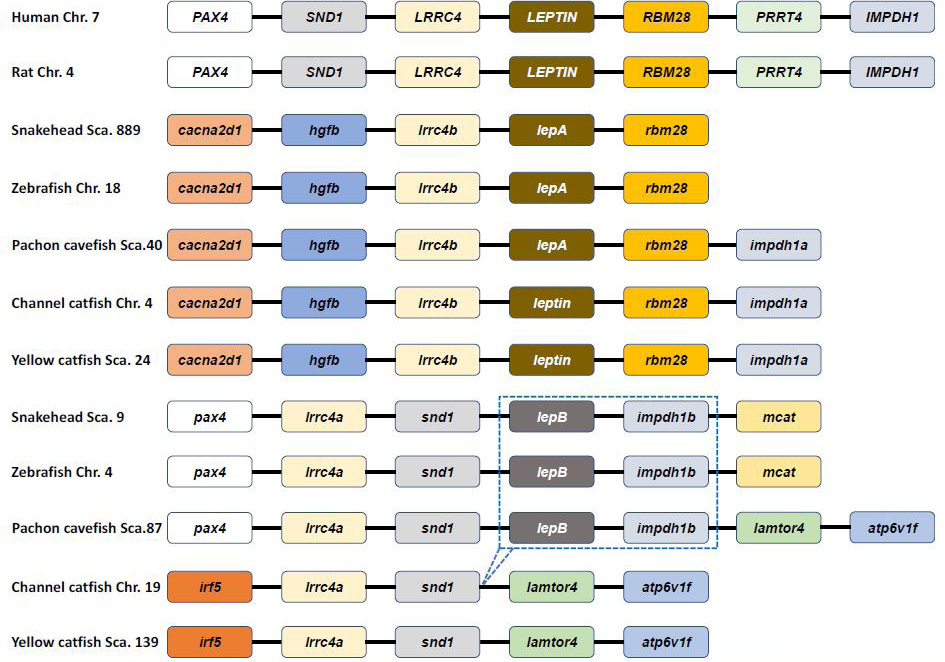
Genetic synteny comparison of Pvleptin and its homologs in vertebrates. The colorful blocks and solid lines represent genes and intergenic regions, respectively. The specific cluster (lepB-impdh1b) that has lost in siluriformes are marked by dotted box.
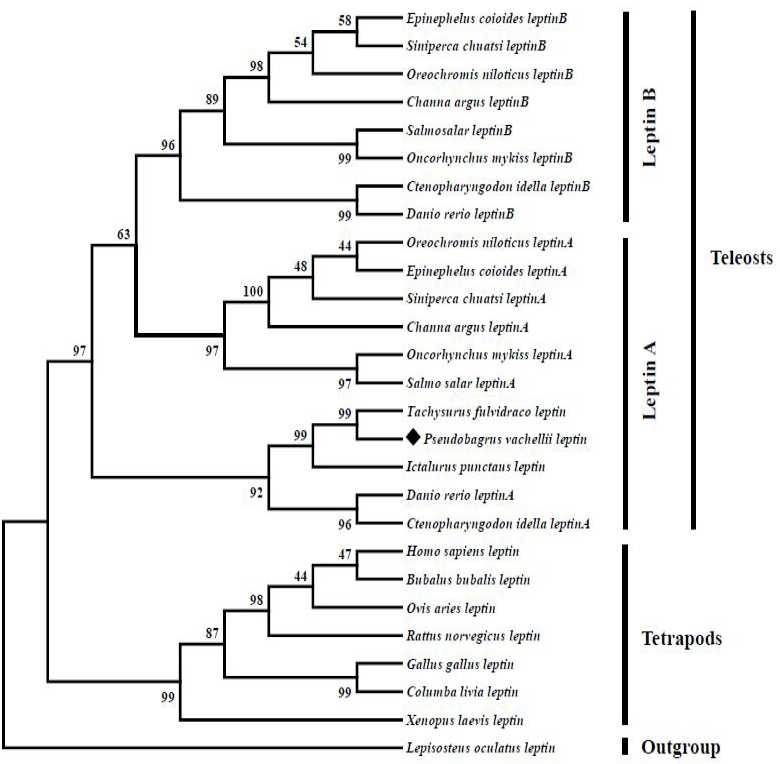
Neighbor joining tree reveals the phylogenetic relationship among vertebrate leptin genes. The tree was constructed by using MEGA 6.0 program based on a protein dataset. Values on the nodes represent bootstrap percentages from 1000 replicates. The aimed species was highlighted by a rhombic diamond and spotted gar (Lepisosteus oculatus) was used as the outgroup species.
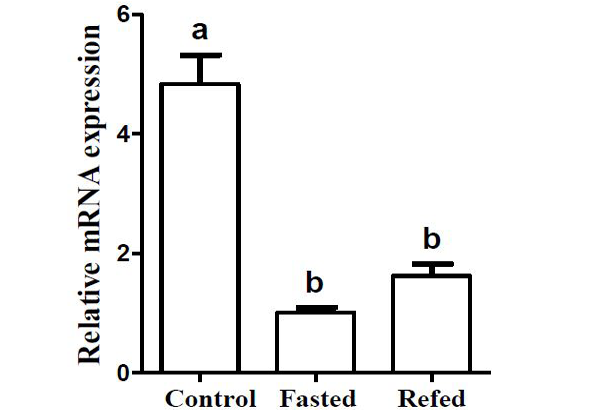
Effects of two-week fasting and refeeding on the mRNA expression level of Pvleptin in liver. Results were expressed as relative expression levels and normalized by the β-actin gene. Each error bar represents a standard error of the mean (n = 5).

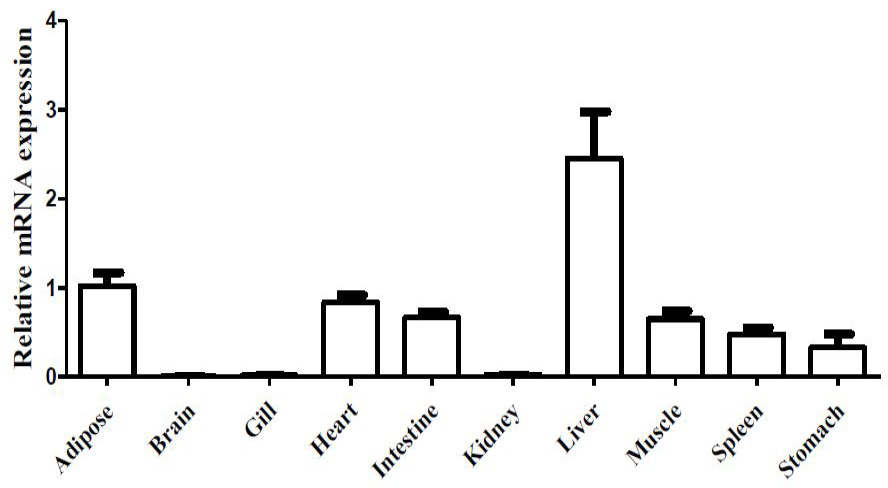
Tissue distribution pattern of leptin in darkbarbel catfish. Results were expressed as relative expression levels and normalized by the β-actin gene. Each error bar represents a standard error of the mean (n = 5).


