

Low Dose of Azithromycin Enhances the Anticancer Efficacy of Sorafenib in HepG2 Cell Line


Low Dose of Azithromycin Enhances the Anticancer Efficacy of Sorafenib in HepG2 Cell Line
Dabeeran Zehra1, Zahida Memon1, Shumaila Usman2,*, Almas Jabeen3, Kauser Ismail1 and Rehan Ahmed Siddiqui2
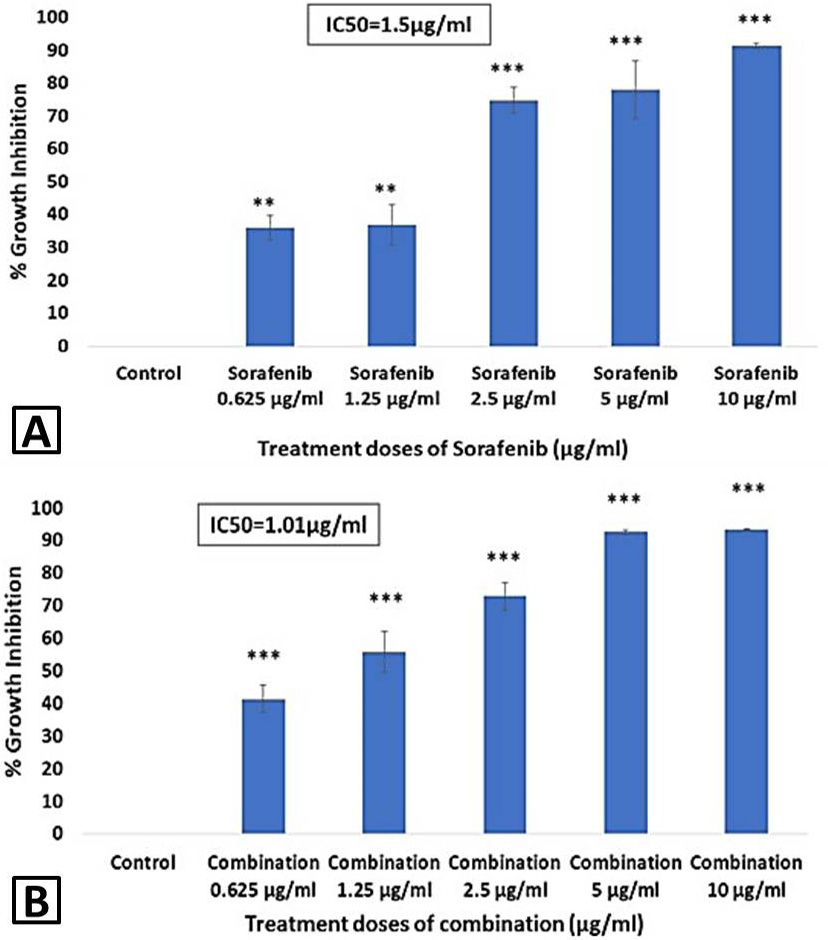
Cytotoxic effects of Sorafenib and combination on HepG2 cells following 48 h of treatment. A, the graph shows dose dependent inhibitory effect of Sorafenib on growth of HepG2 cells. Significant difference between untreated and Sorafenib treated cells was observed and is indicated as **P<0.01 at 0.625µg/ml and 1.25µg/ml, and ***P<0.001 at higher doses. B, bar graph shows dose dependent effect of combination on growth inhibition of HepG2 cells with level of significance ***P<0.001 versus untreated group. Each bar represents mean ± SEM for the experiments run in triplicates.
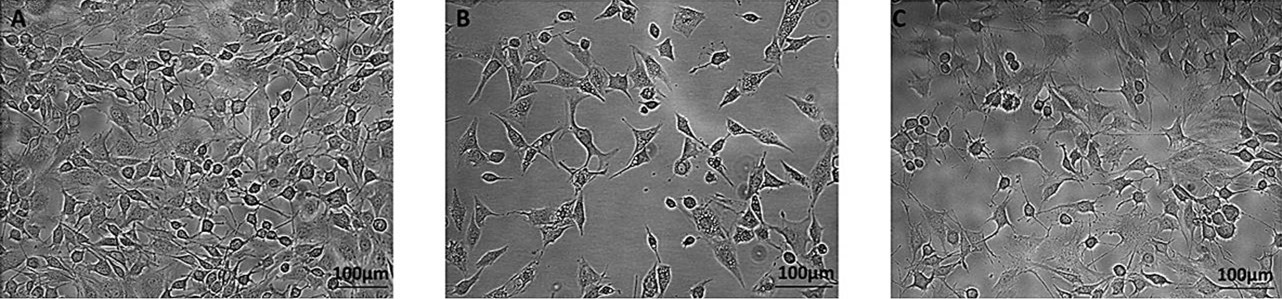
Inverted phase microscopy showing HepG2 cells control (A), Sorafenib (B) and combination (C) treated cells. The control cells (A) display normal morphology of HepG2 cells. In contrast, the cells treated with sorafenib (B) and combination (C) at their IC50 concentrations showed morphological alteration as compared to control. Images were taken at 10X magnification and scale bar is 100µm.

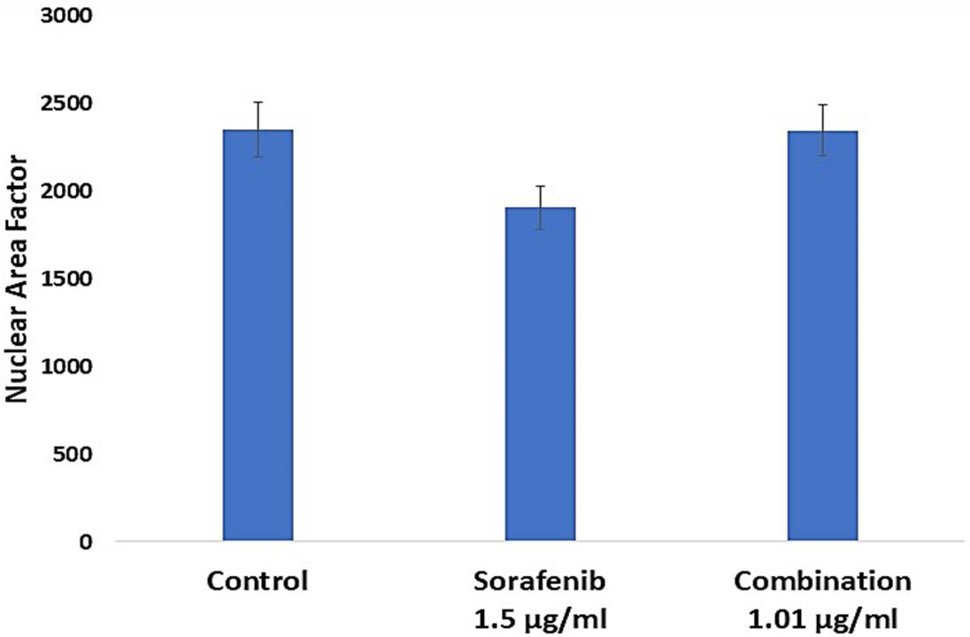
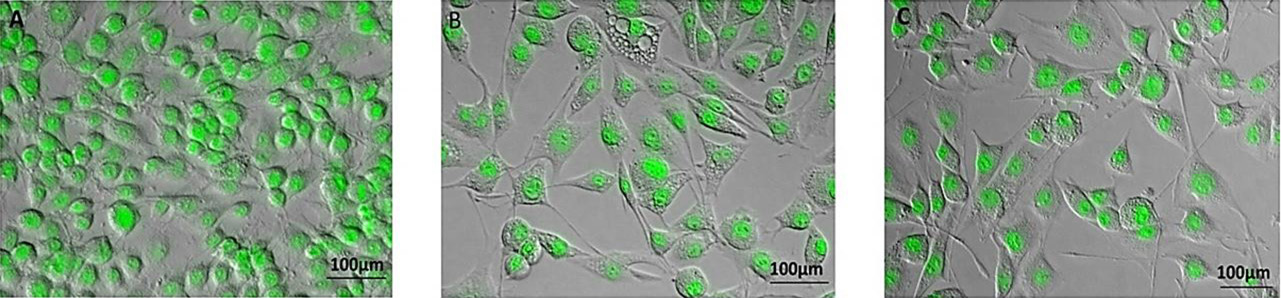
Fluorescence microscopy showing DAPI stained nuclei of HepG2 control (A), Sorafenib (B) and combination (C) treated cells depicting insignificant results. Fluorescence microscopy was done at 10X magnification. Scale bar was 100µm.
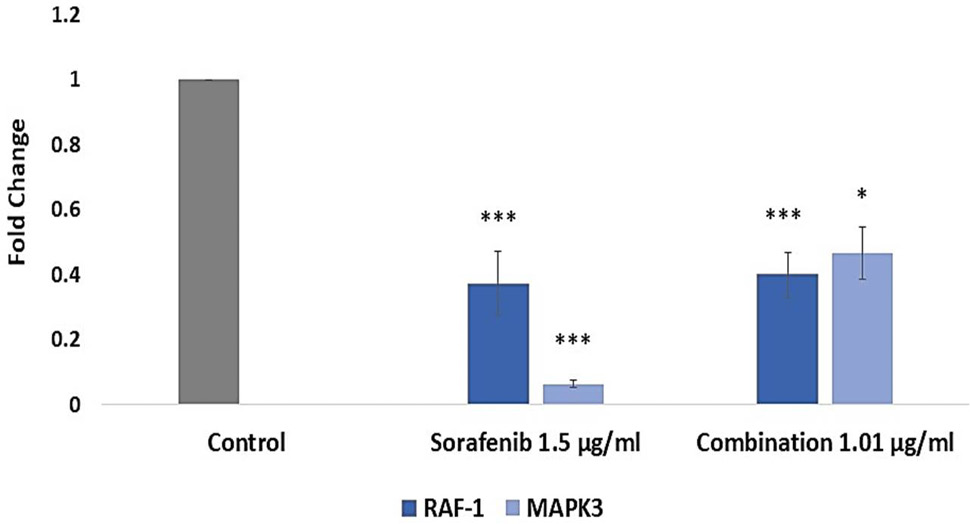
Down regulation of mRNA expression of RAF-1 and MAPK3 after being treated with sorafenib and combination at their IC50 concentrations. GAPDH was used as control gene. Fold change was calculated by ∆Ct method after obtaining CT values. The data was presented as mean ± SEM of three independent experiments.

