

Molecular Identification, Tissue Distribution, and Effects of Fasting and Refeeding on the Transcription of Uncoupling Protein 2 in Yellow Catfish, Pelteobagrus vachelli


Molecular Identification, Tissue Distribution, and Effects of Fasting and Refeeding on the Transcription of Uncoupling Protein 2 in Yellow Catfish, Pelteobagrus vachelli
Fan Da1,3, Zheng-Yong Wen1,2*, Xiao-Dong Wang4 and Yu Luo5
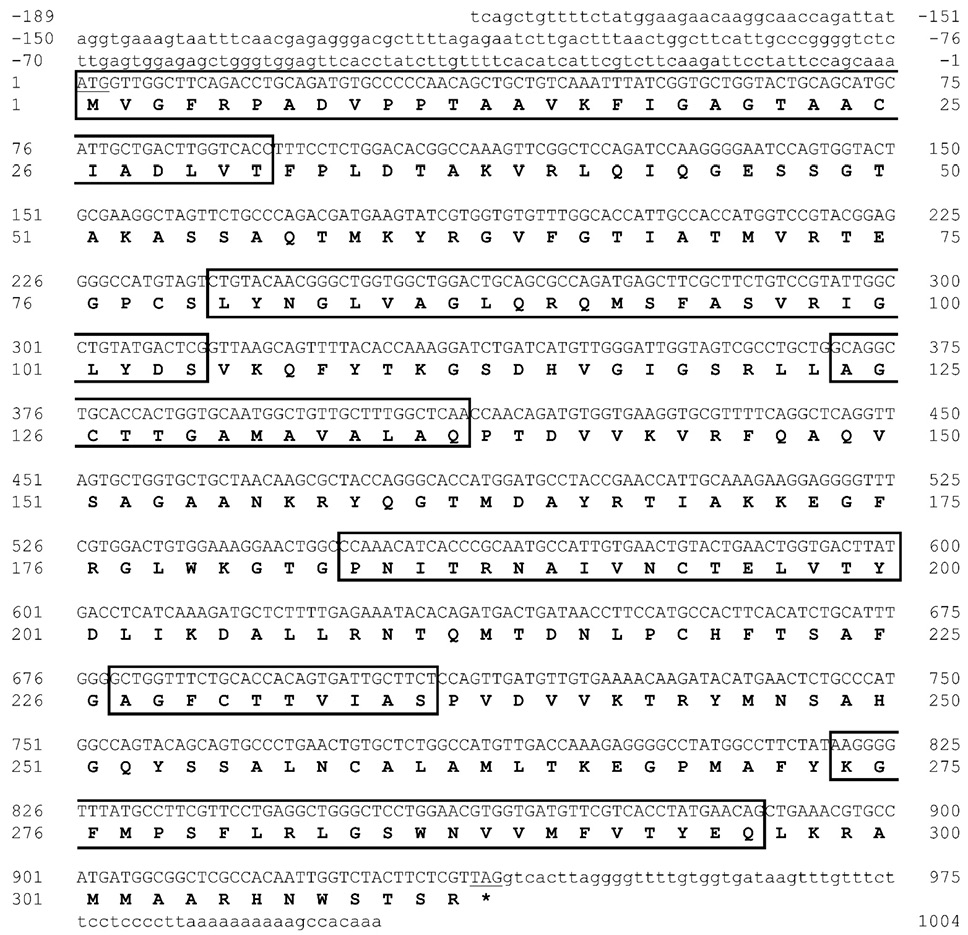
Complete CDS sequences and predicted amino acids of uncoupling protein 2 (UCP2) identified from P. vachelli. Positions of nucleotide and amino acid sequences were indicated on both sides. Putative transmembrane conserved domains were shown by boxes. The amino acids sequences were presented by uppercase in bold. Letters in lower case represented the 5’ and 3’ untranslated regions. Underlines showed initiation codon and termination codon. Stop codon was indicated by (*).

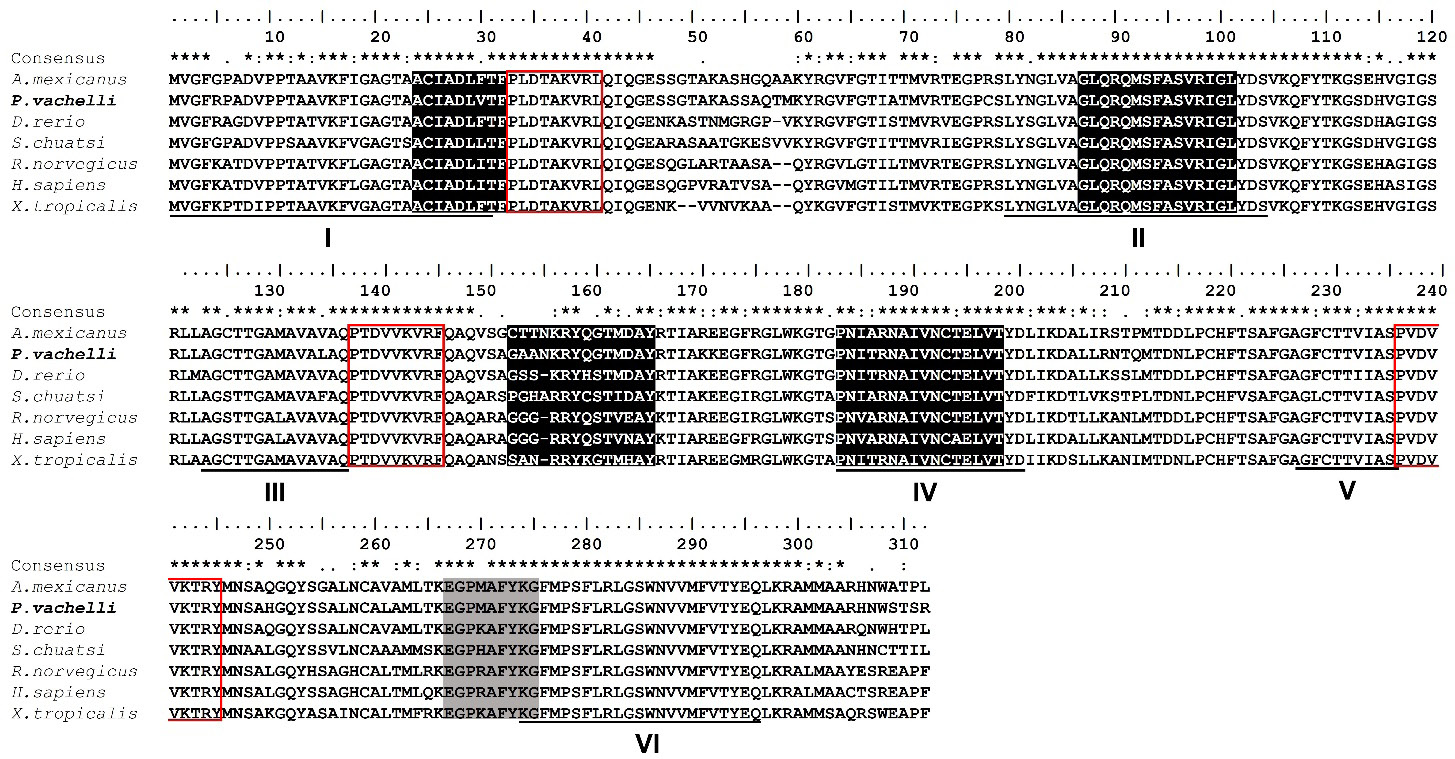
Multiple alignments of the UCP2 amino acid sequences of P. vachelli with those of other vertebrates. The dashes in amino acid sequence indicate the amino acid gaps that are necessary to align these sequences. Asterisks (*) indicated the highly conserved amino acids among all members of the proteins. Six transmembrane α-helix domains were underlined and labeled I-VI. Three mitochondrial carrier protein motifs were labelled by red box. Purine-nucleotide binding domain was indicated by grey shade. UCP signature motifs were shown in white letters on black. The protein sequences IDs were shown in supplemental Table II.
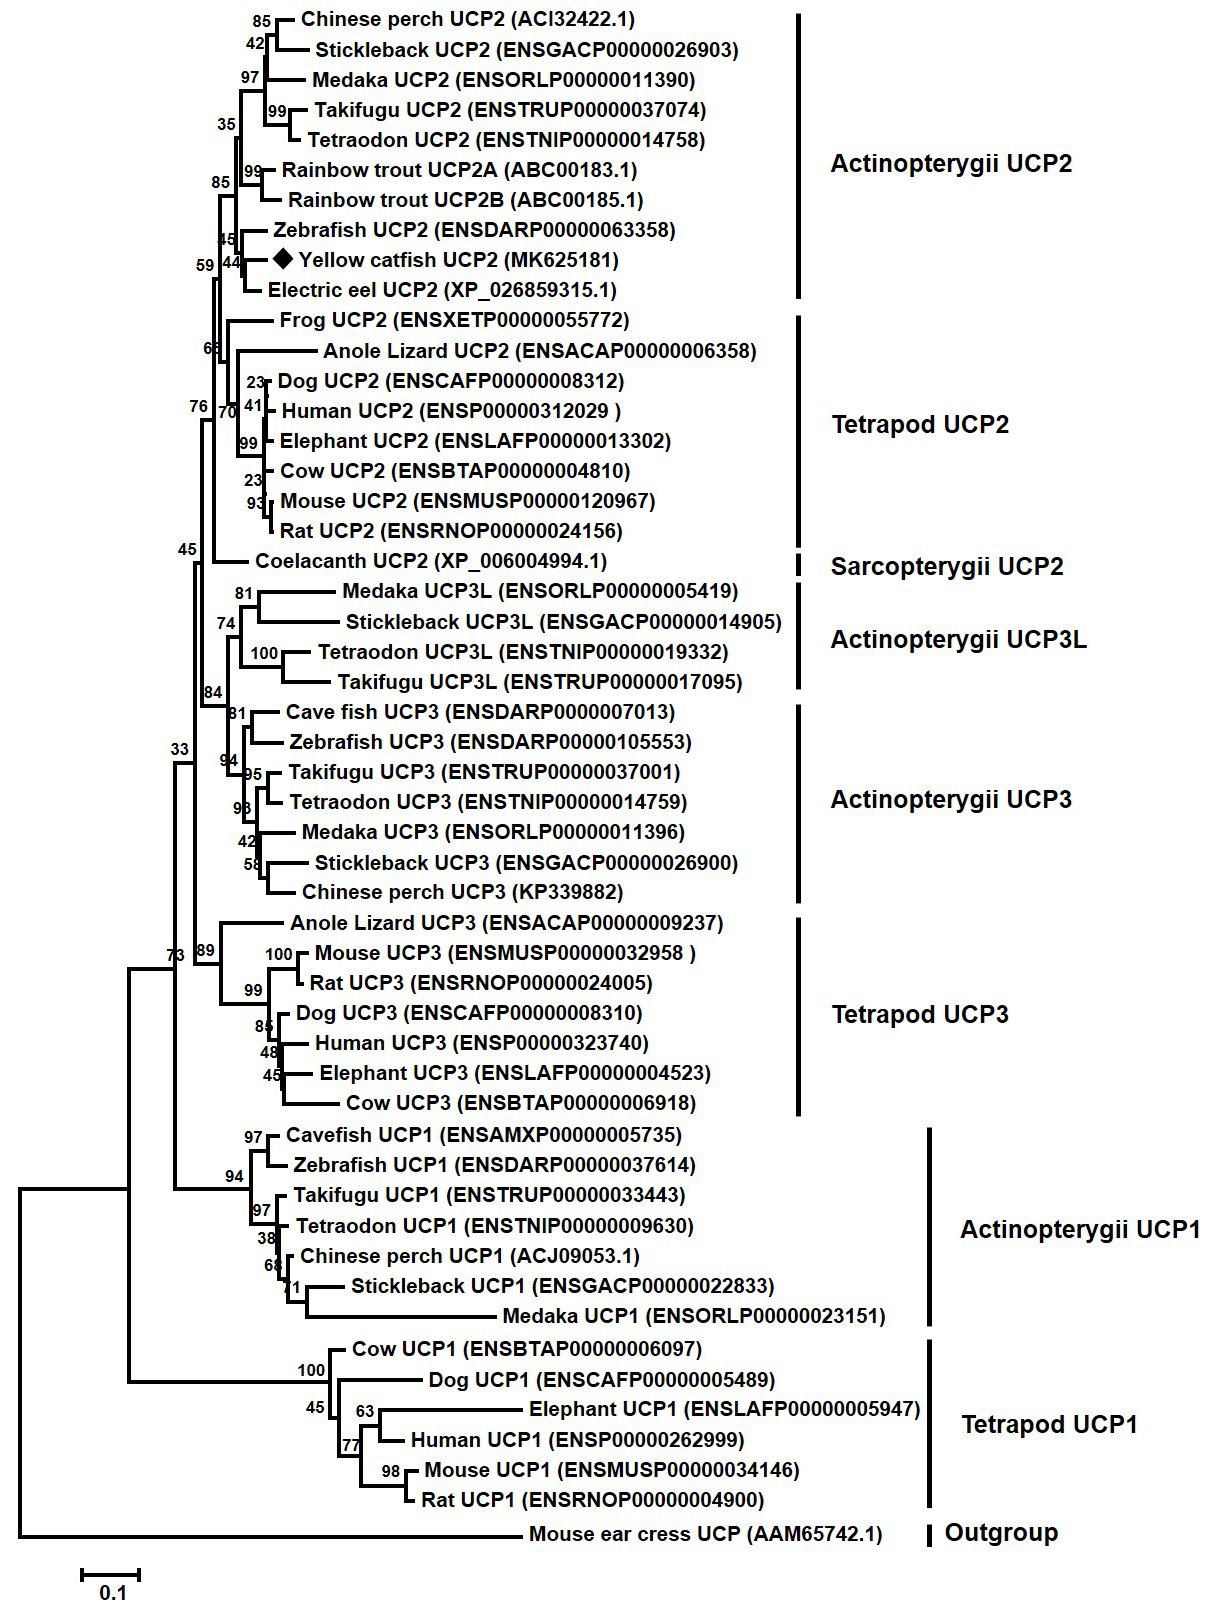
Neighbor-joining tree reveals the phylogenetic relationship of vertebrate UCPs. The phylogenetic tree was constructed based on 51 protein sequences using MEGA 6.0 program. The values at the nodes represented bootstrap from 1000 replicates. The yellow catfish UCP2 was marked with diamond. The Mouse ear cress was selected as an outgroup species. Protein IDs were shown behind the taxon names.
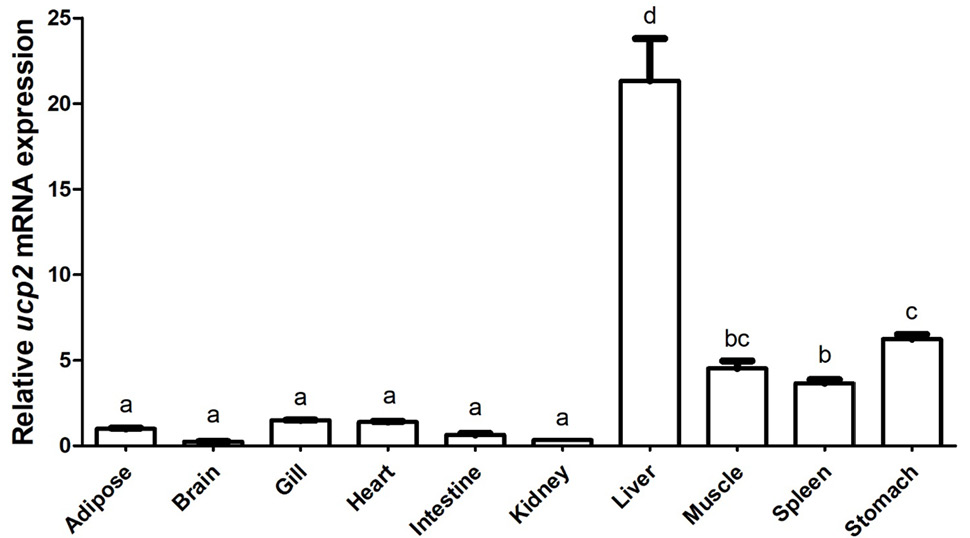
Relative mRNA expression of ucp2 in P. vachelli. Ten different tissues were calculated in the present study. The results were expressed as relative expression levels and standardized by β-actin gene. Error bars represent standard error of the mean (n = 6).

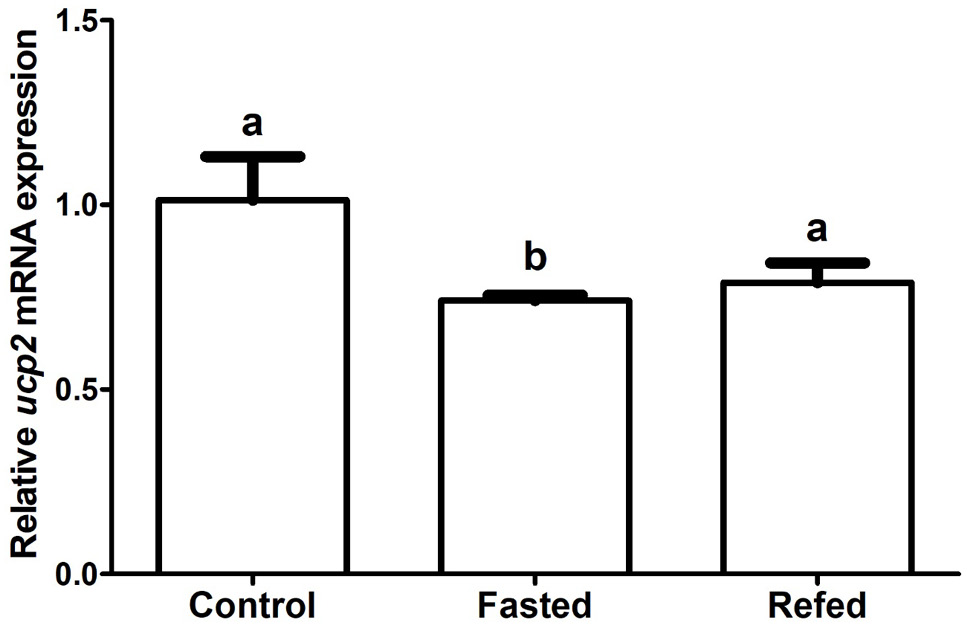
Effects of two weeks fasting and refeeding on the mRNA expression of hepatic ucp2 in P. vachelli. β-actin was chosen as reference gene. Significant differences (P<0.05) between groups were detected using a one-way ANOVA. Groups that differ significantly were indicated by different letters above bars. Data were shown as mean ± SEM (n = 6).

