

Possible Role of Neuromedin S (NMS) in Male Reproduction: Effect of NMS on Adipokines Secretion in Male Rhesus Monkeys (Macaca mulatta)


Possible Role of Neuromedin S (NMS) in Male Reproduction: Effect of NMS on Adipokines Secretion in Male Rhesus Monkeys (Macaca mulatta)
Shakeel Ahmed* and Sarwat Jahan
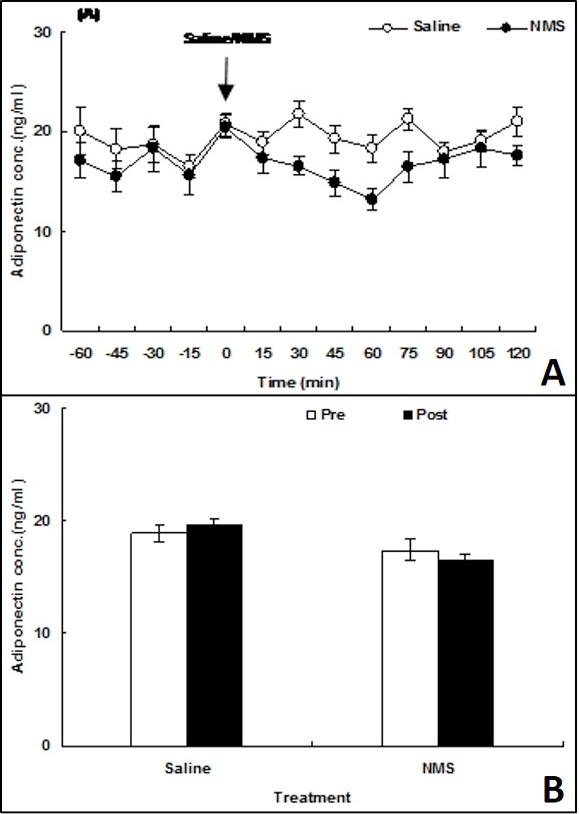
A, Mean (±SEM) changes in plasma adiponectin levels (ng/ml) before and after saline/NMS administration (at 0 min) in normal fed adult male monkeys. P>0.05 vs 0 min sample (ANOVA followed by post hoc Dunnett’s test). B, Comparison of mean (±SEM) plasma adiponectin levels (ng/ml) in 60 min pre- and 120 min post saline/NMS in normal fed adult male monkeys. P>0.05 vs pre-treatment (Student’s t test).
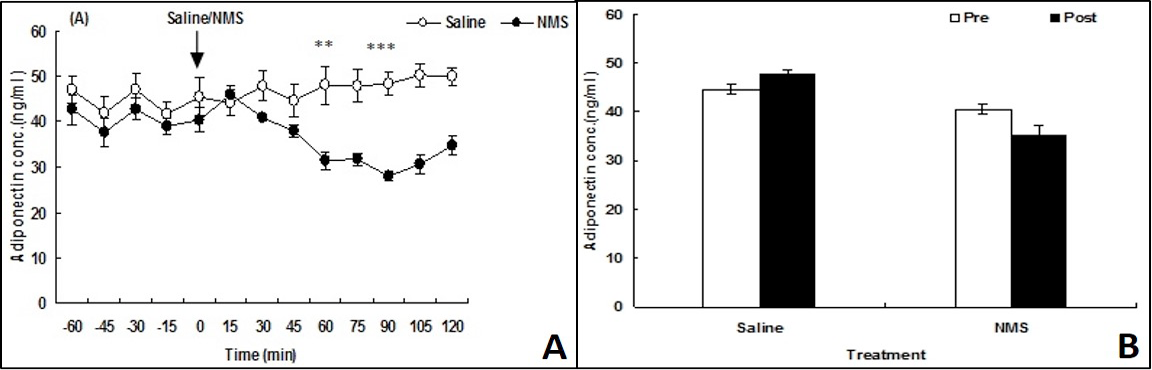
A, Mean (±SEM) changes in plasma adiponectin levels (ng/ml) before and after saline/NMS administration (at 0 min) in 48 h fasting adult male monkeys. **P<0.01, ***P<0.001 vs 0 min sample (ANOVA followed by post hoc Dunnett’s test). B, Comparison of mean (±SEM) plasma adiponectin levels (ng/ml) in 60 min pre- and 120 min post saline/NMS in 48 h fasting adult male monkeys. P>0.05 vs pre-treatment (Student’s t test).
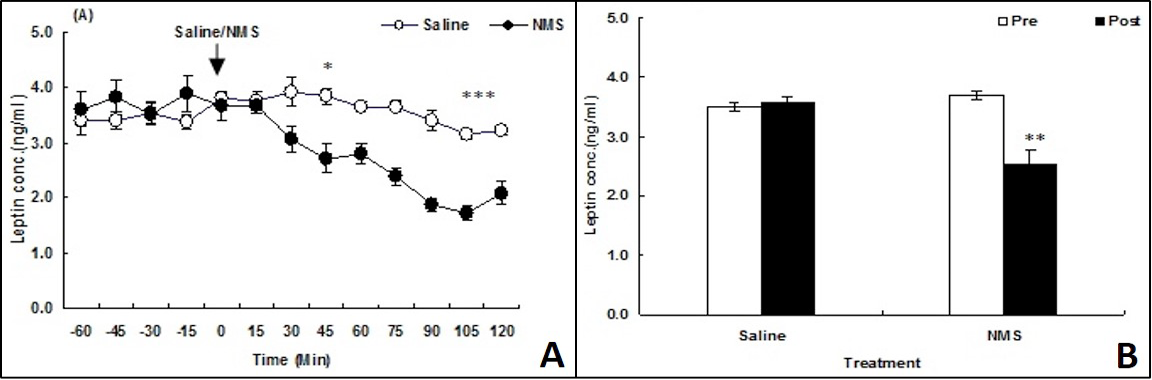
A, Mean (±SEM) changes in plasma leptin levels (ng/ml) before and after saline/NMS administration (at 0 min) in normal fed adult male monkeys. *P<0.05, ***P<0.001 vs 0 min sample (ANOVA followed by post hoc Dunnett’s test). B, Comparison of mean (±SEM) plasma leptin levels (ng/ml) in 60 min pre- and 120 min post saline/NMS in normal fed adult male monkeys. **P<0.01 vs pre-treatment (Student’s t test).
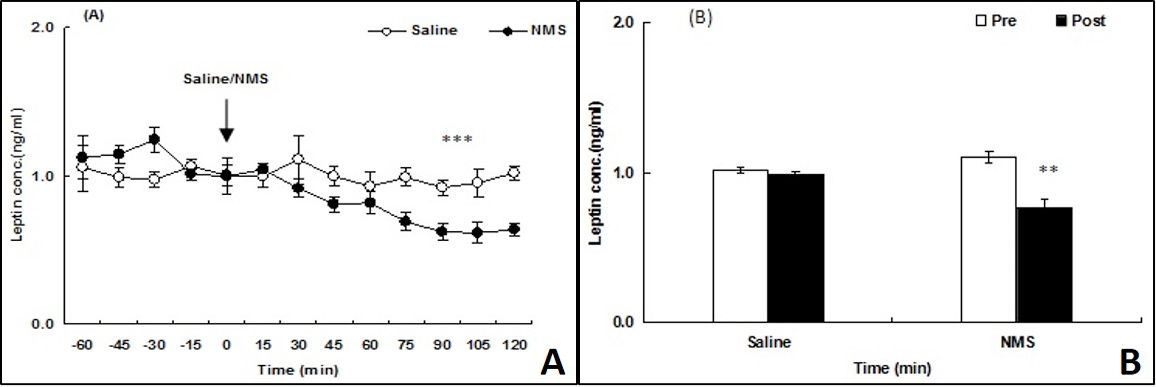
A, Mean (±SEM) changes in plasma leptin levels (ng/ml) before and after saline/NMS administration (at 0 min) in 48 h fasting adult male monkeys. ***P<0.001 vs 0 min sample (ANOVA followed by post hoc Dunnett’s test). B, Comparison of mean (±SEM) plasma leptin levels (ng/ml) in 60 min pre- and 120 min post saline/NMS in 48 h fasting adult male monkeys. **P<0.01 vs pre-treatment (Student’s t test).

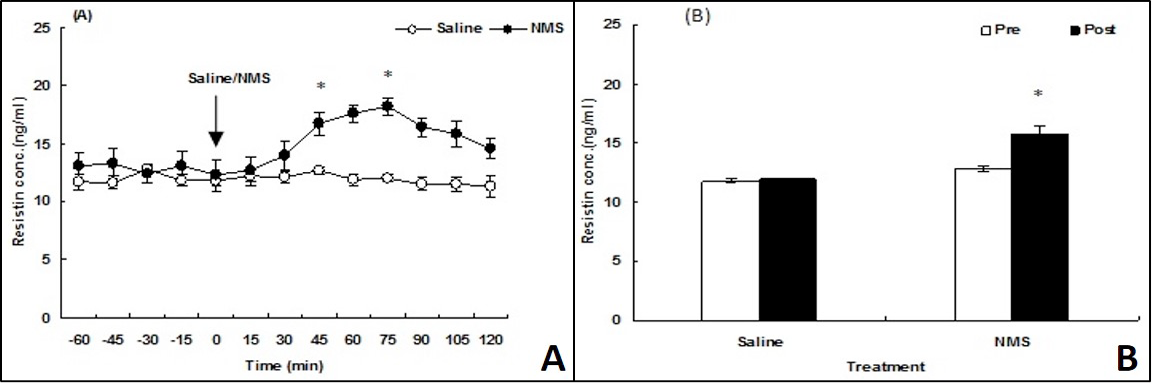
Fig. 5. A, Mean (±SEM) changes in plasma resistin levels (ng/ml) before and after saline/NMS administration (at 0 min) in normal fed adult male monkeys. *P<0.05 vs 0 min sample (ANOVA followed by post hoc Dunnett’s test). B, Comparison of mean (±SEM) plasma resistin levels (ng/ml) in 60 min pre- and 120 min post saline/NMS in normal fed adult male monkeys. *P<0.05 vs pre-treatment (Student’s t test).
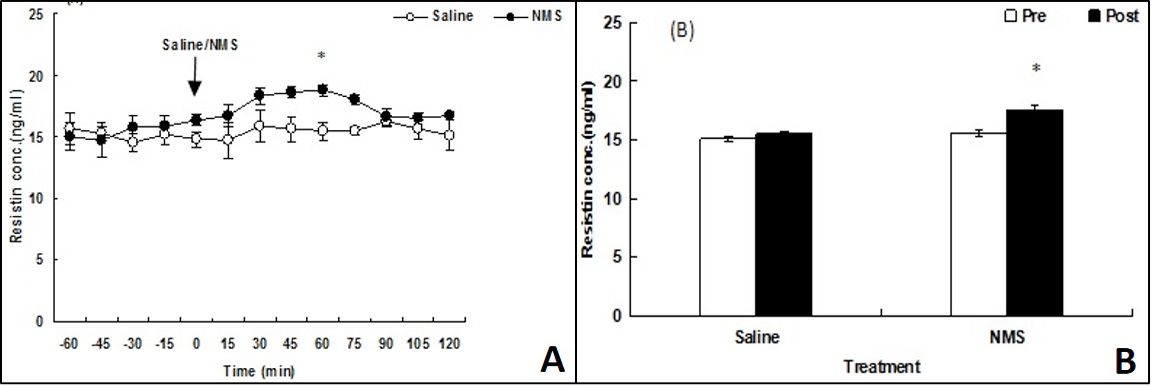
A, Mean (±SEM) changes in plasma resistin levels (ng/ml) before and after saline/NMS administration (at 0 min) in 48 h fasting adult male monkeys. *p<0.05 vs 0 min sample (ANOVA followed by post hoc Dunnett’s test). B, Comparison of mean (±SEM) plasma resistin levels (ng/ml) in 60 min pre- and 120 min post saline/NMS in 48 h fasting adult male monkeys. *P<0.05 vs pre-treatment (Student’s t test).

