

Purification and Bioactivity of Placental Lactogen from Water Buffalo, Bubalus bubalis


Purification and Bioactivity of Placental Lactogen from Water Buffalo, Bubalus bubalis
Amtul Jamil Sami1,*, Madeeha Khalid1, Rehman Shehzad1, Sana Mughal1 and A.R. Shakoori2
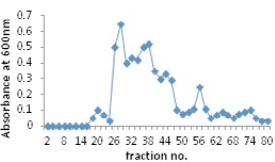
Gel filtration of crude placental extract. 50mg of protein was loaded on Sephadex G 100 column (1.8x30 cm). 80 fractions were collected (1ml each) at a flow rate of 0.5ml per min.
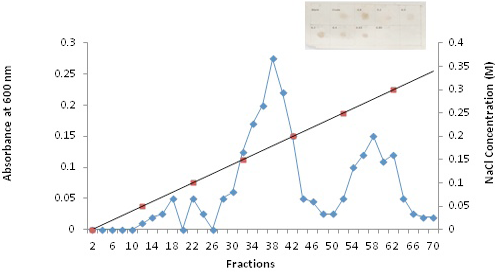
Ion exchange chromatography of placental proteins of Bubalus bubalis isolated at pH 9.5. 15 mg of protein was loaded onto a column packed with DEAE-Sepharose (0.8x15cm); using a salt gradient 0.01-0.5M NaCl in seat shows dot blot analysis of peak fraction indicating presence of bPL. Fractions from peak No. 1 showed immunogenic activity against placental lactogen antibody (Abcam, USA) (Fraction No. 28-48).

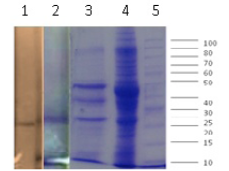
10% SDS-PAGE and Western blot anlaysis of placental lactogen. Lane 1, western blot; Lane 2, purified bPL; Lane 3, partially purified bPL (gel filtration); Lane 4, crude extract; Lane 5, protein marker.
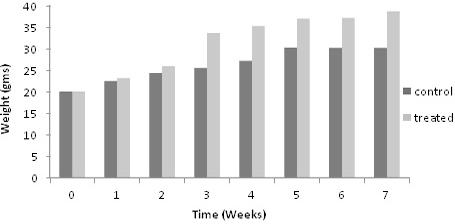
The effect of exogenous placental lactogen on mice for seven weeks. The bars indicate increasing trend of weight in subjects over controls starting from 2nd week. The subject animals were injected with the hormone 3 µg daily. The controls were injected with the buffer without placental lactogen. The experiment was carried out in triplicates, mean error of ±3 was allowed.
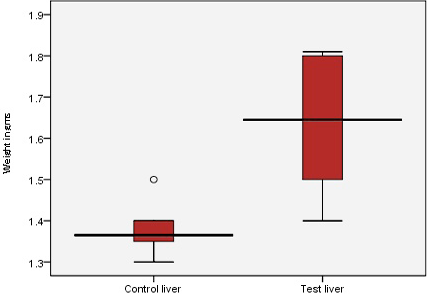
Effect of purified bubaline placental lactogen on liver in mice. Noticeable size and weight increase was observed in liver.

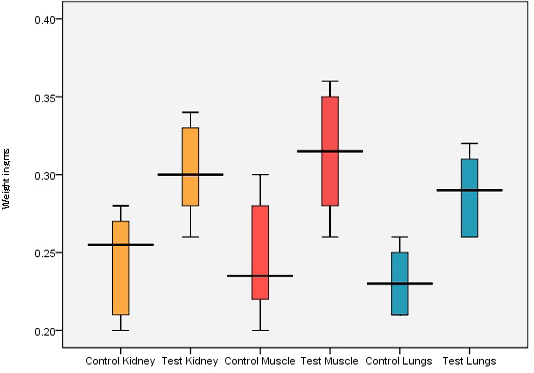
Effect of purified bubaline placental lactogens on vital organs. Significant weight increase is observable.
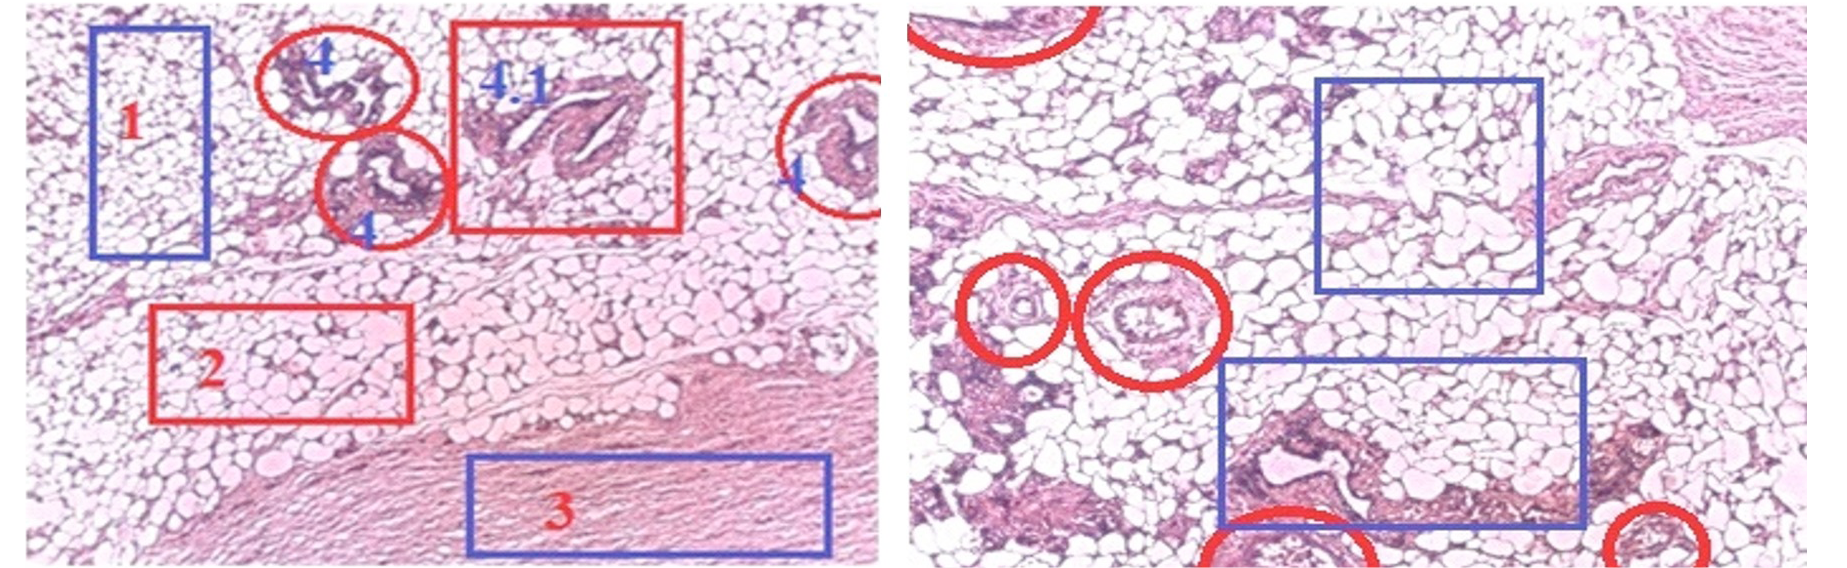
Cross section of Mammary gland tissue of non-lactating female control mouse (left) and test (right). Magnification is 1000x power of light microscope. 1 and 2 indicates an increase in adipose tissue with increased number of cells as compared to the control. Three circles in red color labeled as 4 are lobule (alveoli) of mammary glands, while the red color square marked as 4.1 is lactiferous duct.
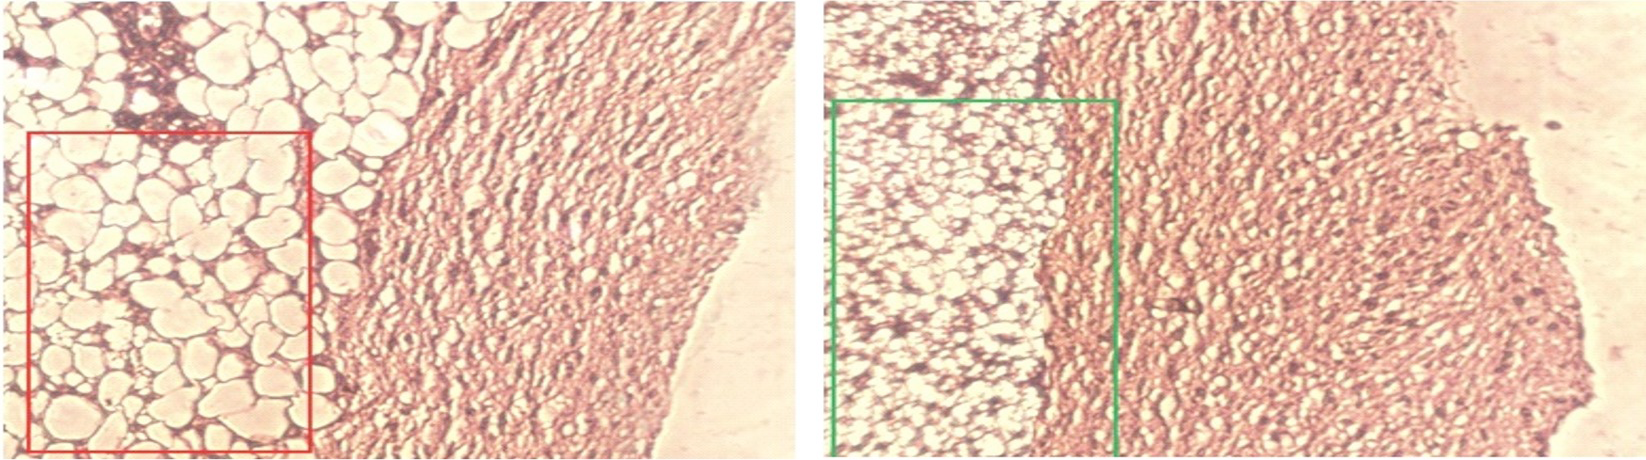
Cross section of skin tissue of non-lactating female control mouse (left) and test (right). H & E stain: 1000x magnification. Red square indicate the larger and more adipocytes in hypodermal layer.Green square indicate the smaller size of adipocutes in hypodermal layer, under the influence of exogenous bPL with lesser fat content.

