

Response of Liver-Type Fatty Acid-Binding Protein (L-FABP) Gene in Golden Pompano Trachinotus ovatus (Linnaeus 1758) to Temperature and Nutrient Manipulations


Response of Liver-Type Fatty Acid-Binding Protein (L-FABP) Gene in Golden Pompano Trachinotus ovatus (Linnaeus 1758) to Temperature and Nutrient Manipulations
Shengjie Zhou1,2, Pengfei Wang1,2, Chao Zhao1,2, Mingjun Fu3, Jian G. Qin4, Lihua Qiu1, Zhenhua Ma1, 4,* and Maoshang Lin1

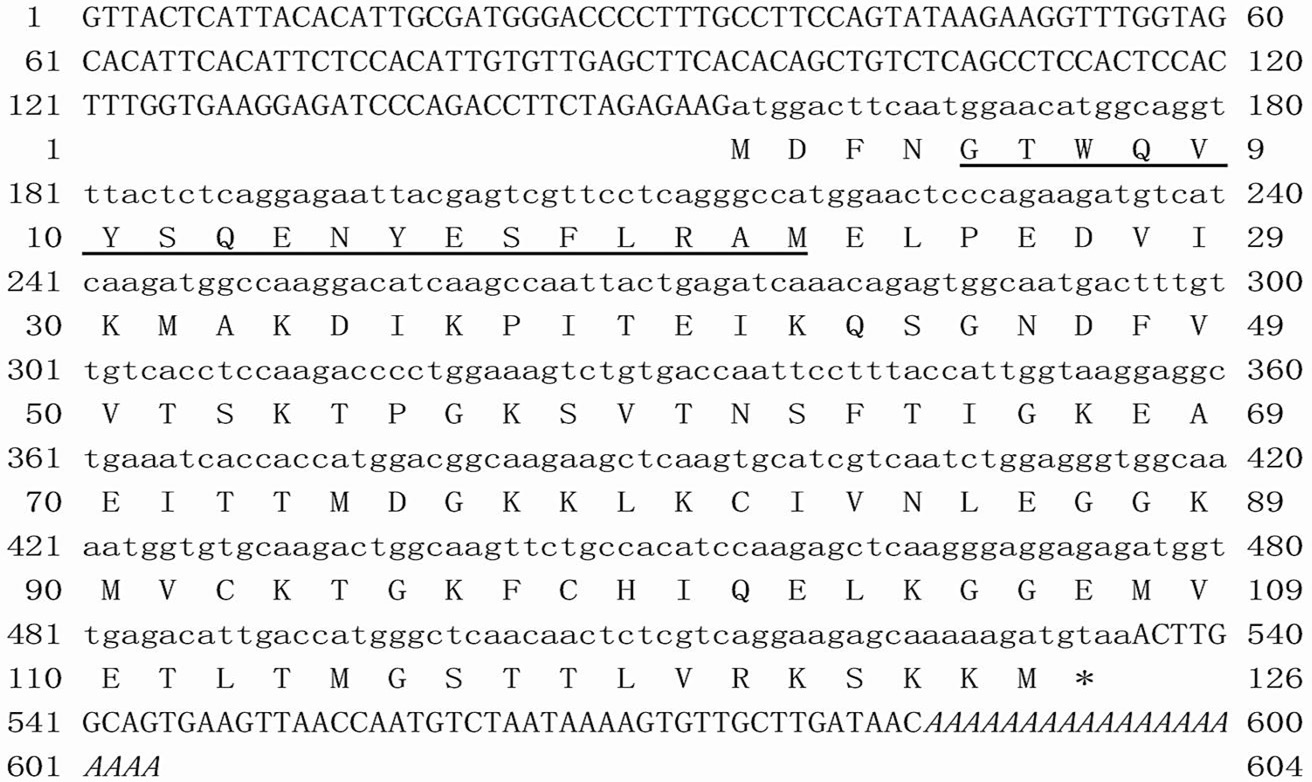
Nucleotide sequence and deduced amino acids of liver-type fatty acid binding protein (L-FABP) gene from T. ovatus (Linnaeus, 1758). Cytosolic fatty-acid binding proteins signature was underlined.
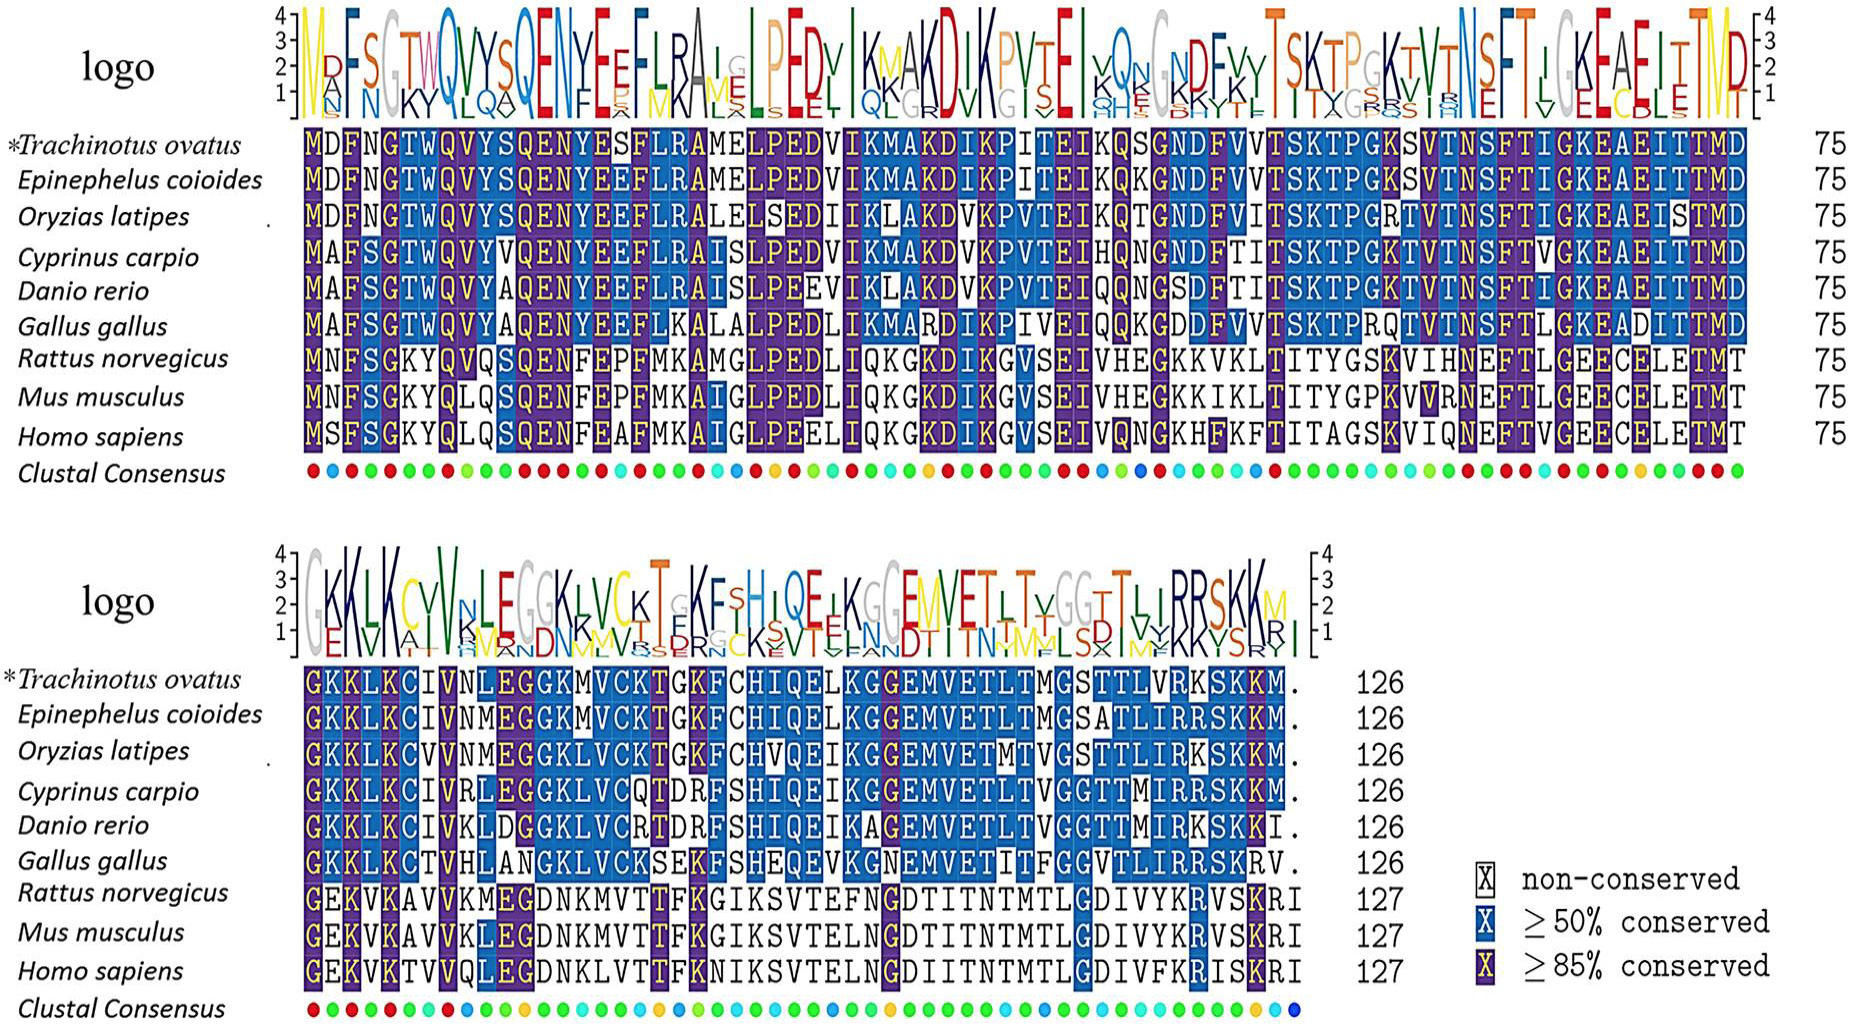
Multiple sequence alignment of the deduced amino acid sequence of L-FABP with other known homologous H-FABP amino acid sequence.

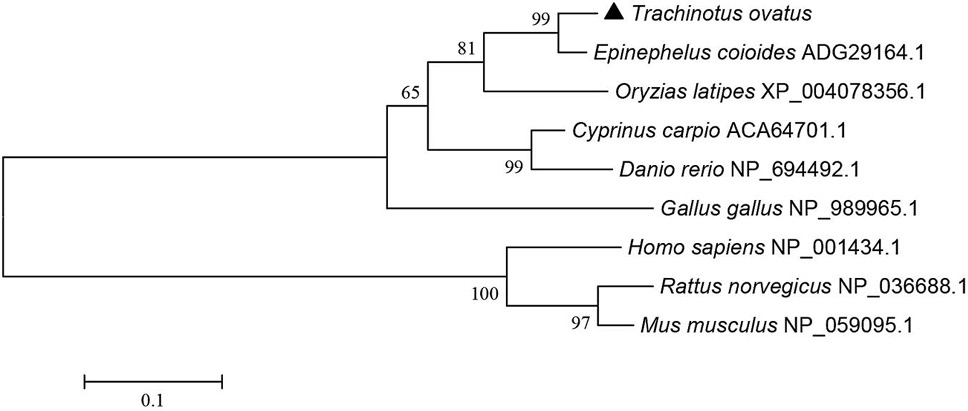
Phylogenetic analyses of L-FABP. Alignment of amino acid sequences were produced by Clustal W, and the bootstrap neighbor-joining phylogeny tree was constructed by MEGA 5.03. GenBank accession numbers encoding L-FABP are showed in Table I.
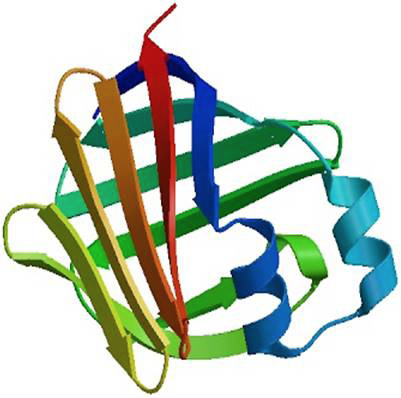
Predicted tertiary structure of T. ovatus L-FABP.

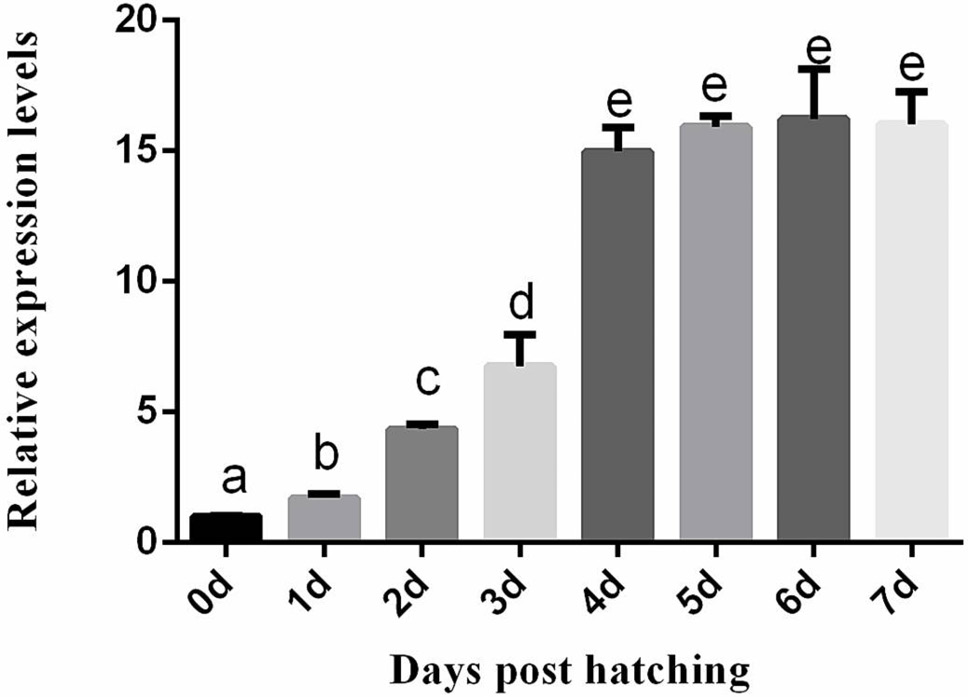
Relative expressions of L-FABP was detected by quantitative RT-PCR analysis after 0d, 1d, 2d, 3d, 4d, 5d, 6d and 7 day post hatching. Each Bar represent the mean ± SD (n=3). Different lowercase letters indicate statistically significant differences (P<0.05).
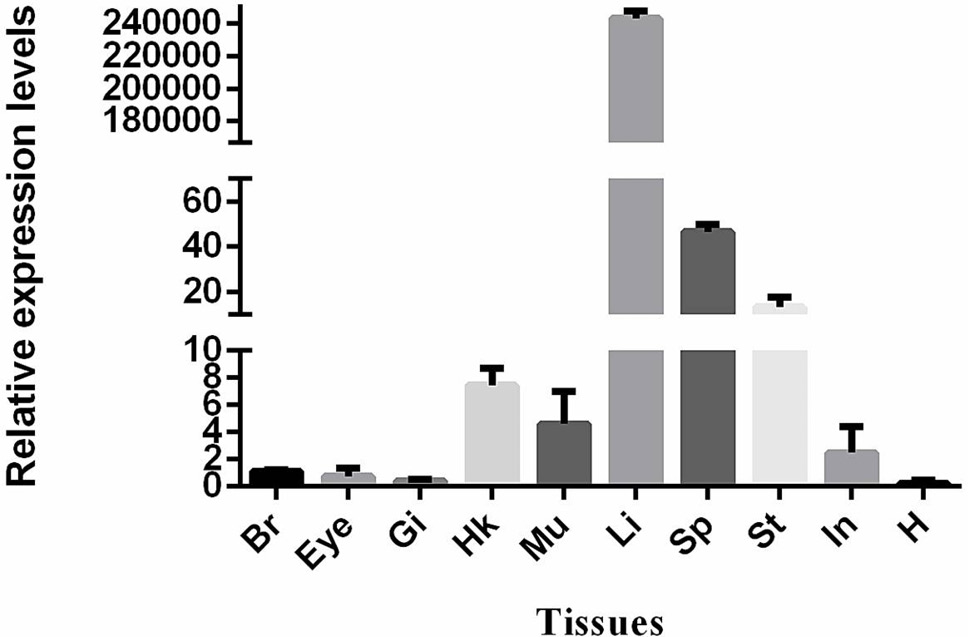
Relative expressions of L-FABP in different brain (Br), gills (Gi), head-kidney (Hk), spleen (Sp), eye (Eye), intestine (In), stomach (St), liver (Li), muscle (Mu) and heart (H), by quantitative RT-PCR analysis. Each Bar represent the mean ± SD (n=3). Different lowercase letters indicate statistically significant differences (P<0.05).
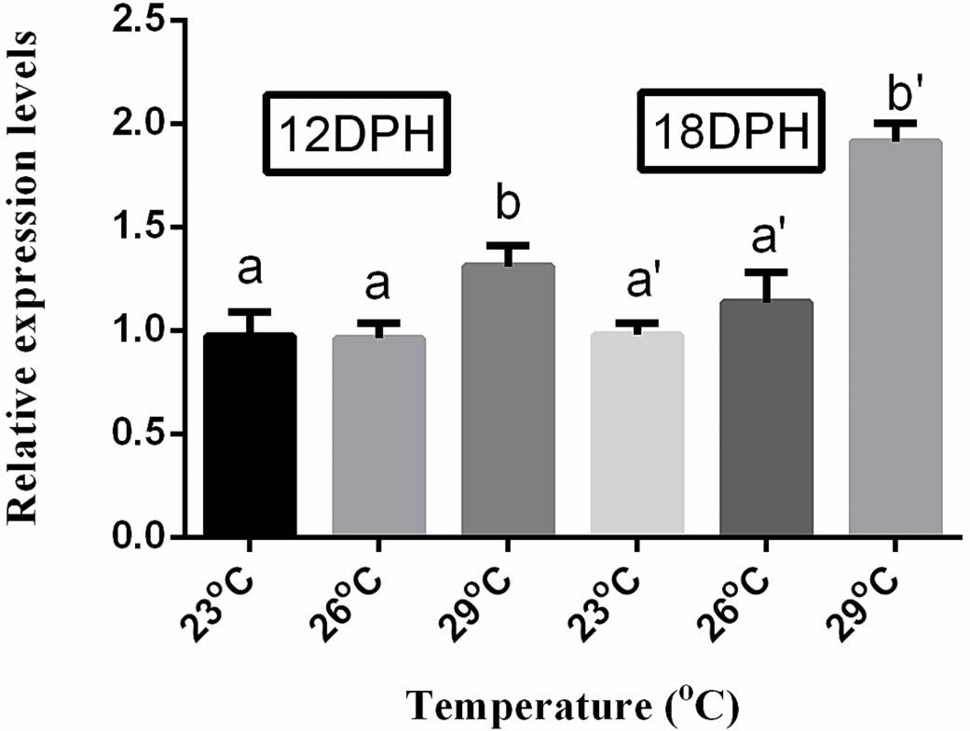
T. ovatus larvae was treated in 23°C, 26°C and 29°C, respectively. The left side of 12DPH represents the experimental T. ovatus larvae was on 12 days post hatching, the right side of 18DPH represents the experimental T. ovatus larvae was on 18 days post hatching. Each Bar represent the mean ± SD (n=3). Different lowercase letters indicate statistically significant differences (P<0.05).

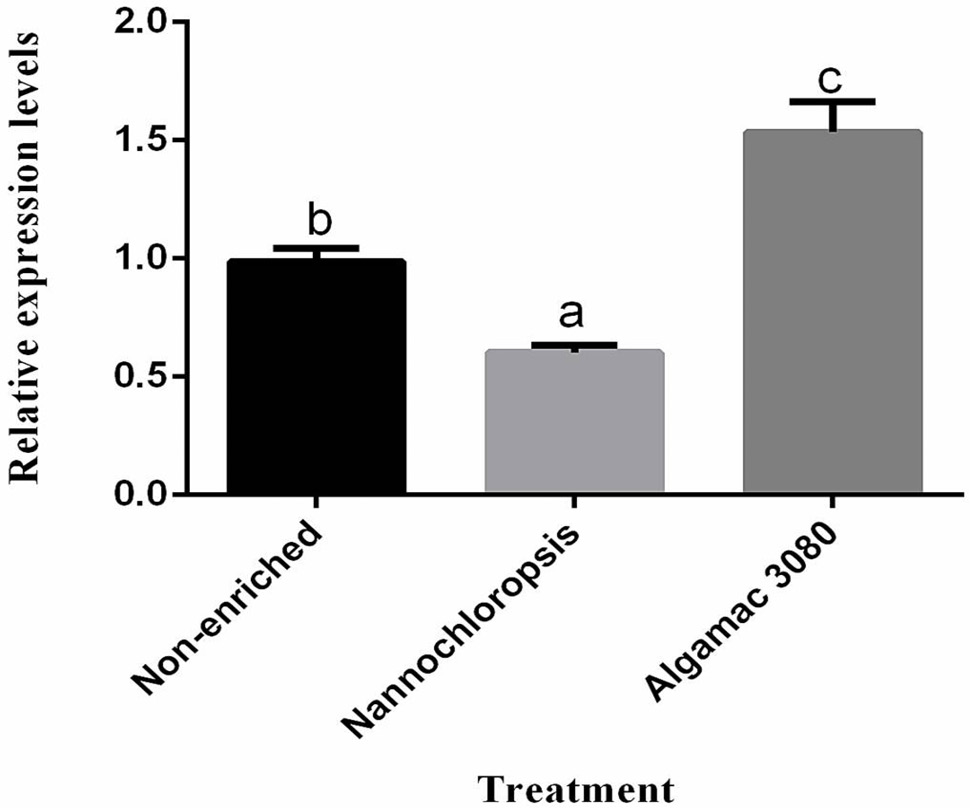
Relative expression levels of L-FABP gene of T. ovatus under enriched instant microalgal paste (Nannochloropsis), Algamac3080 and non-enriched. Each Bar represent the mean ± SD (n=3). Different lowercase letters indicate statistically significant differences (P<0.05).

