

Spotting rs112445441 in Non-Hodgkin Lymphoma: Another Clue for the Context-Dependent Crosstalk between RAS-MAPK and PI3K Mediated Pathways


Spotting rs112445441 in Non-Hodgkin Lymphoma: Another Clue for the Context-Dependent Crosstalk between RAS-MAPK and PI3K Mediated Pathways
Bibi Nazia Murtaza1, Mazhar Saeed Chaudry2, Shamaila Inayat Nadeem1, Muhammad Shahid Nadeem3 and Abdul Rauf Shakoori4,*
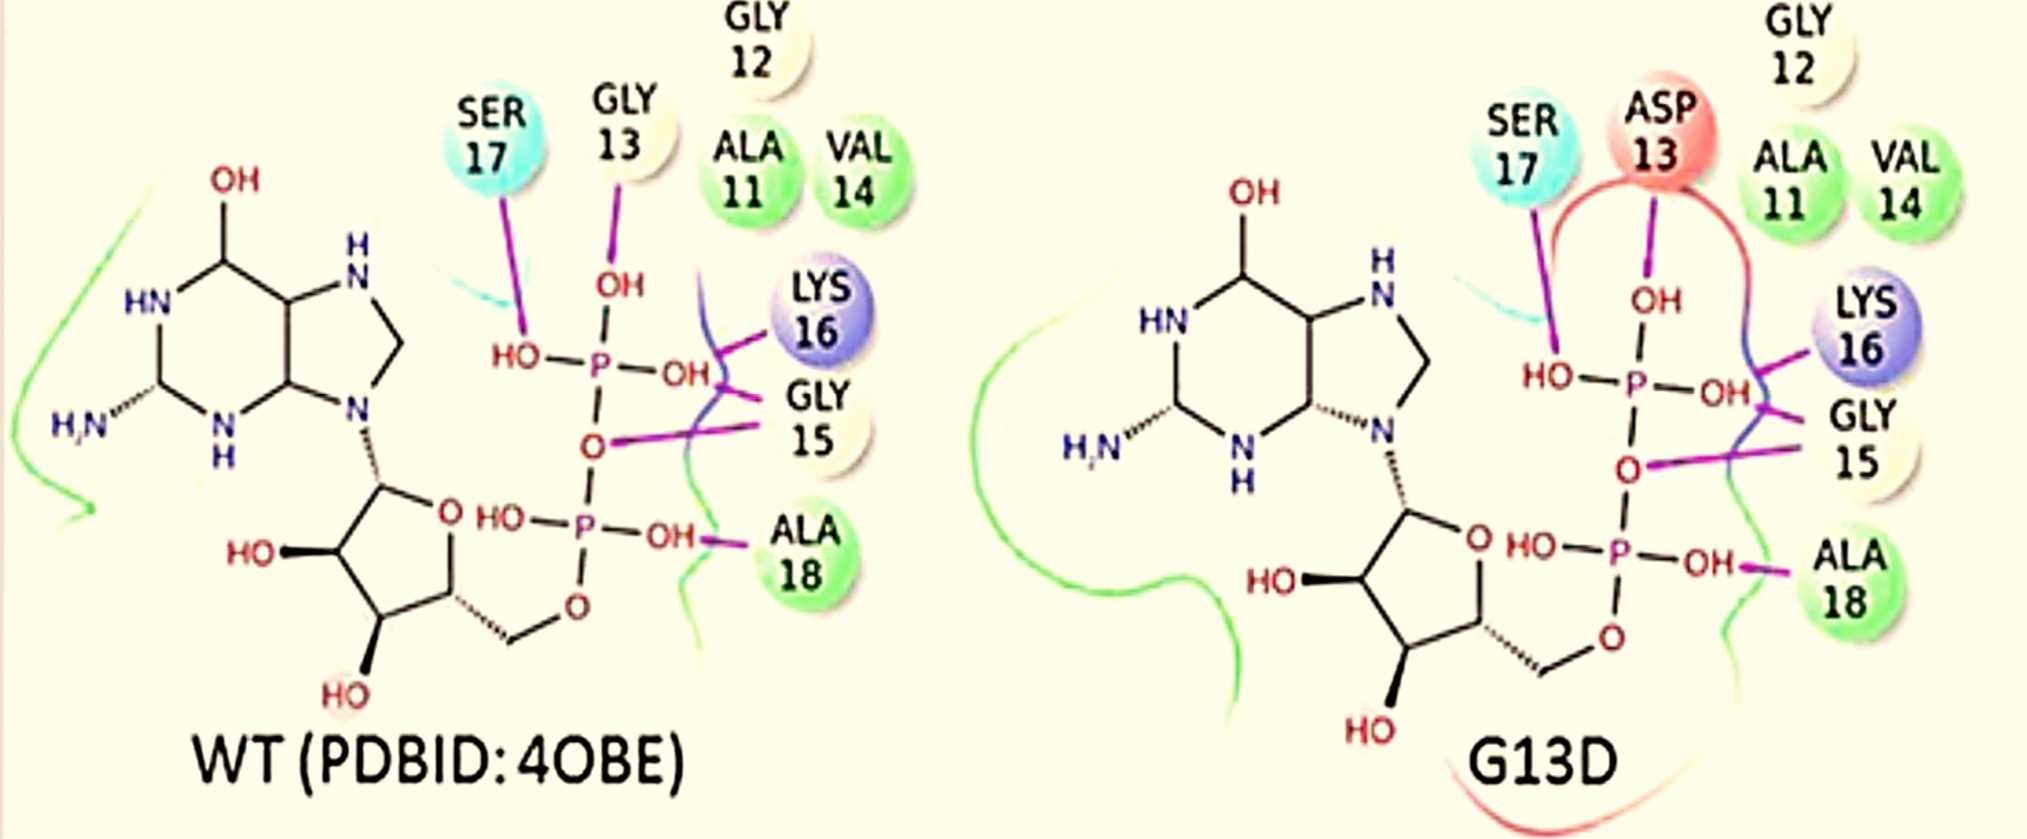
Scheme of Hydrogen bonding between β-phosphate of GDP and backbone of P-loop (residues 13–17) in WT (left) and G13D (right) (Figure adapted from Lu et al., 2015). RAS family is direct or indirect regulator of complex signalling mechanism like, RAS-ERK-MAPK, PI13K, ral guanine nucleotide dissociation stimulator (RALGDS) and protein kinase C (PKC) etc. (Khan et al., 2018), hence involved in plethora of molecular activities associated with normal cellular functions.

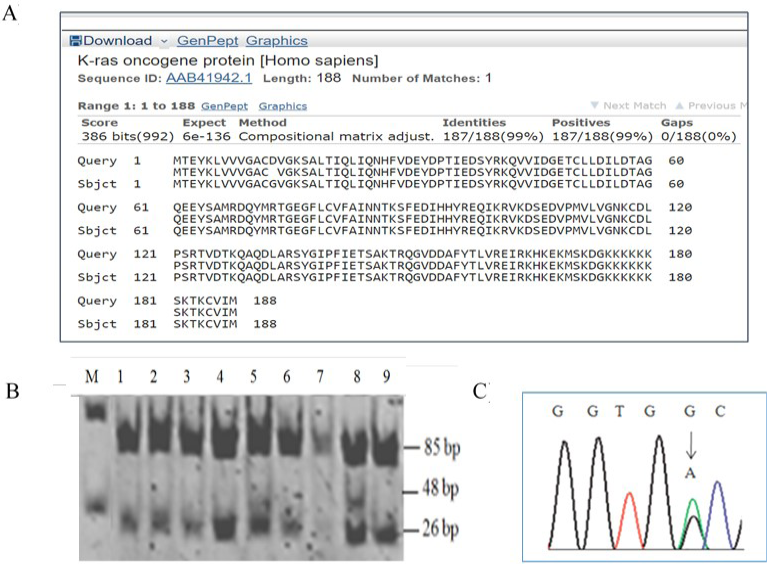
A, Sequence alignment by BLAST; B, 12 % Acrylamide: bisacrylamide electrophoresis photograph showing DNA fragment containing codon 13 after restriction. Sample lanes 1-7 and 9, wild type; lane 8, NHL (heterozygous mutant); and lane M is 50 bp DNA marker (Fermentas); C, Sequencing shwoing GGC (glycine) to GAC (aspartic acid).
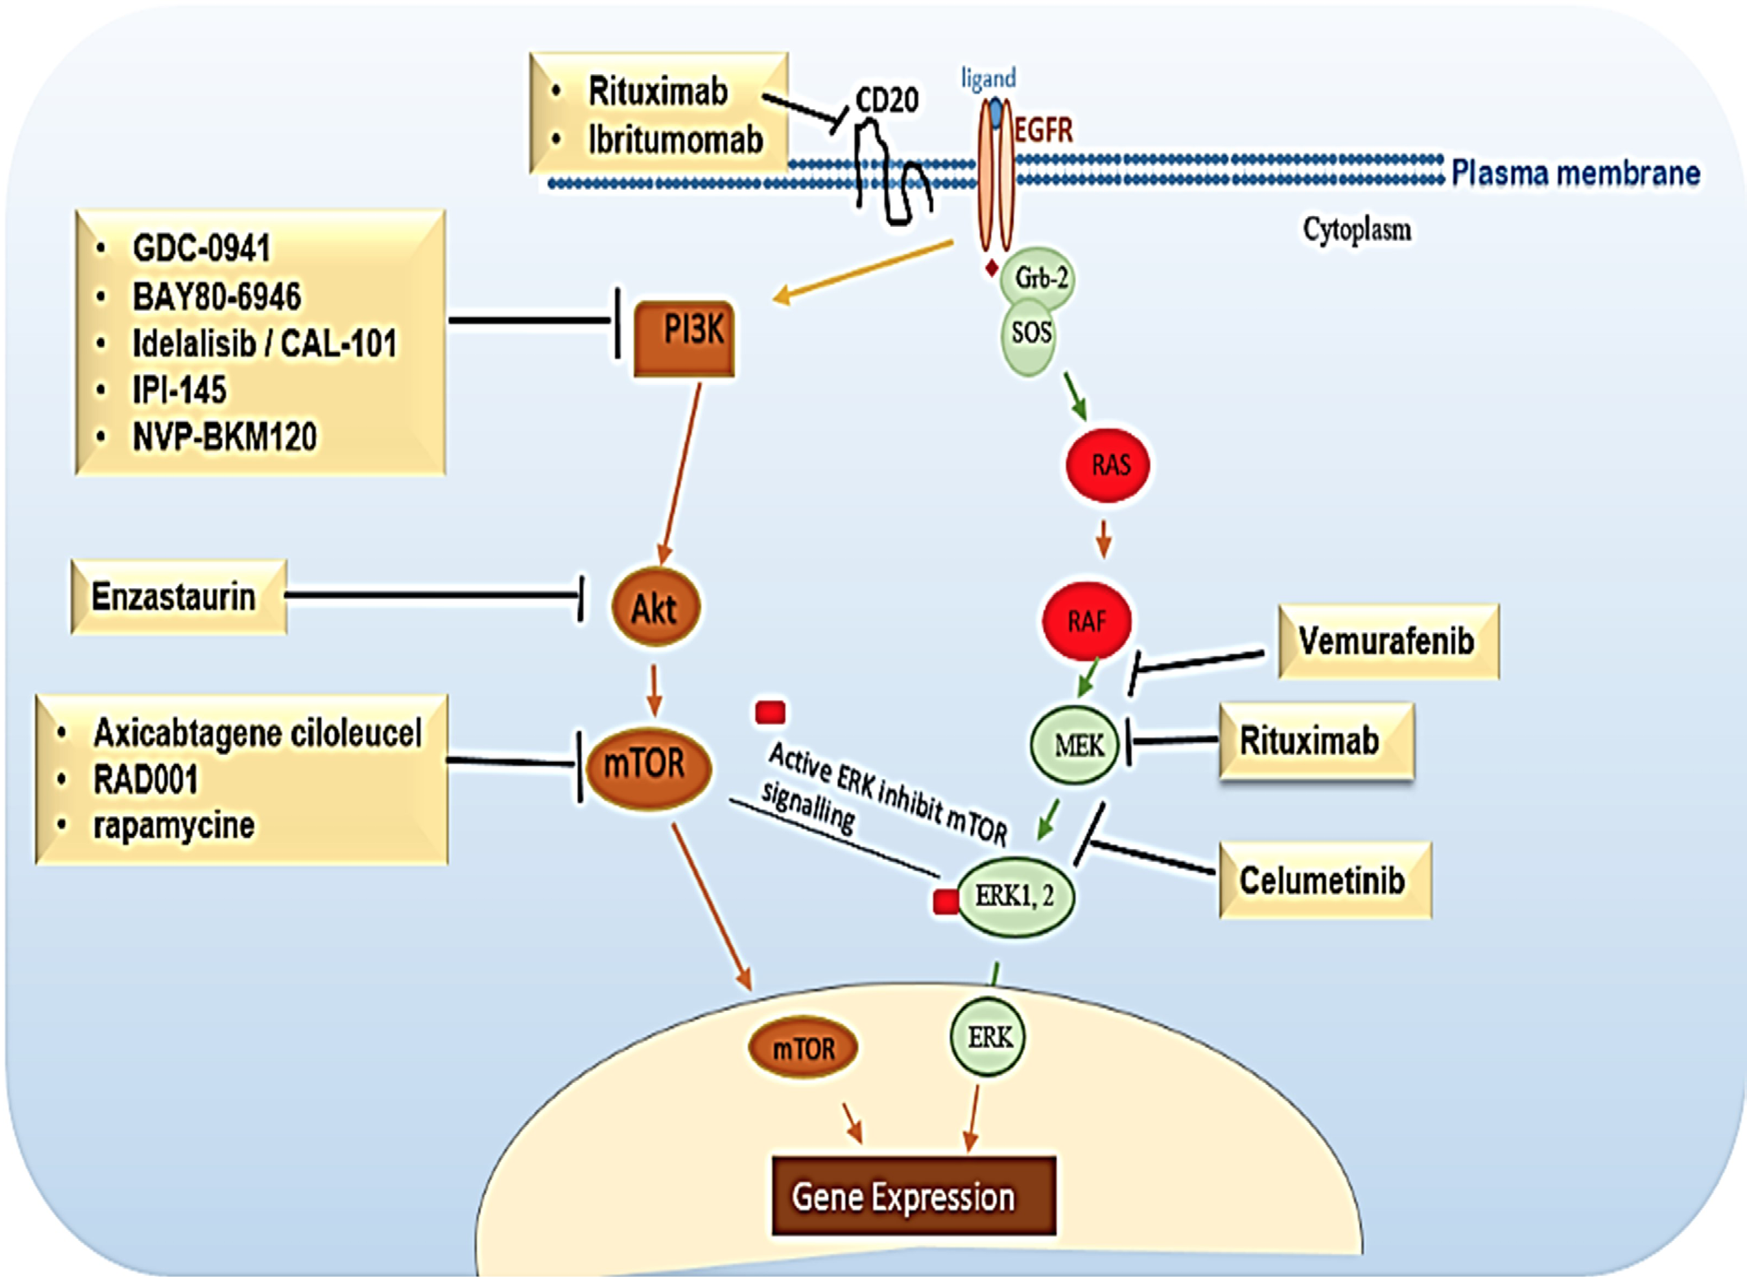
Context-dependent crosstalk between RAS-MAPK and PI3K mediated pathways. (Figure adapted).
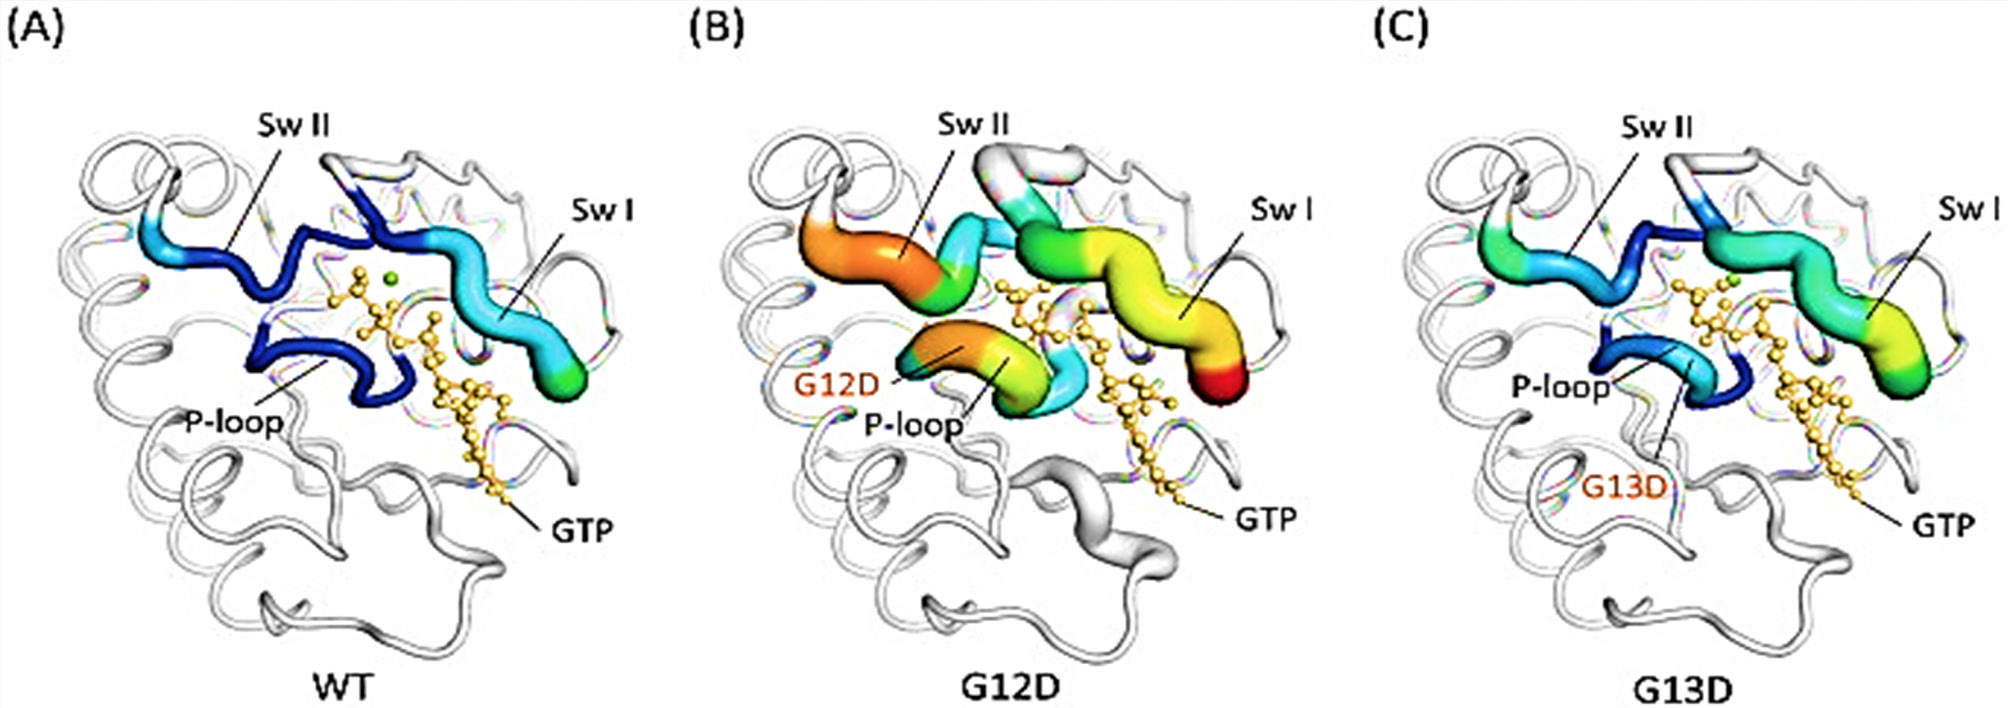
The structures of (A) WT, (B) G12D and, (C) G13D KRAS proteins are drawn in cartoon putty representations at the P-loop, switch I and II regions; blue represents the lowest and red the highest B-factor value. In addition, the size of the tube reflects the value of the B-factor, in that the larger the B-factor, the thicker the tube. The structures in the other regions are coloured in white and displayed in cartoon tube representation, where the size of the tube is independent of the B-factors (Figure adapted from Chen et al., 2013).

