

Structural-Functional Characterization of Cytochrome b in bc1 and b6 f Complexes along with Polymorphic Analysis


Structural-Functional Characterization of Cytochrome b in bc1 and b6 f Complexes along with Polymorphic Analysis
Mohsin Shad1, Muhammad Usman2 and Qurratulann Afza Gardner1*
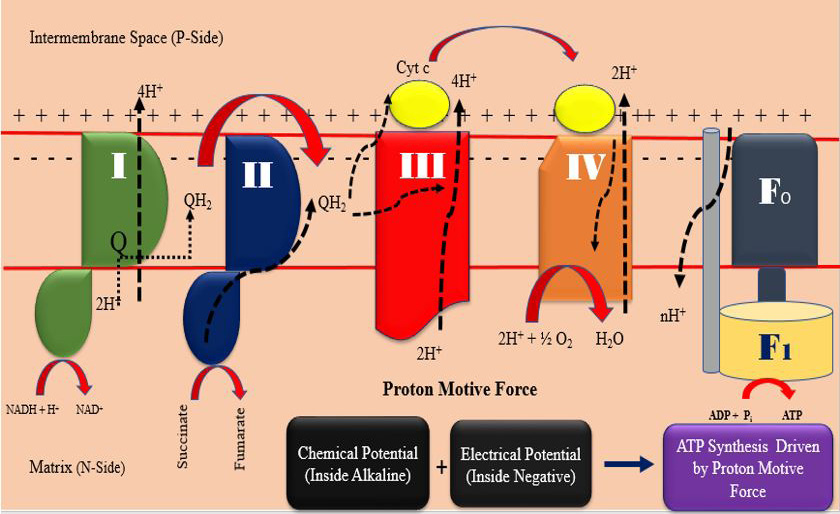
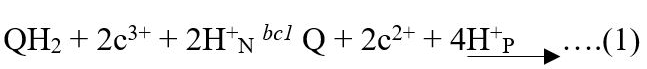
ATP production mechanism at mitochondrial electron transport chain (drawn by the authors).

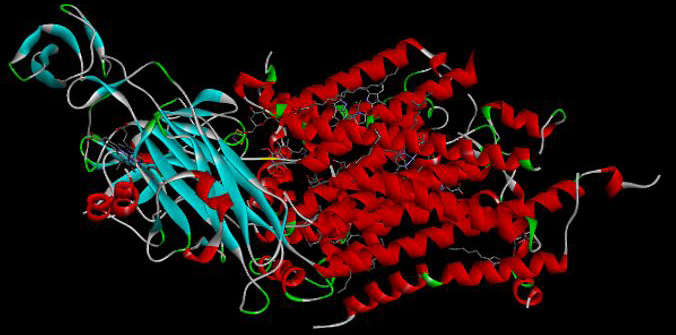
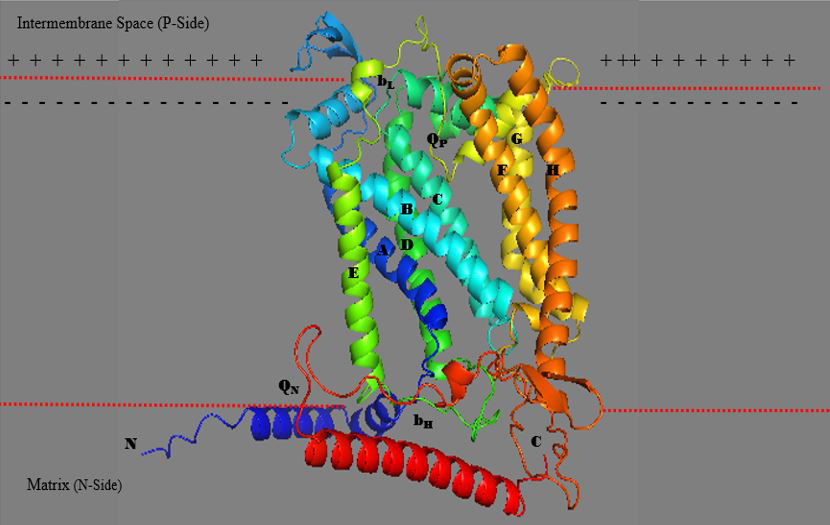
3D structure of chloroplast cytochrome b6f complex in Chlamydomonas reinhardtii. Adapted from Protein Data Bank (1Q90) from (https://www.ncbi.nlm.nih.gov/Structure/pdb/1Q90).

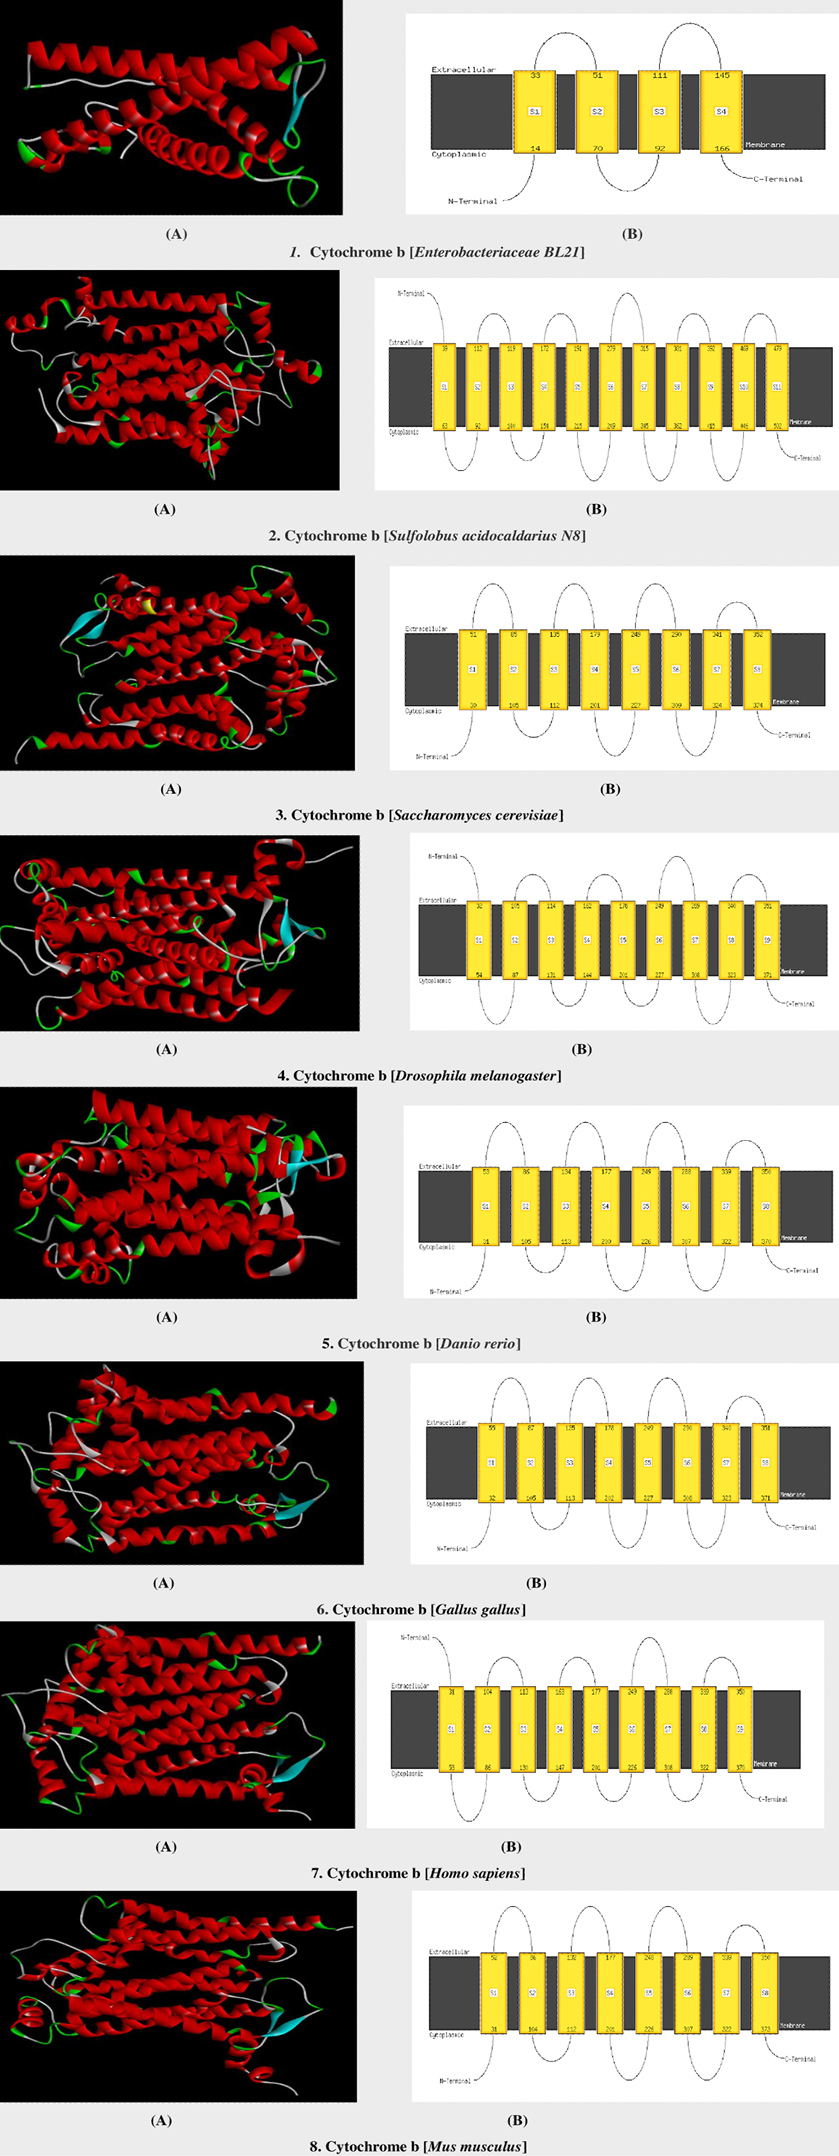
3D models and schematic diagram of mitochondrial cytochrome b protein in selected model organisms. A, 3D models and B, the schematic diagram of alpha-helices in selected model organisms.
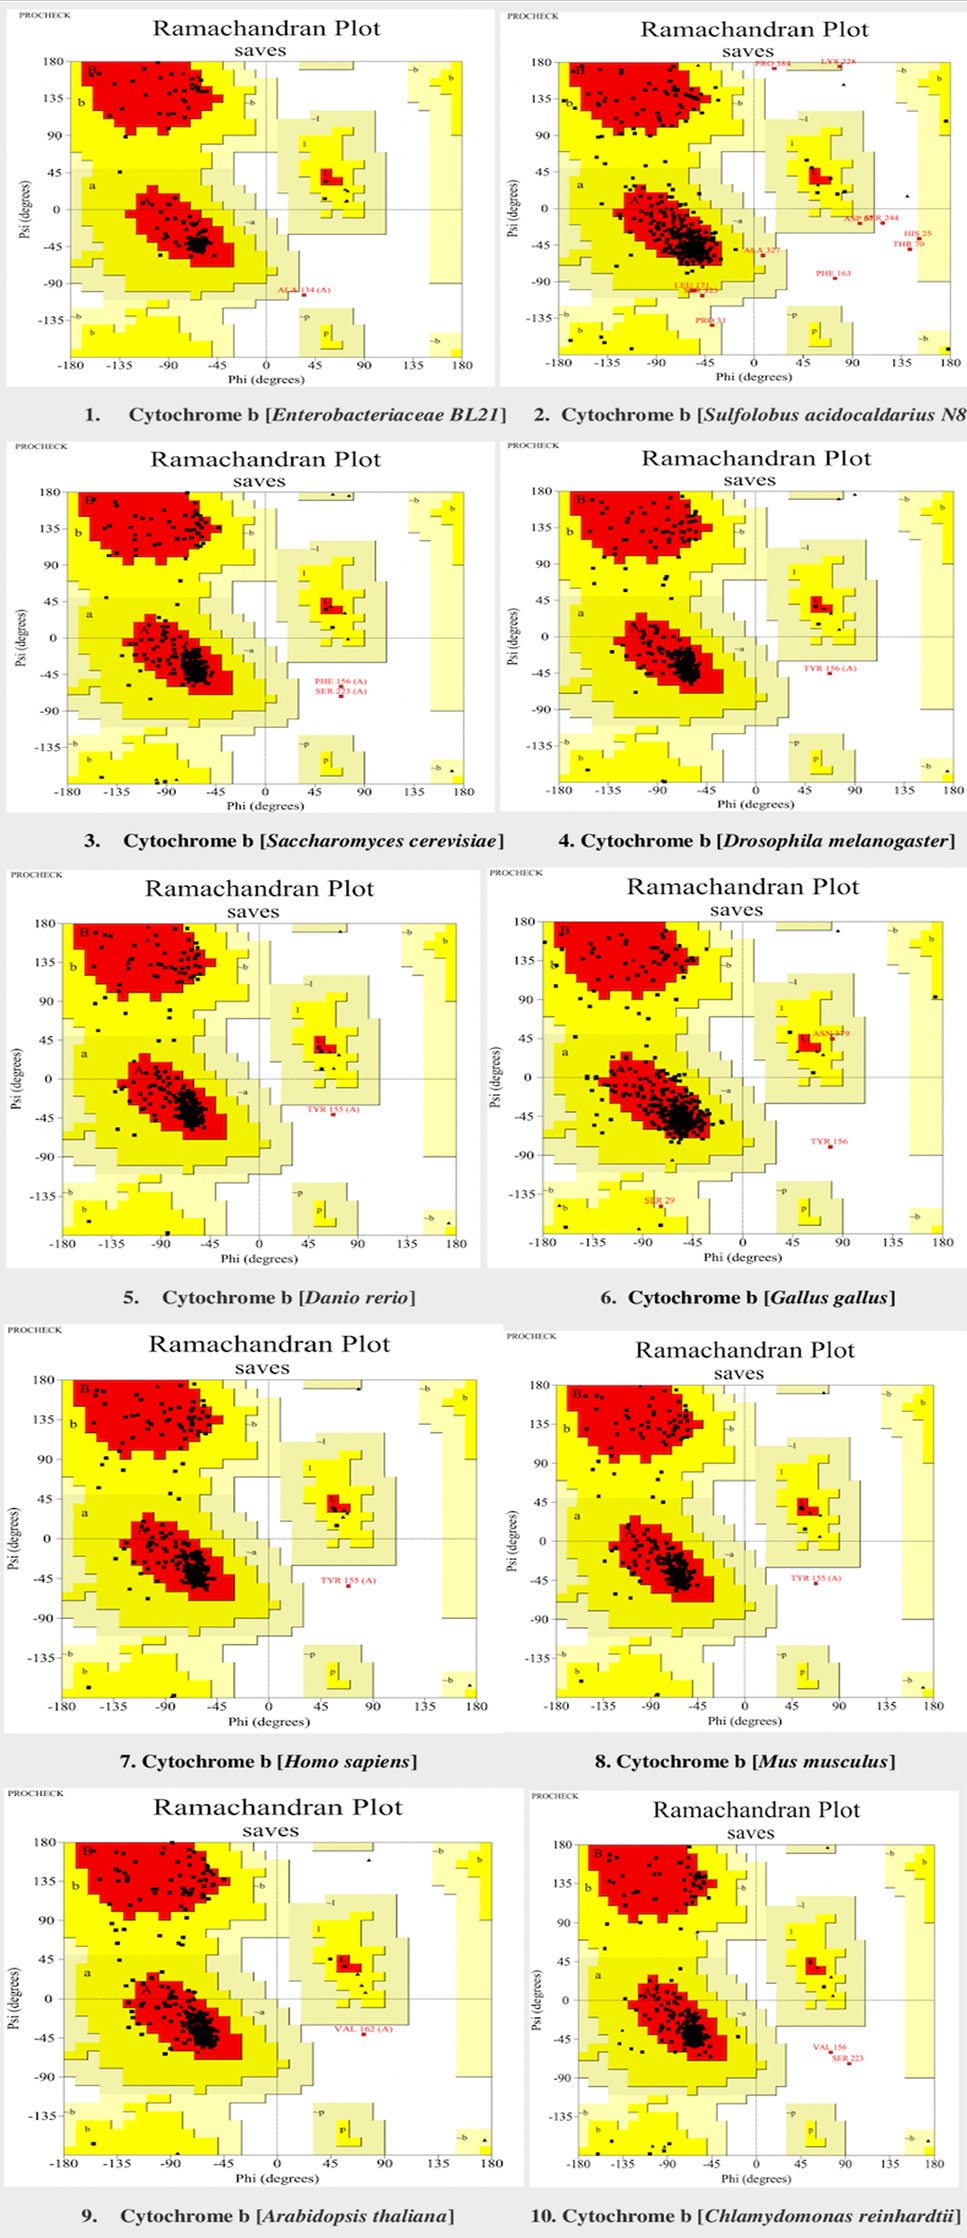
Verification of cytochrome b models in selected model organisms through Ramachandran plot. Red colour showed the most favoured region (A, B, L). Yellow colour shows the additional allowed region (a, b, l, p). Generally allowed region (~a, ~b, ~l, ~p) is highlighted in light yellow colour. The Ramachandran plots were generated through procheck tool.

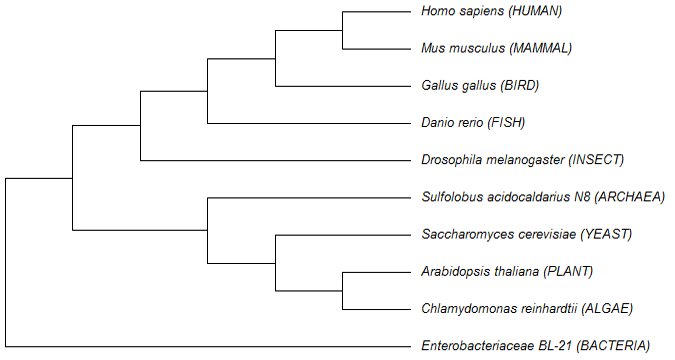
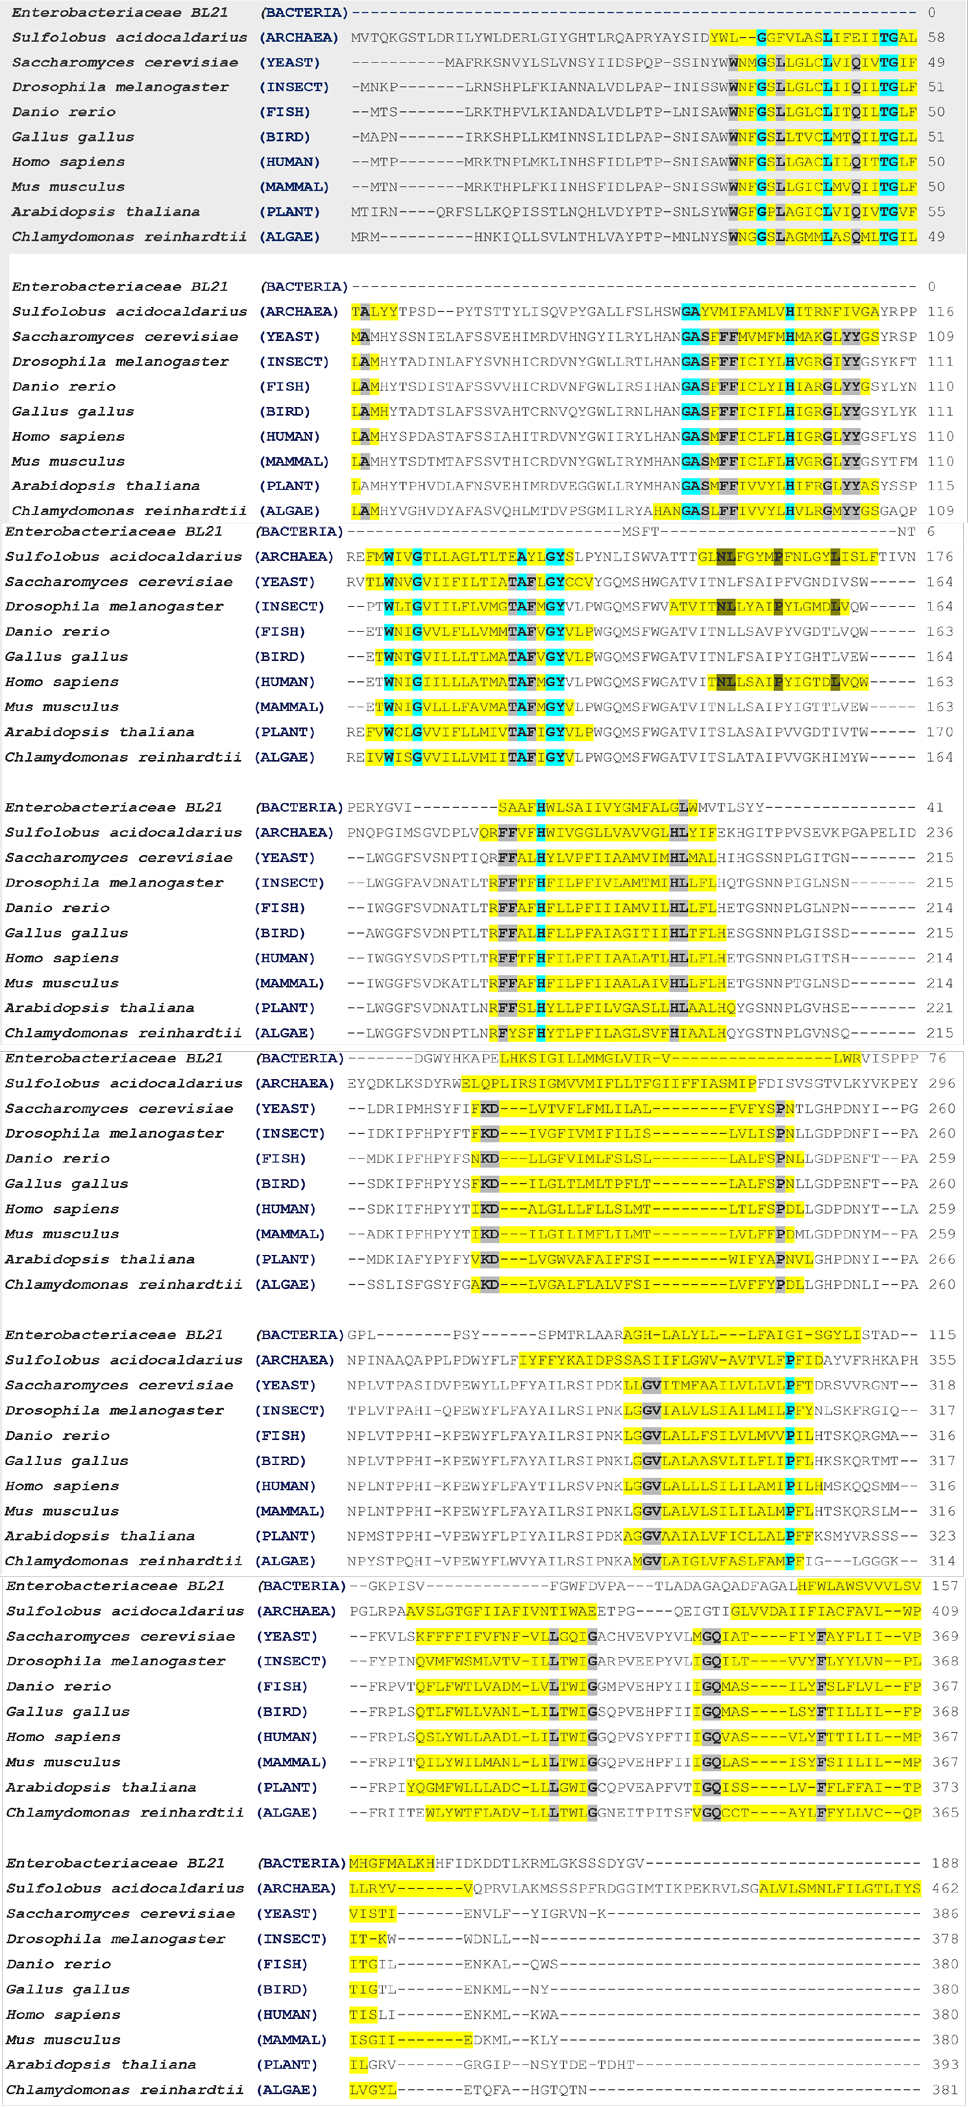
Multiple sequences alignment of cytochrome b protein in the model organism. Transmembrane alpha-helices in model organisms are highlighted in yellow colour. The conserved residues in archaea and eukaryotic are highlighted with turquoise colour. The eukaryotic conserved residues are highlighted with Gray colour. The dark yellow colour indicates the conserved residues in the high number of transmembrane alpha-helices model organisms. The MSA were performed through the online available Clustal Omega tool (https://www.ebi.ac.uk/Tools/msa/clustalo).

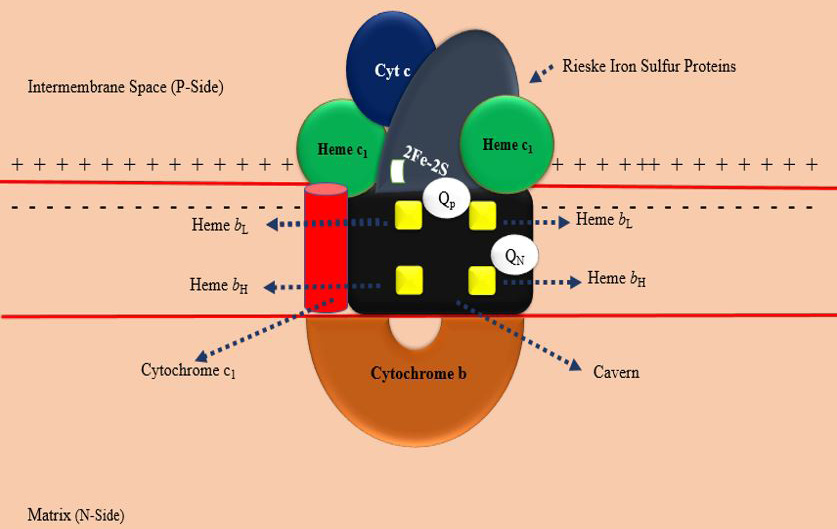
Structure of mitochondrial cytochrome b in bc1 complex (drawn by the authors).
3D structure of mitochondrial cytochrome b in Mycobacterium tuberculosis bc1 complex (drawn by the authors).

