
Immunological Responses of Chitosan and Aluminum Phosphate Nanoparticles as Novel Adjuvants for Inactivated Rift Valley Fever Vaccine in Sheep


Immunological Responses of Chitosan and Aluminum Phosphate Nanoparticles as Novel Adjuvants for Inactivated Rift Valley Fever Vaccine in Sheep
Mohamed A. Hussein1, Bahgat A. Abd El-Rehman2, Kareem A. Eldin2, Mohamed Fouad Mansour1*

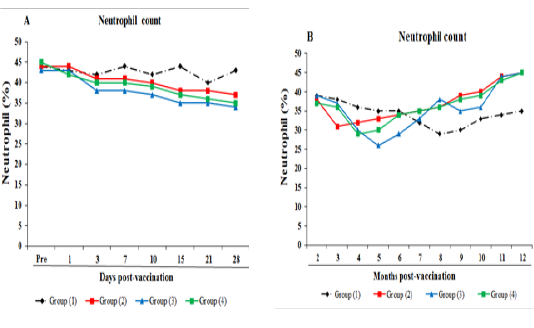
Serum neutrophilic count concentration in experimental sheep inoculated with various forms of RVF vaccines. (A) Serum neutrophilic count from pre day till 28th days after inoculation, (B) Serum neutrophilic count from 2nd month till 12th month of inoculation. The data expressed as mean ± SEM, p<0.05. G1: Control negative, G2: Sheep inoculated with AlHV, G3: Sheep inoculated with Ch-NPsV, G4: Sheep inoculated with AlP-NPsV.

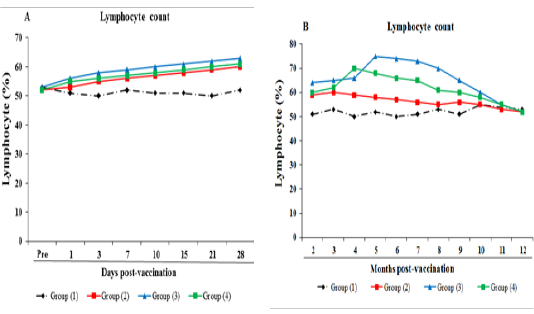
Serum lymphocytic count in experimental sheep inoculated with various forms of RVF vaccines. (A) Serum lymphocytic count from pre day till 28th days of inoculation. (B) Serum Lymphocytic count from 2nd month till 12th month of inoculation. The data expressed as mean SEM, p<0.05. G1: Control negative, G2: Sheep inoculated with AlHV, G3: Sheep inoculated with Ch-NPsV, G4: Sheep inoculated with AlP-NPsV.

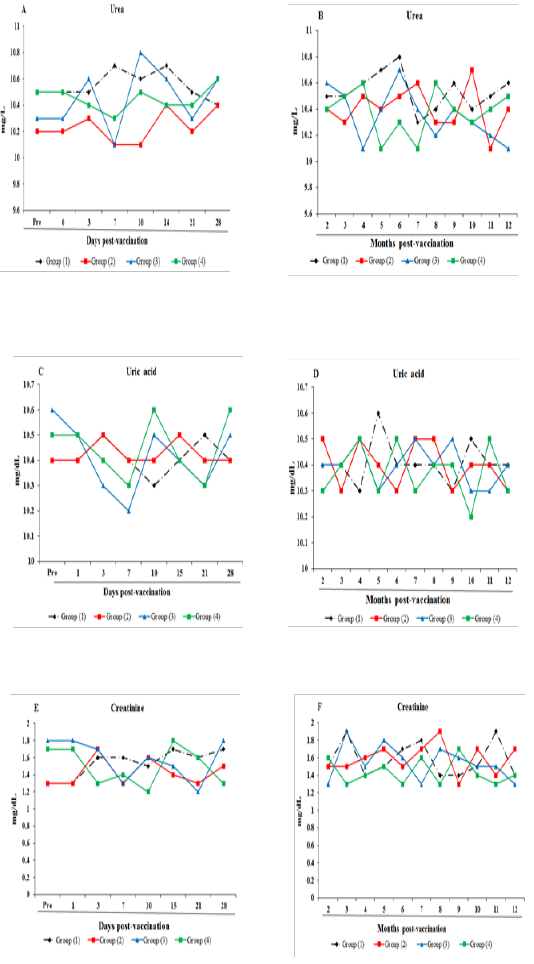
Serum biochemical analysis in experimental sheep inoculated with various forms of RVF vaccines. (A) Serum urea concentration from pre day till 28th day of inoculation, (B) Serum urea concentration from 2nd month till 12th month of inoculation, (C) Serum uric acid from pre day till 28th day of inoculation, (D) Serum uric acid from 2nd month till 12th month of inoculation, (E) Serum creatinine from pre day till 28th day of inoculation, (F) Serum creatinine from 2nd month till 12th months of inoculation. The data expressed as mean ± SEM, p<0.05. G1: Control negative, G2: Sheep inoculated with AlHV, G3: Sheep inoculated with Ch-NPsV, G4: Sheep inoculated with AlP-NPsV.
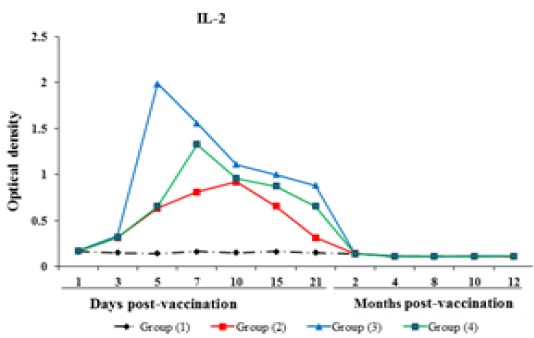
The cell proliferation expressed by optical density of IL-2 in experimental sheep inoculated with different forms of RVF vaccines from the 1st day till the 12th months of inoculation. The data expressed as mean ± SEM, p<0.05. G1: Control negative, G2: Sheep inoculated with AlHV, G3: Sheep inoculated with Ch-NPsV, G4: Sheep inoculated with AlP-NPsV.

Level of mRNA expression of IFN-γ by fold change in experimental sheep inoculated with various forms of RVF vaccines from 1st day till the 12th months of inoculation. The data expressed as mean ± SEM, p<0.05. G1: Control negative, G2: Sheep inoculated with AlHV, G3: Sheep inoculated with Ch-NPsV, G4: Sheep inoculated with AlP-NPsV.
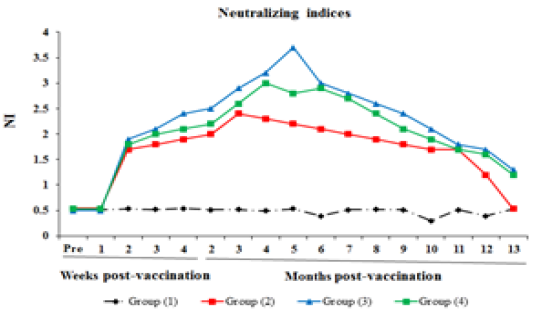
The mean neutralizing index in experimental sheep inoculated with various forms of RVF vaccines from pre (day before inoculation) till the 13th months after inoculation the data expressed as mean ± SEM, p<0.05. G1: Control negative, G2: Sheep inoculated with AlHV, G3: Sheep inoculated with Ch-NPsV, G4: Sheep inoculated with AlP-NPsV.
