

In Vitro Culture and Biological Characteristics of Sheep Amniotic Mesenchymal Stem Cells


In Vitro Culture and Biological Characteristics of Sheep Amniotic Mesenchymal Stem Cells
Tengfei Lu1, Wenhua Pei1, Shuang Zhang2, Yangnan Wu1, Fenghao Chen2, Xiao Han2 and Weijun Guan1,*
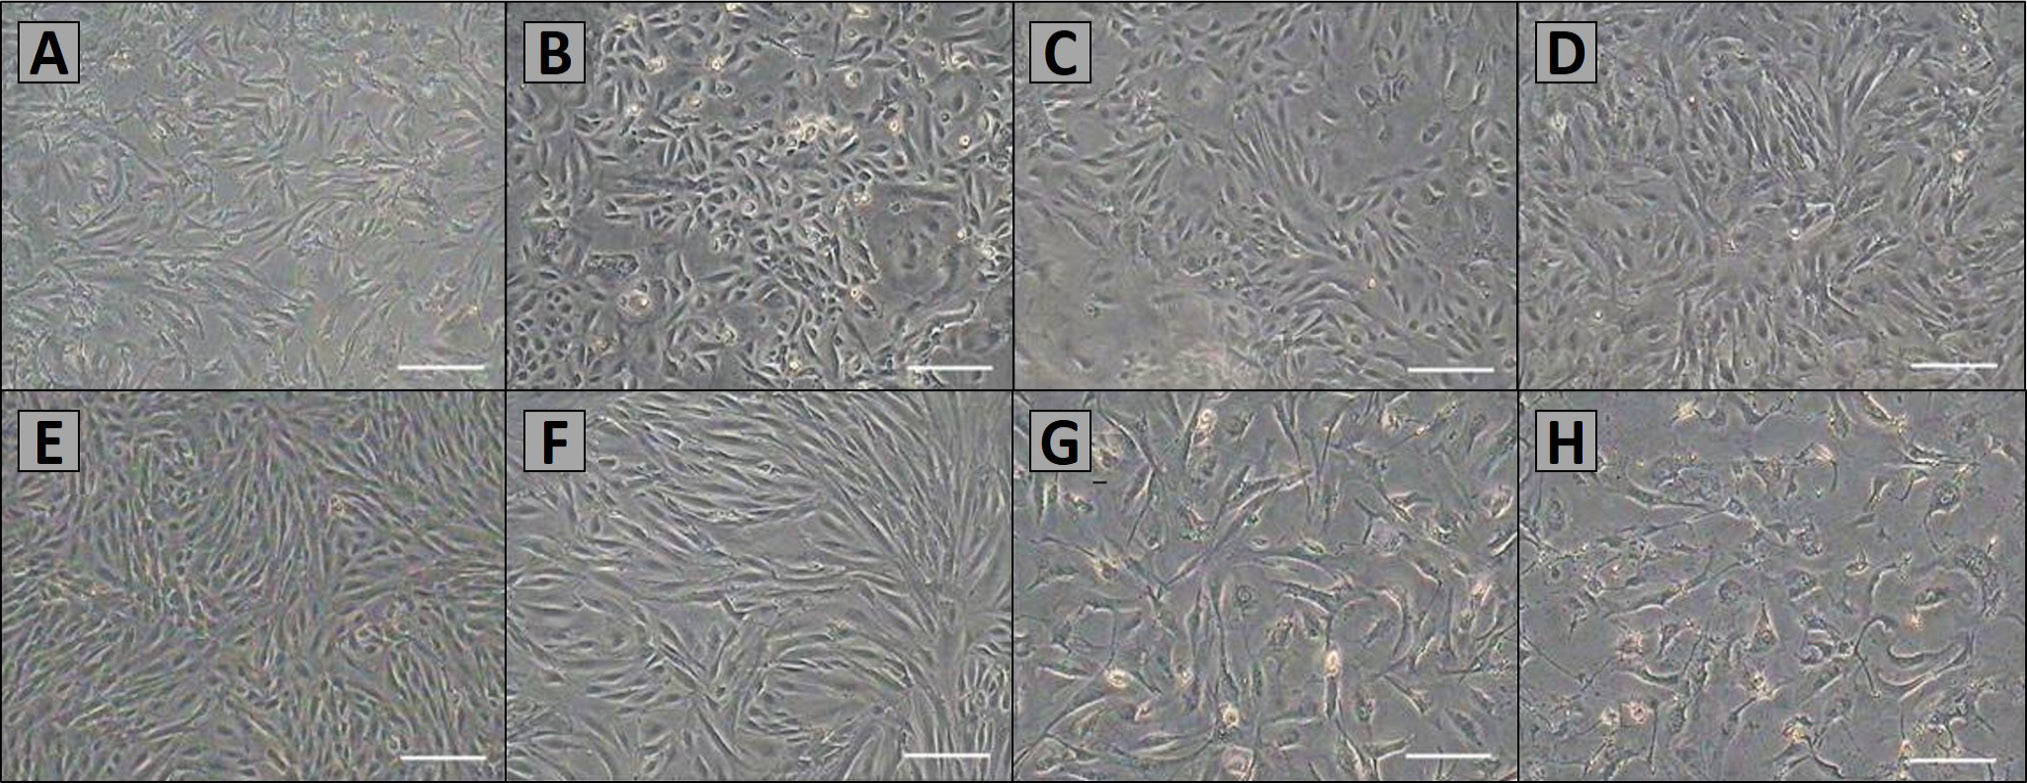
Morphology of primary and sub-cultured AMSCs. A, primary cells were cultured after 48 h. Most of cells began to adhere and stretch; B, AMSCs were cultured about 4 days, the cells grew to 70%–80% confluence; C, the cells of P1 were non-homogenous; D, after P5, AMSCs were purified, and there was apparently no difference in morphology among successive passages. AMSCs exhibited a fusiform pattern; E and F, morphology of P5, P10 and P15 AMSCs; G and H, the AMSCs of P24 and P25 displayed a typical senescence. Scale bar, 100μm.

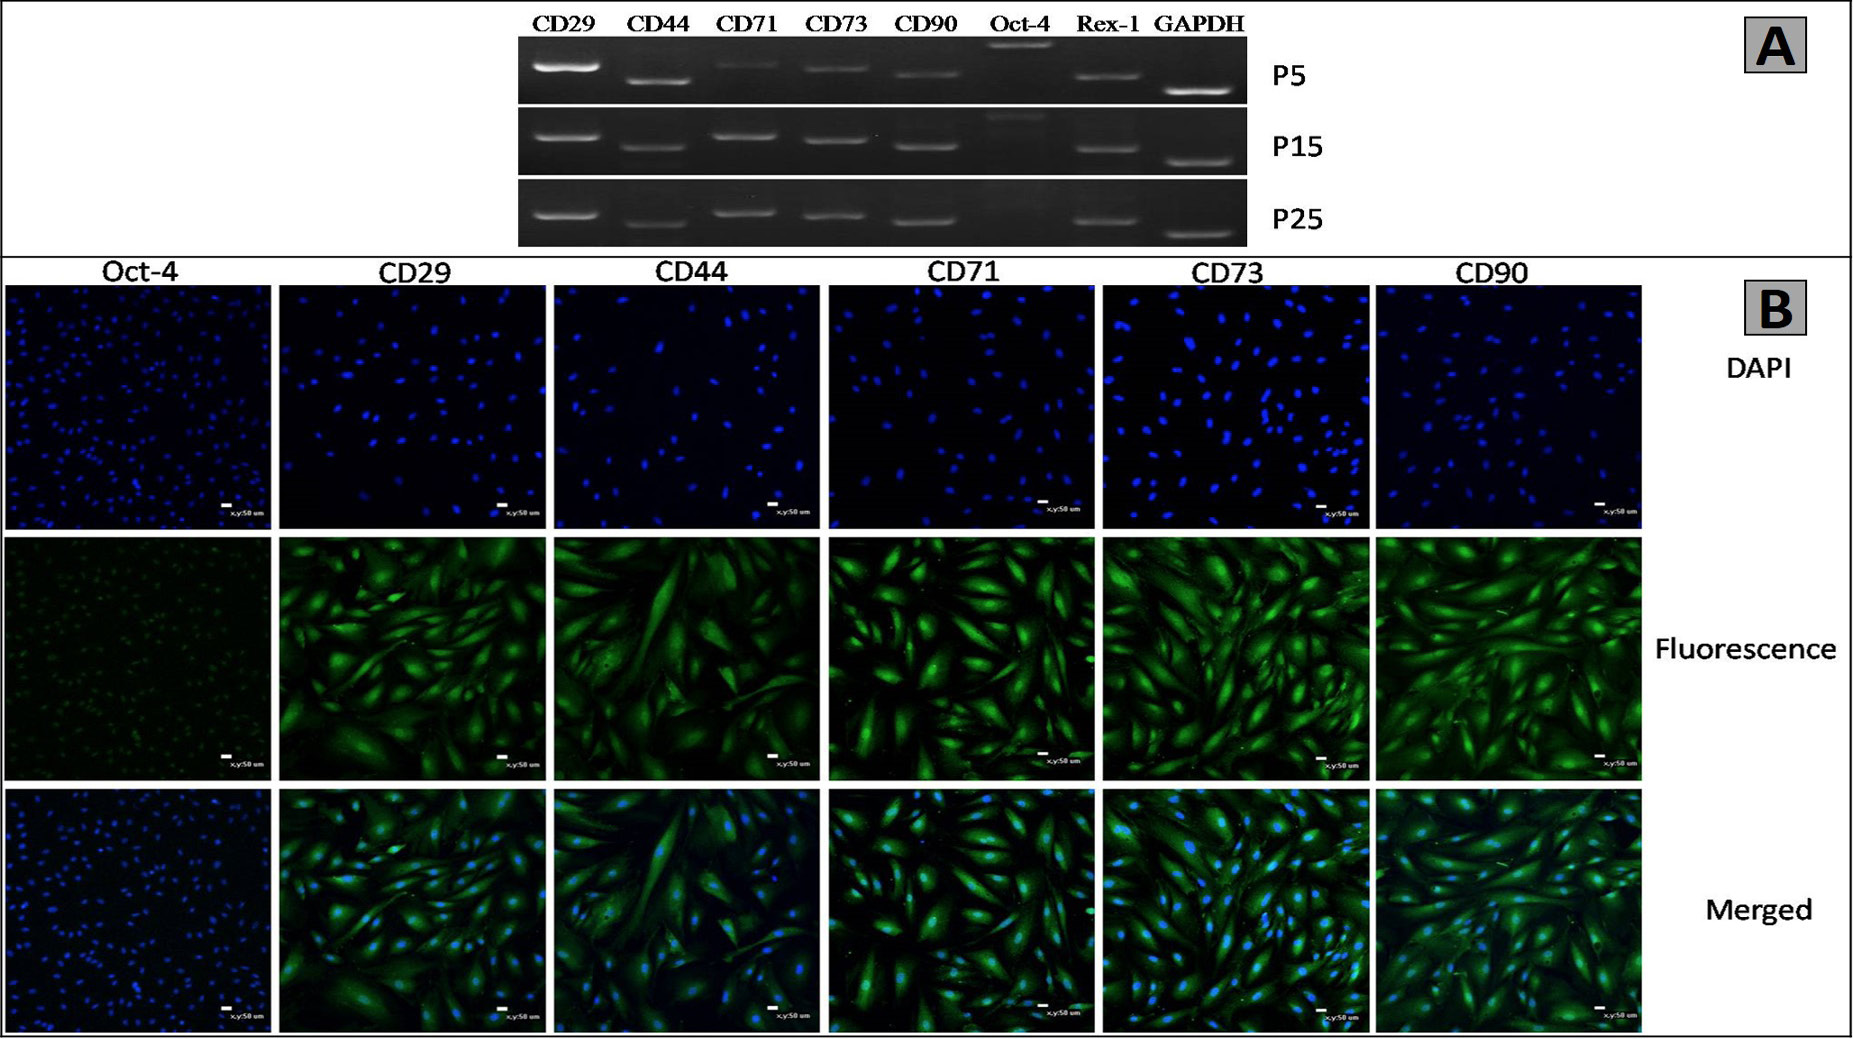
Specific markers of the AMSCs. Specific markers of the AMSCs are similar with BMSCs. Several surface markers of AMSCs were detected by RT-PCR and immunofluorescence. A, RT-PCR analysis exhibited that the AMSCs expressed CD29, CD44, Oct-4, CD71, Rex-1, CD90, and CD73. and GAPDH was used as an internal control; B, Immunofluorescence exhibited that the expression of CD44, CD29, CD71, Oct-4, CD73 and CD90 were positive. Scale bar, 50μm.

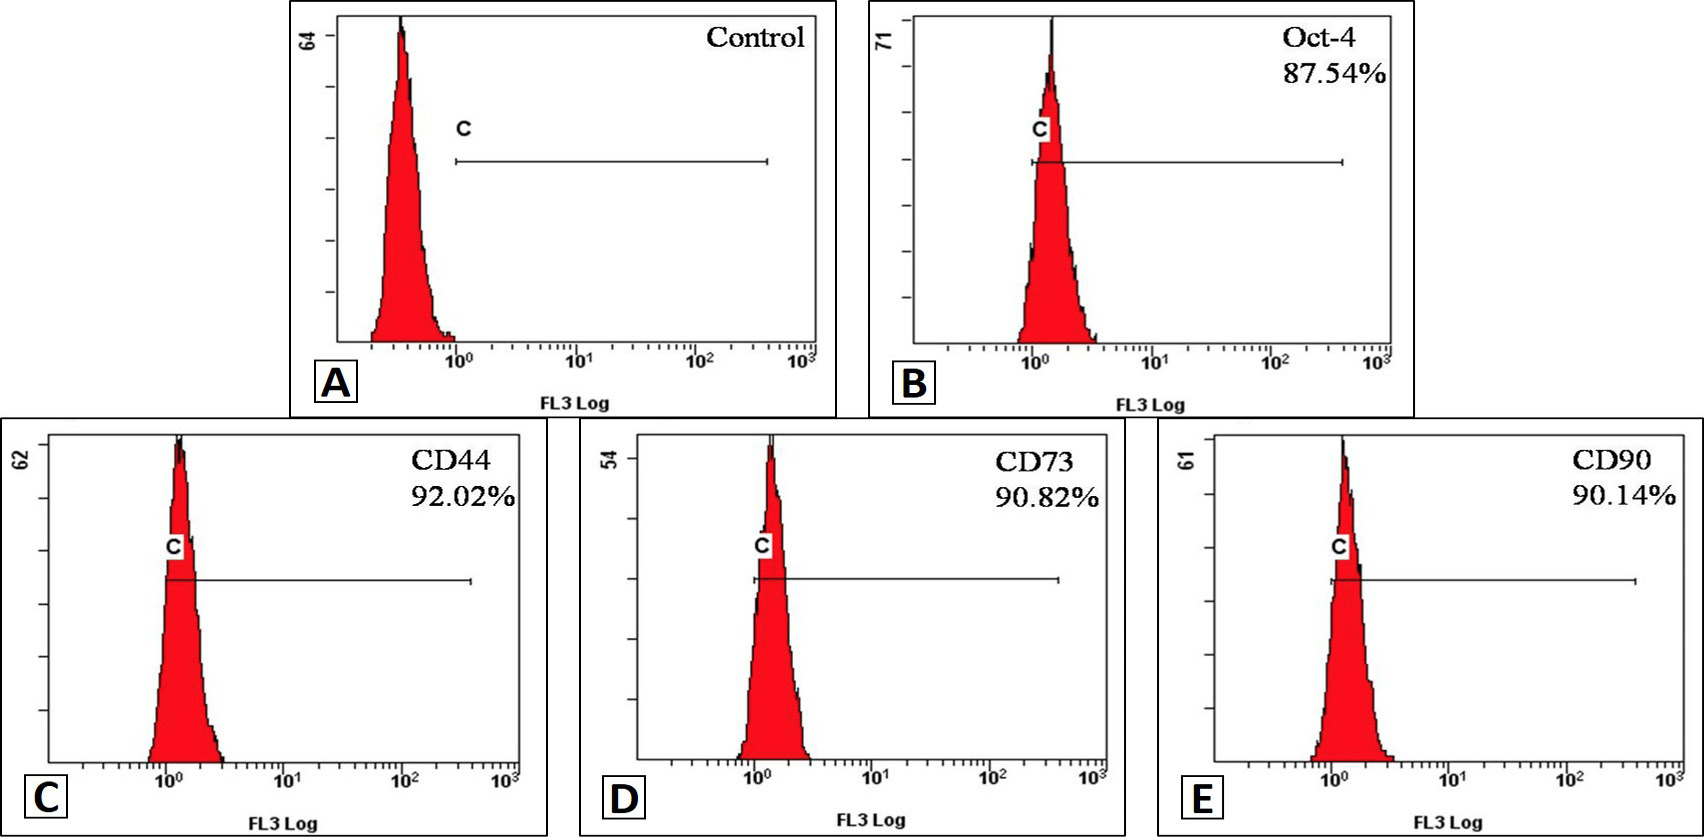
Flow cytometry analysis of AMSCs. Cell surface antigen of the AMSCs is similar with BMSCs. The expression of Oct-4, CD44, CD73 and CD90 were detected by flow cytometry. The result has shown that P5 of AMSCs were high expression for Oct-4, CD44, CD73 and CD90.
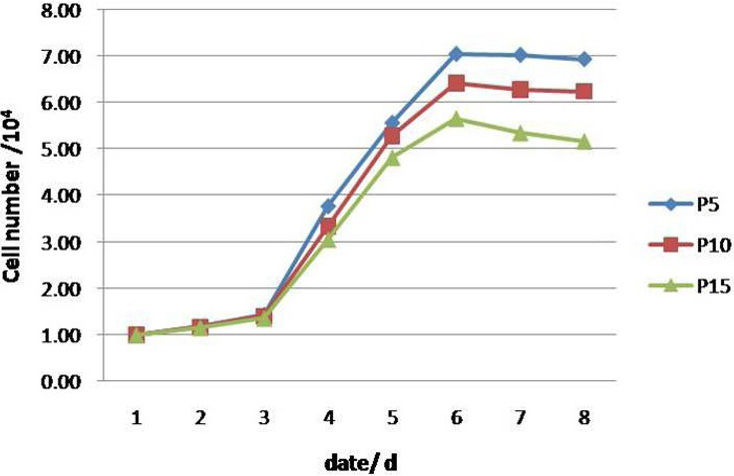
Growth curves of the AMSCs. The growth curves of P5, P10, and P15 AMSCs were all typical S curve with cell number represented by the vertical axis. The PDT was 31.23 h, 32.92 h and 35.04 h for P5, P10 and P15, respectively.
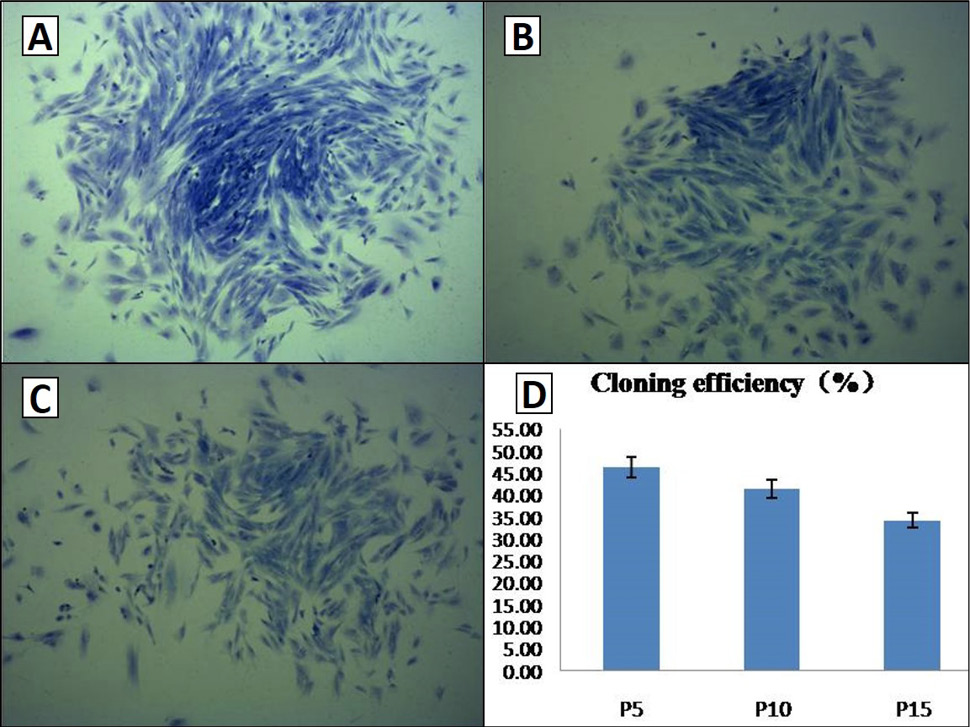
Colony-forming cell assay. Colony-forming units of P5, P10, and P15 AMSCs were counted, which suggests that colony-forming rates declined with the increase of the passage. A, B and C, colony-forming units of P5, P10 and P15, respectively; D, the bar chart of colony-forming rates for different passages of AMSCs. Scale bar, 100μm.

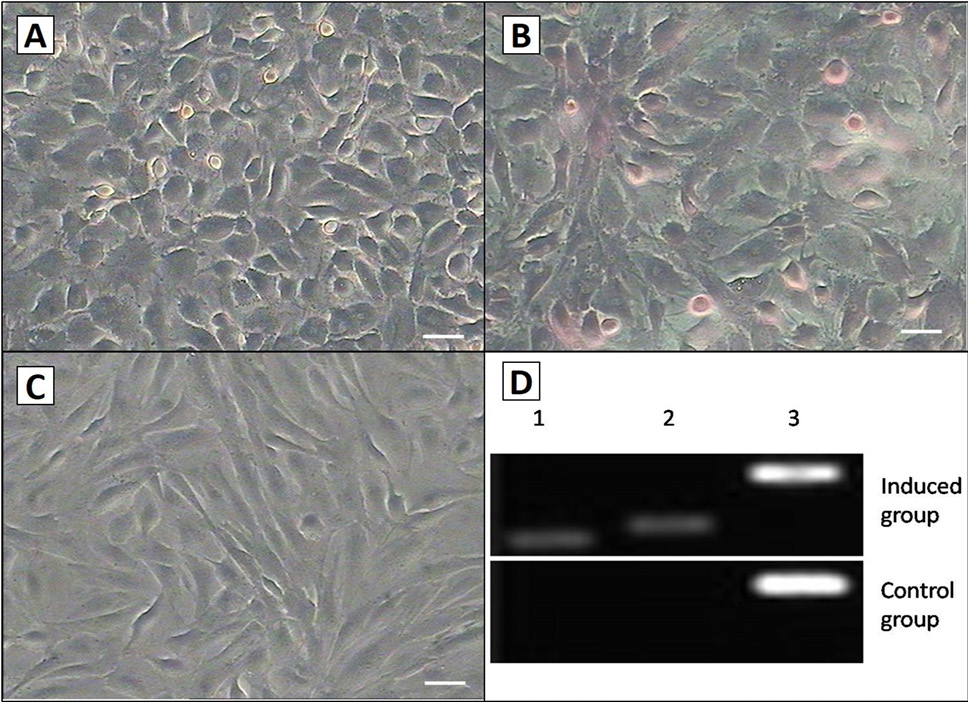
Adipogenic differentiation of the AMSCs. A, AMSCs were inducted after 1 week, they began to change from fibroblast-like to oblate, and there were a number of lipid droplets in petri dishes. Droplets increased and assembled to form larger ones along with the extension of induction time; B, they were positive for oil red O staining; C, the control group had no difference in the morphology and phenotype, and they were also negative for oil red O staining. Scale bar, 50 μm; D, RT-PCR detection of the adipogenic markers LPL and PPAR-γexpression in the both groups. They were positive in induced cells, but not in control cells. Lane 1, PPAR-γ; Lane 2, LPL; Lane 3, GAPDH.
Osteogenic differentiation of the AMSCs. A, the quantity and size of nodules increased as induction progressed; B, after culturing in osteogenic medium for 3 weeks, cell shape in induced group was changed, and the group was positive by the way of alizarin red staining; C, There was no change in morphology or stained in control group. Scale bar, 50μm; D, RT-PCR detection of the osteogenic markers collage type I and osteopontin expression in the both groups. Induced cells were positive for osteopontin and collage type I, but the control cells were not. Lane 1, GAPDH; Lane 2, collage type I; Lane 3, osteopontin.
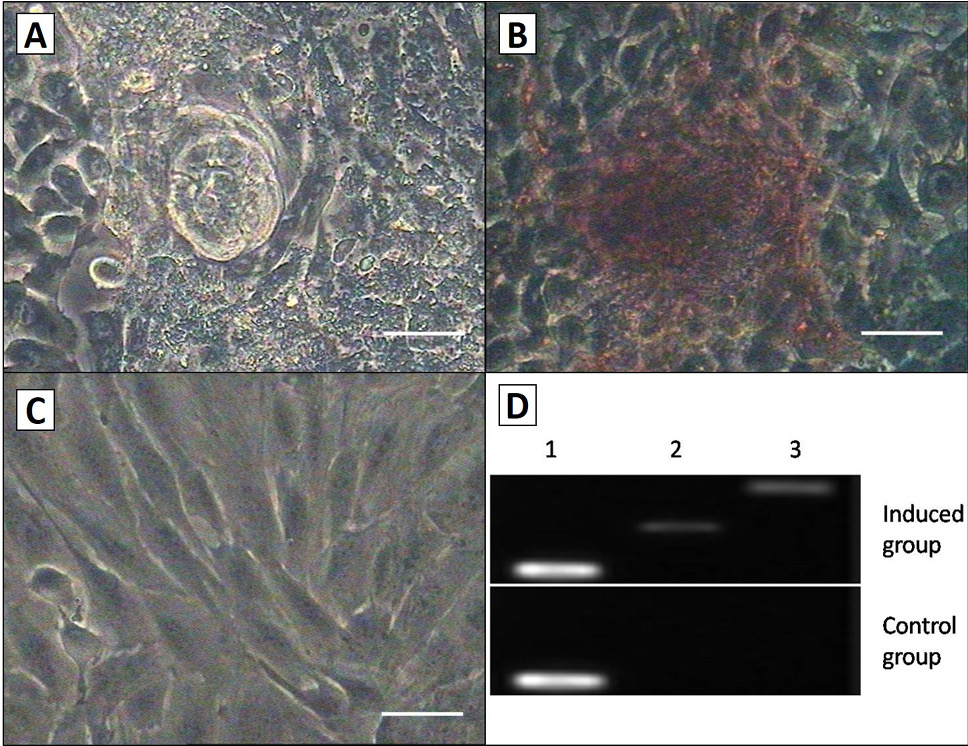
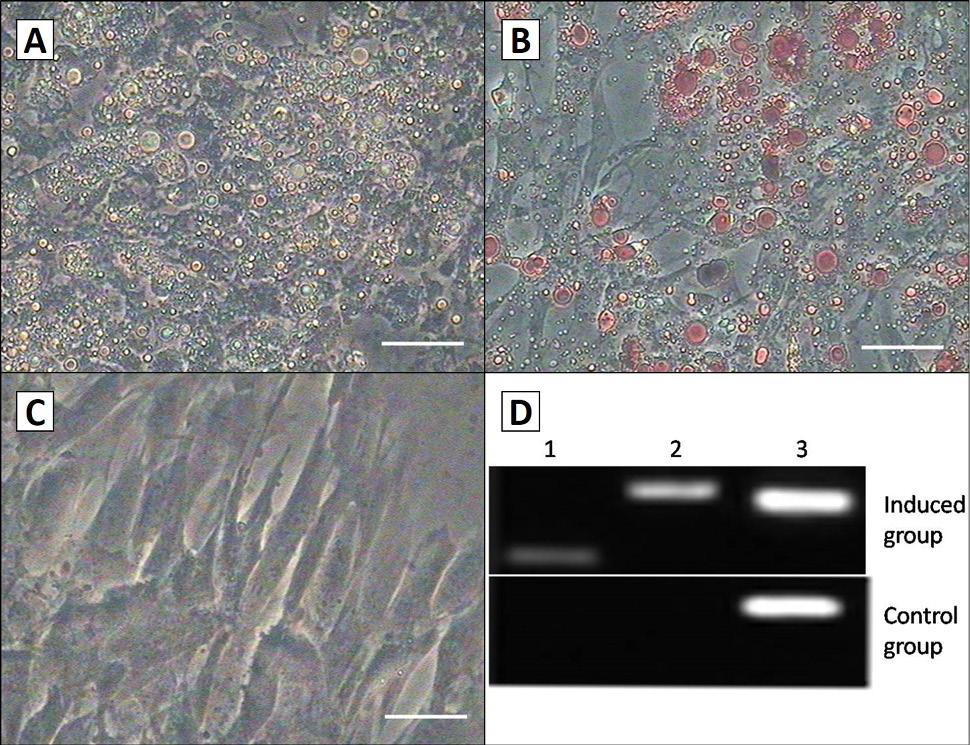
Hepatocyte differentiation of the AMSCs. A, after cultured in hepatocyte medium for 14 days; B, the cell shape was changed, and glycogen staining was positive; C, there was no change in morphology or stained by glycogen in control group after 14 d. Scale bar, 50μm; D, RT-PCR analysis of the Hepatocyte differentiation markers ALB and AFP expression in induced group and control group. Induced cells were positive for ALB and AFP, but the control cells were not. Lane 1, ALB; Lane 2, AFP; Lane 3, GAPDH.


