
Near-Infrared Spectroscopy (NIRS) Application for Quantitative Characterization of Edible Grains


Near-Infrared Spectroscopy (NIRS) Application for Quantitative Characterization of Edible Grains
Saba Iqbal1, Salman Khurshid1*, Hafiza Mehwish Iqbal1, Qurrat-Ul-Ain Akbar1, Aqeel Ahmed Siddique3, Saqib Arif1, Shahid Yousaf2, Masooma Munir4, Abdul Karim Khan4, Shazia Arif5, Abdul Ahad6 and Muhammad Arif7
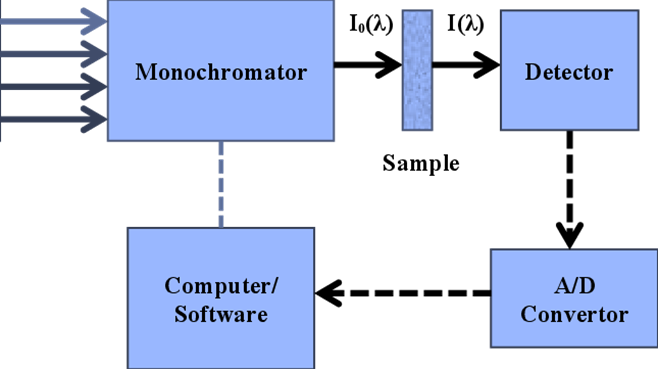
Figure 1:
Near infrared spectroscopy schematic diagram.
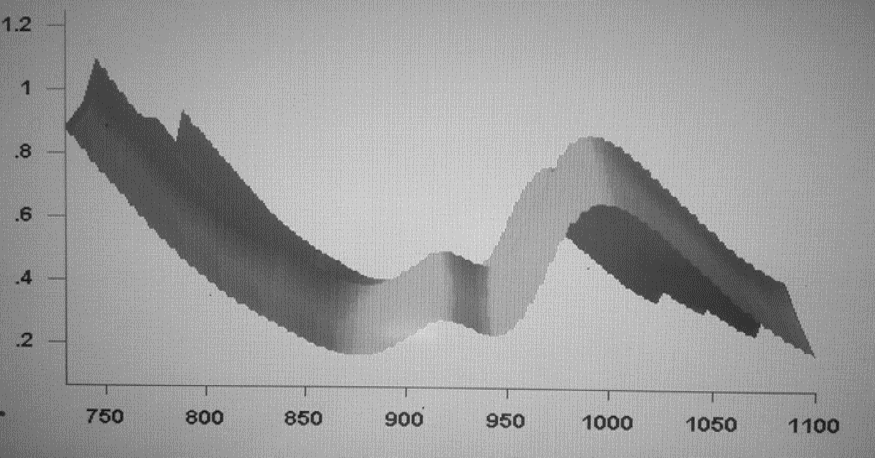
Figure 2:
Representative NIR-spectra of wheat hardness.
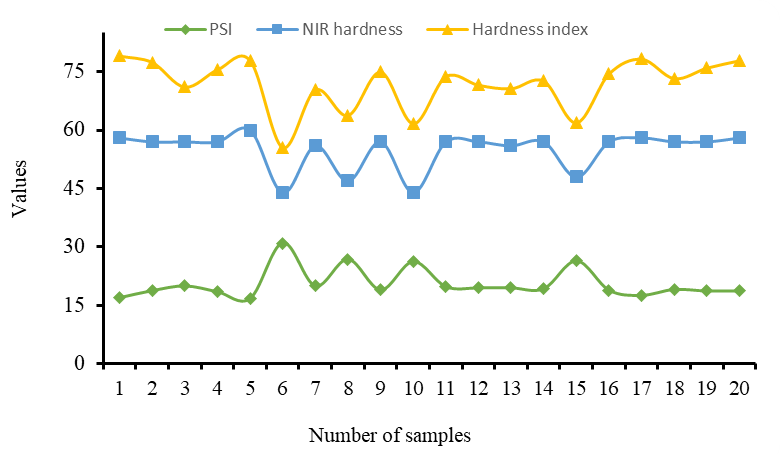
Figure 3:
Comparison of near-infrared (NIR) spectrometry with reference methods for hardness of wheat.

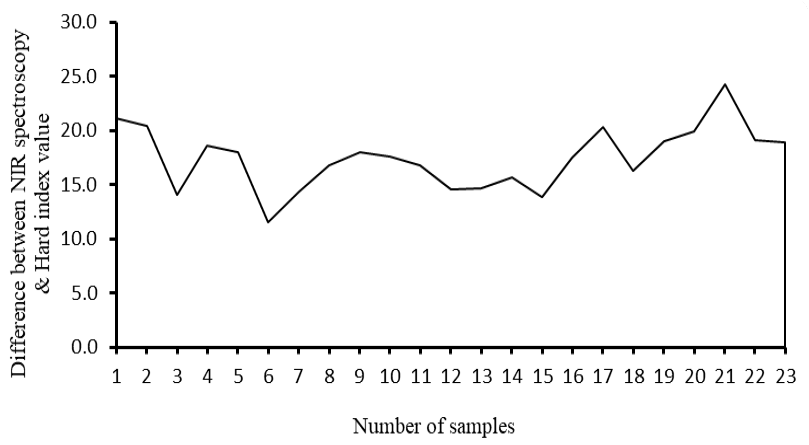
Figure 4:
Differences between NIR and hardness index values.
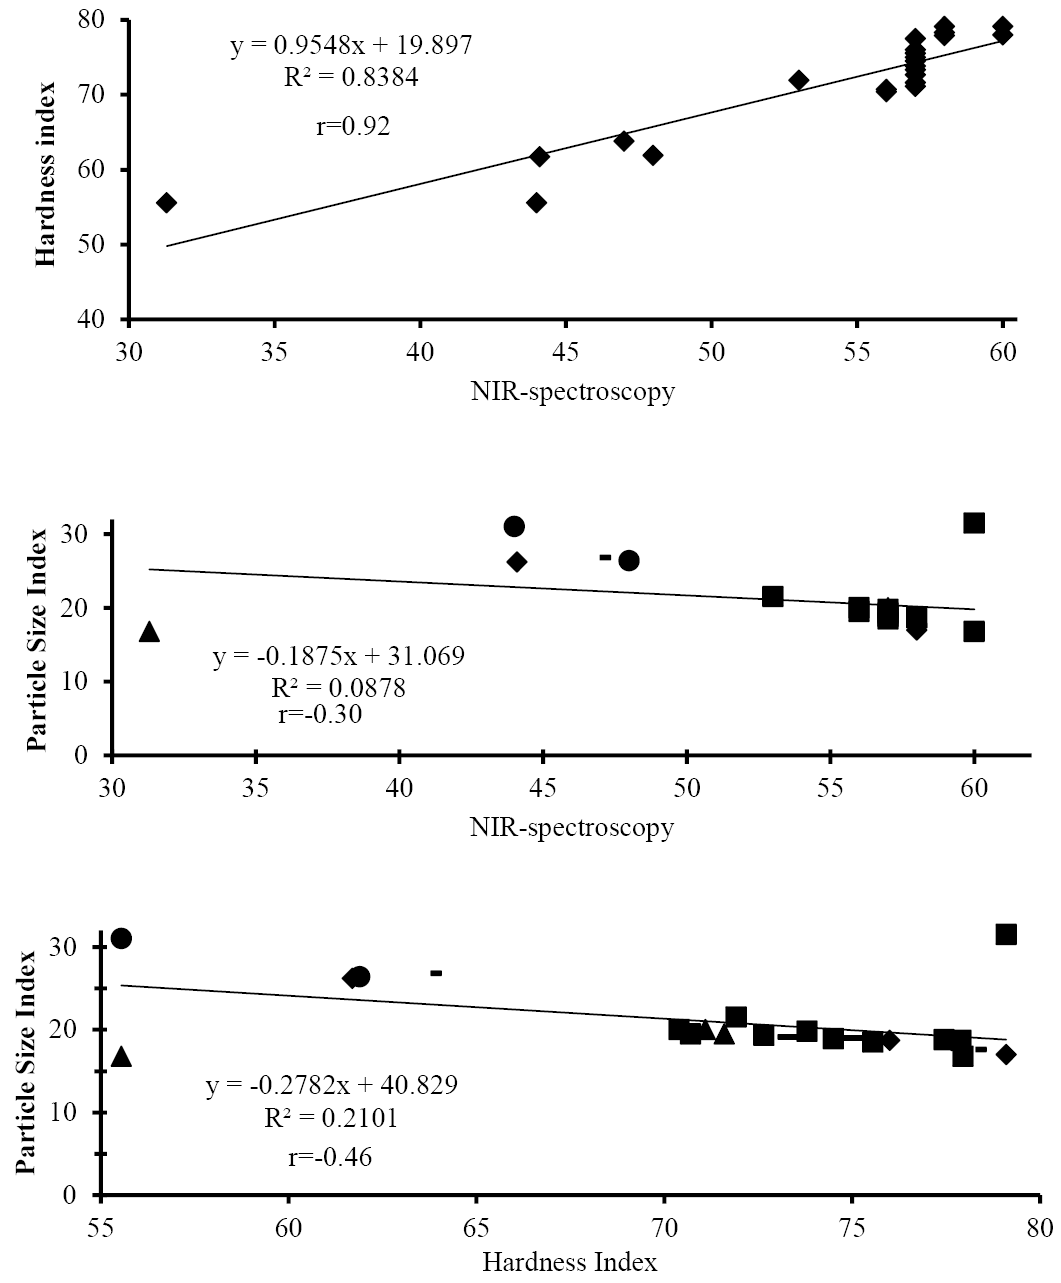
Figure 5:
Correlation coefficients (r) between harness values of near-infrared (NIR) spectrometry and reference methods.
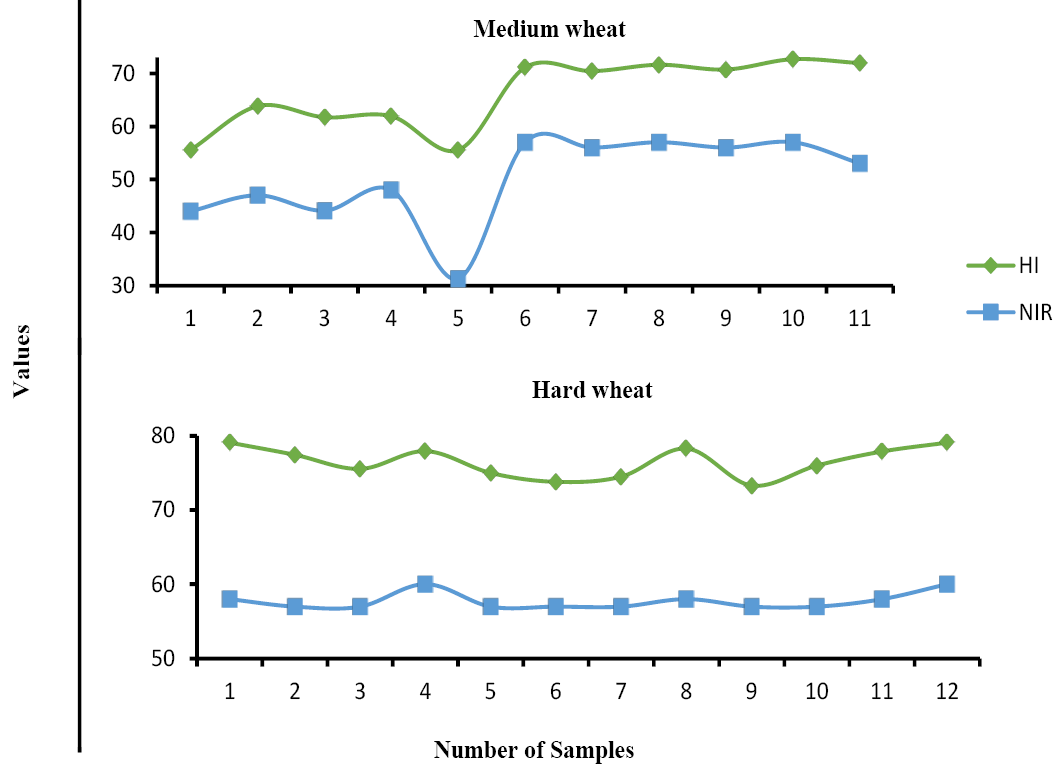
Figure 6:
Hardness values of medium and hard group of wheat samples.

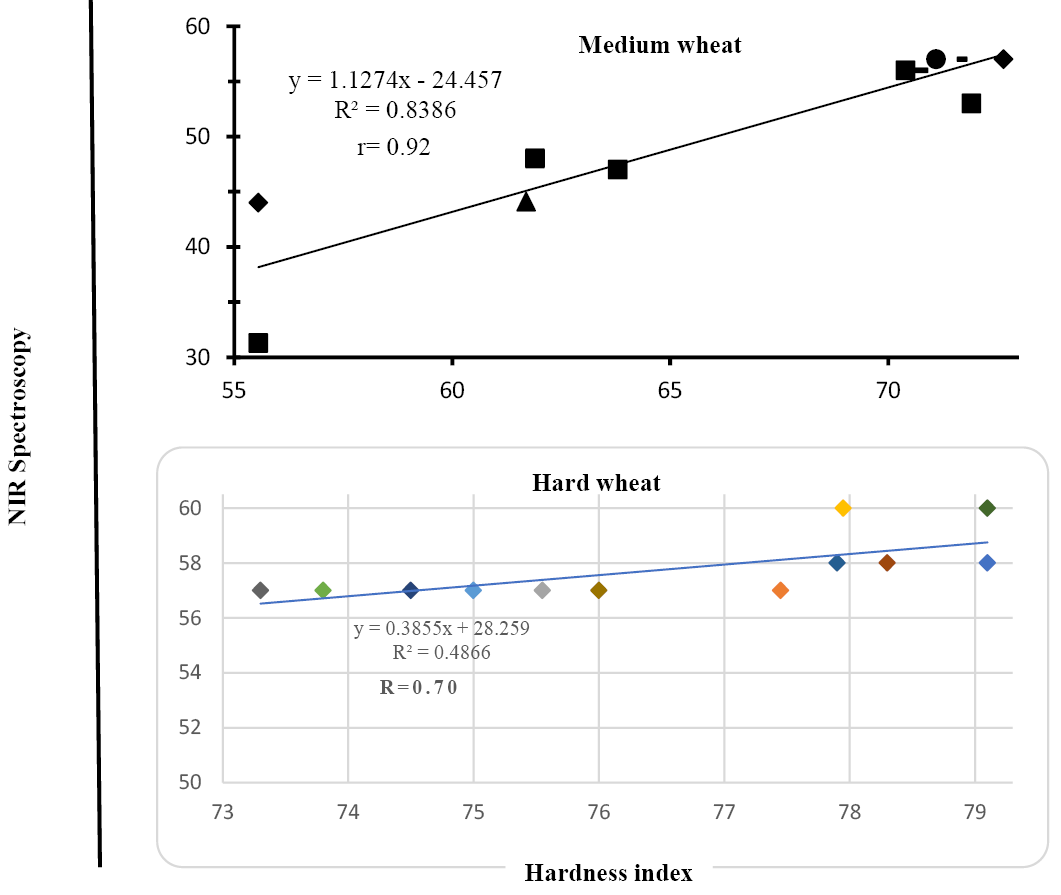
Figure 7:
Correlation coefficients (r) between NIR and hardness index values of medium and hard wheat samples
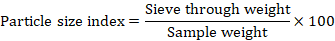
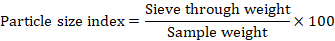
Equation 1
December 2022
Vol.35, Iss. 4, Pages 578-684
